

Key Insights
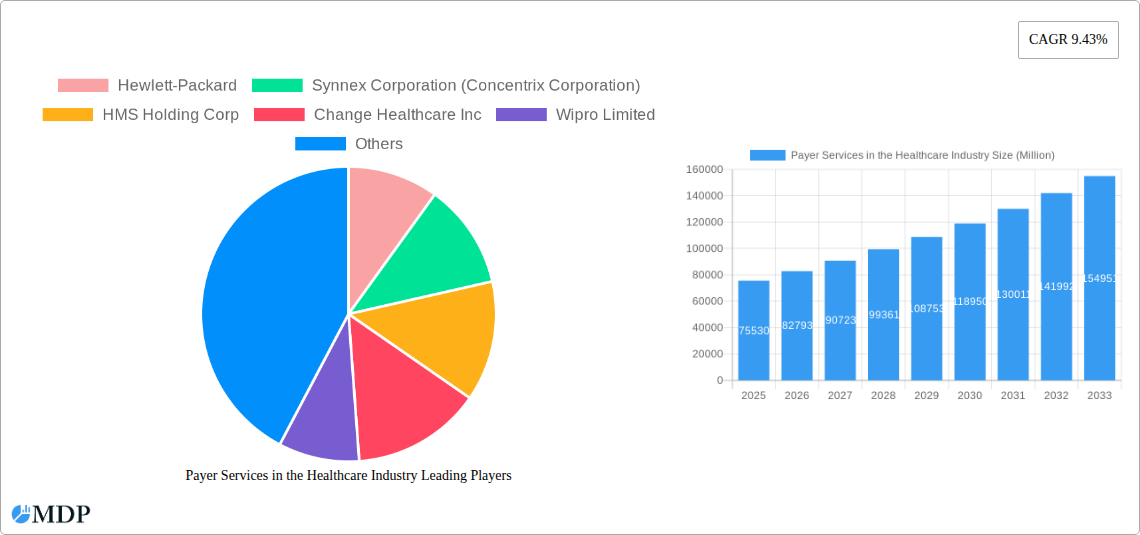
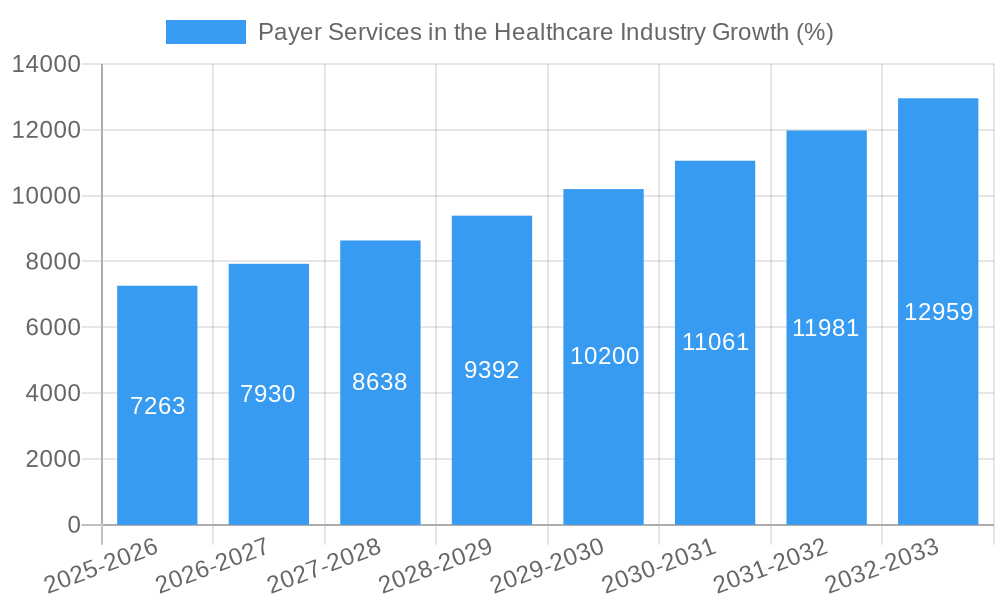
The healthcare payer services market, valued at $75.53 billion in 2025, is experiencing robust growth, projected to expand at a compound annual growth rate (CAGR) of 9.43% from 2025 to 2033. This expansion is driven by several key factors. The increasing adoption of value-based care models necessitates sophisticated claims management and analytics capabilities, fueling demand for outsourcing services. Simultaneously, the rising prevalence of chronic diseases and an aging population are increasing healthcare utilization, thereby intensifying the need for efficient member and provider management services. Technological advancements, particularly in areas like artificial intelligence and machine learning, are also significantly impacting the industry, enabling more accurate fraud detection, improved claims processing, and enhanced patient engagement. The market segmentation reflects this multifaceted growth, with strong demand across various service types, including business process outsourcing (BPO), IT outsourcing, and knowledge process outsourcing (KPO). Private payers are leading the charge in adopting these solutions, seeking to optimize operational efficiencies and improve cost management.
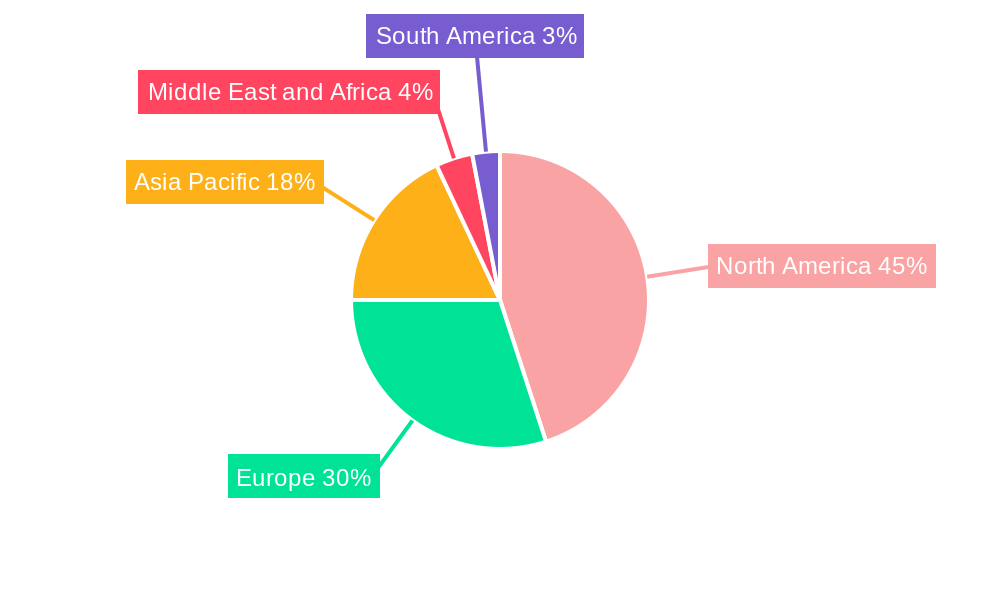
Geographic distribution shows a concentration of market share in North America, followed by Europe and Asia Pacific. However, emerging markets in Asia Pacific and the Middle East and Africa are poised for significant growth due to increasing healthcare investment and infrastructure development. The competitive landscape is characterized by a mix of established global players like Accenture, Cognizant, and Wipro, alongside specialized healthcare IT companies and regional providers. This competition is fostering innovation and driving down costs, making payer services more accessible and affordable for healthcare organizations. The continued focus on data security and regulatory compliance, coupled with a greater emphasis on interoperability, will further shape the market's trajectory in the coming years.
Payer Services in the Healthcare Industry: A Comprehensive Market Report (2019-2033)
This comprehensive report provides an in-depth analysis of the Payer Services market in the healthcare industry, offering invaluable insights for stakeholders across the value chain. The study covers the period from 2019 to 2033, with a focus on the 2025-2033 forecast period. The report leverages data from the base year (2025) to project market trends and growth opportunities, providing crucial information for strategic decision-making. The market is projected to reach $XX Million by 2033, exhibiting a CAGR of XX% during the forecast period.
Payer Services in the Healthcare Industry Market Dynamics & Concentration
The Payer Services market is characterized by a moderately concentrated landscape, with several large players holding significant market share. Key drivers of innovation include advancements in data analytics, AI, and cloud computing. Stringent regulatory frameworks, particularly concerning data privacy and security (like HIPAA), significantly impact market operations. Product substitutes, such as in-house solutions, pose a competitive threat, albeit limited due to the specialized expertise and scale required for comprehensive payer services. End-user trends reveal a growing preference for integrated solutions and outsourced services to enhance efficiency and cost-effectiveness. M&A activities have been relatively frequent in recent years, with approximately XX deals recorded between 2019 and 2024, indicating consolidation within the market. Market share distribution among top players is approximately as follows:
- McKESSON Corporation: 15%
- Change Healthcare Inc: 12%
- Accenture PLC: 10%
- Cognizant Technology Solutions: 8%
- Others: 55%
Payer Services in the Healthcare Industry Industry Trends & Analysis
The Payer Services market is experiencing robust growth, driven by several key factors. The increasing adoption of value-based care models necessitates efficient claims processing and risk management, fueling demand for advanced payer services. Technological disruptions, particularly the rise of cloud-based solutions and AI-powered analytics, are transforming operational efficiencies and improving decision-making. Consumer preferences are shifting towards personalized healthcare experiences and seamless access to information, requiring payers to invest in advanced member management solutions. Intense competition is driving innovation and a focus on cost-optimization, with players continuously seeking to improve their service offerings and expand their market reach. The market is expected to maintain a strong growth trajectory, driven by a projected CAGR of XX% between 2025 and 2033, with market penetration reaching XX% by 2033.
Leading Markets & Segments in Payer Services in the Healthcare Industry
The North American market currently dominates the global Payer Services landscape, driven by factors such as high healthcare expenditure, advanced technological infrastructure, and a robust regulatory environment. Within the market segments, the following trends are observed:
End User:
- Private Payers: This segment is growing rapidly, driven by the increasing adoption of value-based care and the need for efficient claims processing.
- Public Payers: This segment presents significant opportunities, particularly in emerging economies with growing healthcare systems.
Service Type:
- Business Process Outsourcing (BPO): This remains the largest segment due to its cost-effectiveness and scalability.
- IT Outsourcing Services: This segment is rapidly expanding, driven by the increasing reliance on technology in healthcare operations.
- Knowledge Process Outsourcing (KPO): This segment demonstrates strong growth potential, particularly in areas such as analytics and fraud management.
Application:
- Claims management services: This application area holds the largest market share due to the inherent complexities and volume of claims processing.
- Integrated front office and back office operations: The demand for integrated solutions is increasing to streamline processes and reduce costs.
- Member management services: Growth is driven by the need for personalized healthcare experiences and improved patient engagement.
- Provider management services: This segment is crucial for efficient network management and cost containment.
- Billing and accounts management services: This segment is experiencing growth due to the complexities of healthcare billing processes.
- Analytics and fraud management services: This segment is showing increasing importance, driven by the rising prevalence of healthcare fraud.
- Human Resource Services: Growth is fueled by the need for efficient talent management in the healthcare industry.
Key Drivers: The US market's dominance is largely attributed to advanced healthcare infrastructure, high technology adoption, and favorable government policies. In other regions, economic growth and improving healthcare infrastructure are critical drivers.
Payer Services in the Healthcare Industry Product Developments
Recent product innovations have focused on leveraging AI and machine learning for improved claims processing, fraud detection, and predictive analytics. Cloud-based solutions offer enhanced scalability and flexibility, while automation tools are streamlining administrative tasks. These advancements provide competitive advantages through cost reduction, enhanced accuracy, and improved decision-making. The market is seeing a significant trend towards integrated platforms that provide comprehensive payer services, encompassing multiple applications.
Key Drivers of Payer Services in the Healthcare Industry Growth
Several key factors are driving growth in the Payer Services market. Technological advancements, particularly in AI and big data analytics, are improving efficiency and enabling better risk management. Government initiatives promoting value-based care are creating demand for specialized payer services. The increasing adoption of cloud-based solutions is enhancing scalability and flexibility, while regulatory changes are prompting payers to invest in advanced compliance solutions. Finally, the rising adoption of telehealth and remote patient monitoring is creating opportunities for new services and solutions.
Challenges in the Payer Services in the Healthcare Industry Market
The Payer Services market faces several challenges. Stringent regulatory requirements, especially regarding data privacy and security, increase operational complexities and costs. Supply chain disruptions can impact service delivery and increase expenses. Intense competition and the need to maintain cost-effectiveness necessitate continuous innovation and efficiency improvements. These challenges can lead to decreased margins and pressure to provide value-added services. For instance, HIPAA compliance alone can cost payer companies millions of dollars annually.
Emerging Opportunities in Payer Services in the Healthcare Industry
The long-term growth of the Payer Services market is fueled by several opportunities. Technological breakthroughs in AI, machine learning, and blockchain are poised to revolutionize claims processing, fraud detection, and risk management. Strategic partnerships between payers and technology providers can enhance service offerings and create new revenue streams. Expansion into emerging markets with growing healthcare systems presents significant untapped potential. Additionally, the increasing focus on personalized medicine and preventative care creates demand for specialized services and analytics.
Leading Players in the Payer Services in the Healthcare Industry Sector
- Hewlett-Packard
- Synnex Corporation (Concentrix Corporation)
- HMS Holding Corp
- Change Healthcare Inc
- Wipro Limited
- Accenture PLC
- Xerox Corporation
- HCL Technologies Ltd
- Dell Inc
- Cognizant Technology Solutions
- McKESSON Corporation
- Genpact Limited
Key Milestones in Payer Services in the Healthcare Industry Industry
- 2020: Significant increase in telehealth adoption due to the COVID-19 pandemic, leading to increased demand for remote patient monitoring and virtual claims processing.
- 2021: Several major mergers and acquisitions in the payer services space, resulting in greater market consolidation.
- 2022: Launch of several new AI-powered solutions for claims processing and fraud detection.
- 2023: Increased regulatory scrutiny on data privacy and security, prompting investment in advanced compliance solutions.
- 2024: Growing adoption of cloud-based solutions for improved scalability and efficiency.
Strategic Outlook for Payer Services in the Healthcare Industry Market
The Payer Services market is poised for substantial growth, driven by technological advancements, increasing healthcare expenditure, and the ongoing shift towards value-based care. Strategic opportunities exist for players who can leverage AI and data analytics to improve efficiency, enhance patient experiences, and comply with evolving regulations. Focusing on integrated solutions, expanding into emerging markets, and forging strategic partnerships will be crucial for success in this dynamic market. The market is expected to witness continued innovation and consolidation, with significant growth potential in the years to come.
Payer Services in the Healthcare Industry Segmentation
-
1. Service Type
- 1.1. Business Process Outsourcing
- 1.2. IT Outsourcing Services
- 1.3. Knowledge Process Outsourcing (KPO) Services
-
2. Application
- 2.1. Claims management services
- 2.2. Integrat
- 2.3. Member management services
- 2.4. Provider management services
- 2.5. Billing and accounts management services
- 2.6. Analytics and fraud management services
- 2.7. Human Resource Services
-
3. End User
- 3.1. Private Payers
- 3.2. Public Payers
Payer Services in the Healthcare Industry Segmentation By Geography
-
1. North America
- 1.1. United States
- 1.2. Canada
- 1.3. Mexico
-
2. Europe
- 2.1. Germany
- 2.2. United Kingdom
- 2.3. France
- 2.4. Italy
- 2.5. Spain
- 2.6. Rest of Europe
-
3. Asia Pacific
- 3.1. China
- 3.2. Japan
- 3.3. India
- 3.4. Australia
- 3.5. South Korea
- 3.6. Rest of Asia Pacific
-
4. Middle East and Africa
- 4.1. GCC
- 4.2. South Africa
- 4.3. Rest of Middle East and Africa
-
5. South America
- 5.1. Brazil
- 5.2. Argentina
- 5.3. Rest of South America
Payer Services in the Healthcare Industry REPORT HIGHLIGHTS
| Aspects | Details |
|---|---|
| Study Period | 2019-2033 |
| Base Year | 2024 |
| Estimated Year | 2025 |
| Forecast Period | 2025-2033 |
| Historical Period | 2019-2024 |
| Growth Rate | CAGR of 9.43% from 2019-2033 |
| Segmentation |
|
Table of Contents
- 1. Introduction
- 1.1. Research Scope
- 1.2. Market Segmentation
- 1.3. Research Methodology
- 1.4. Definitions and Assumptions
- 2. Executive Summary
- 2.1. Introduction
- 3. Market Dynamics
- 3.1. Introduction
- 3.2. Market Drivers
- 3.2.1. Rise In Adoption of Health Insurance Policies; Rise In Healthcare Frauds; Growing Burden of Chronic Diseases
- 3.3. Market Restrains
- 3.3.1. High Incidences of Data Breaches and Loss of Confidentiality; Unpredicted Costs Associated With Outsourcing
- 3.4. Market Trends
- 3.4.1. Claims Management Services Segment Is Expected To Hold A Major Share In The Market.
- 4. Market Factor Analysis
- 4.1. Porters Five Forces
- 4.2. Supply/Value Chain
- 4.3. PESTEL analysis
- 4.4. Market Entropy
- 4.5. Patent/Trademark Analysis
- 5. Global Payer Services in the Healthcare Industry Analysis, Insights and Forecast, 2019-2031
- 5.1. Market Analysis, Insights and Forecast - by Service Type
- 5.1.1. Business Process Outsourcing
- 5.1.2. IT Outsourcing Services
- 5.1.3. Knowledge Process Outsourcing (KPO) Services
- 5.2. Market Analysis, Insights and Forecast - by Application
- 5.2.1. Claims management services
- 5.2.2. Integrat
- 5.2.3. Member management services
- 5.2.4. Provider management services
- 5.2.5. Billing and accounts management services
- 5.2.6. Analytics and fraud management services
- 5.2.7. Human Resource Services
- 5.3. Market Analysis, Insights and Forecast - by End User
- 5.3.1. Private Payers
- 5.3.2. Public Payers
- 5.4. Market Analysis, Insights and Forecast - by Region
- 5.4.1. North America
- 5.4.2. Europe
- 5.4.3. Asia Pacific
- 5.4.4. Middle East and Africa
- 5.4.5. South America
- 5.1. Market Analysis, Insights and Forecast - by Service Type
- 6. North America Payer Services in the Healthcare Industry Analysis, Insights and Forecast, 2019-2031
- 6.1. Market Analysis, Insights and Forecast - by Service Type
- 6.1.1. Business Process Outsourcing
- 6.1.2. IT Outsourcing Services
- 6.1.3. Knowledge Process Outsourcing (KPO) Services
- 6.2. Market Analysis, Insights and Forecast - by Application
- 6.2.1. Claims management services
- 6.2.2. Integrat
- 6.2.3. Member management services
- 6.2.4. Provider management services
- 6.2.5. Billing and accounts management services
- 6.2.6. Analytics and fraud management services
- 6.2.7. Human Resource Services
- 6.3. Market Analysis, Insights and Forecast - by End User
- 6.3.1. Private Payers
- 6.3.2. Public Payers
- 6.1. Market Analysis, Insights and Forecast - by Service Type
- 7. Europe Payer Services in the Healthcare Industry Analysis, Insights and Forecast, 2019-2031
- 7.1. Market Analysis, Insights and Forecast - by Service Type
- 7.1.1. Business Process Outsourcing
- 7.1.2. IT Outsourcing Services
- 7.1.3. Knowledge Process Outsourcing (KPO) Services
- 7.2. Market Analysis, Insights and Forecast - by Application
- 7.2.1. Claims management services
- 7.2.2. Integrat
- 7.2.3. Member management services
- 7.2.4. Provider management services
- 7.2.5. Billing and accounts management services
- 7.2.6. Analytics and fraud management services
- 7.2.7. Human Resource Services
- 7.3. Market Analysis, Insights and Forecast - by End User
- 7.3.1. Private Payers
- 7.3.2. Public Payers
- 7.1. Market Analysis, Insights and Forecast - by Service Type
- 8. Asia Pacific Payer Services in the Healthcare Industry Analysis, Insights and Forecast, 2019-2031
- 8.1. Market Analysis, Insights and Forecast - by Service Type
- 8.1.1. Business Process Outsourcing
- 8.1.2. IT Outsourcing Services
- 8.1.3. Knowledge Process Outsourcing (KPO) Services
- 8.2. Market Analysis, Insights and Forecast - by Application
- 8.2.1. Claims management services
- 8.2.2. Integrat
- 8.2.3. Member management services
- 8.2.4. Provider management services
- 8.2.5. Billing and accounts management services
- 8.2.6. Analytics and fraud management services
- 8.2.7. Human Resource Services
- 8.3. Market Analysis, Insights and Forecast - by End User
- 8.3.1. Private Payers
- 8.3.2. Public Payers
- 8.1. Market Analysis, Insights and Forecast - by Service Type
- 9. Middle East and Africa Payer Services in the Healthcare Industry Analysis, Insights and Forecast, 2019-2031
- 9.1. Market Analysis, Insights and Forecast - by Service Type
- 9.1.1. Business Process Outsourcing
- 9.1.2. IT Outsourcing Services
- 9.1.3. Knowledge Process Outsourcing (KPO) Services
- 9.2. Market Analysis, Insights and Forecast - by Application
- 9.2.1. Claims management services
- 9.2.2. Integrat
- 9.2.3. Member management services
- 9.2.4. Provider management services
- 9.2.5. Billing and accounts management services
- 9.2.6. Analytics and fraud management services
- 9.2.7. Human Resource Services
- 9.3. Market Analysis, Insights and Forecast - by End User
- 9.3.1. Private Payers
- 9.3.2. Public Payers
- 9.1. Market Analysis, Insights and Forecast - by Service Type
- 10. South America Payer Services in the Healthcare Industry Analysis, Insights and Forecast, 2019-2031
- 10.1. Market Analysis, Insights and Forecast - by Service Type
- 10.1.1. Business Process Outsourcing
- 10.1.2. IT Outsourcing Services
- 10.1.3. Knowledge Process Outsourcing (KPO) Services
- 10.2. Market Analysis, Insights and Forecast - by Application
- 10.2.1. Claims management services
- 10.2.2. Integrat
- 10.2.3. Member management services
- 10.2.4. Provider management services
- 10.2.5. Billing and accounts management services
- 10.2.6. Analytics and fraud management services
- 10.2.7. Human Resource Services
- 10.3. Market Analysis, Insights and Forecast - by End User
- 10.3.1. Private Payers
- 10.3.2. Public Payers
- 10.1. Market Analysis, Insights and Forecast - by Service Type
- 11. North America Payer Services in the Healthcare Industry Analysis, Insights and Forecast, 2019-2031
- 11.1. Market Analysis, Insights and Forecast - By Country/Sub-region
- 11.1.1 United States
- 11.1.2 Canada
- 11.1.3 Mexico
- 12. Europe Payer Services in the Healthcare Industry Analysis, Insights and Forecast, 2019-2031
- 12.1. Market Analysis, Insights and Forecast - By Country/Sub-region
- 12.1.1 Germany
- 12.1.2 United Kingdom
- 12.1.3 France
- 12.1.4 Italy
- 12.1.5 Spain
- 12.1.6 Rest of Europe
- 13. Asia Pacific Payer Services in the Healthcare Industry Analysis, Insights and Forecast, 2019-2031
- 13.1. Market Analysis, Insights and Forecast - By Country/Sub-region
- 13.1.1 China
- 13.1.2 Japan
- 13.1.3 India
- 13.1.4 Australia
- 13.1.5 South Korea
- 13.1.6 Rest of Asia Pacific
- 14. Middle East and Africa Payer Services in the Healthcare Industry Analysis, Insights and Forecast, 2019-2031
- 14.1. Market Analysis, Insights and Forecast - By Country/Sub-region
- 14.1.1 GCC
- 14.1.2 South Africa
- 14.1.3 Rest of Middle East and Africa
- 15. South America Payer Services in the Healthcare Industry Analysis, Insights and Forecast, 2019-2031
- 15.1. Market Analysis, Insights and Forecast - By Country/Sub-region
- 15.1.1 Brazil
- 15.1.2 Argentina
- 15.1.3 Rest of South America
- 16. Competitive Analysis
- 16.1. Global Market Share Analysis 2024
- 16.2. Company Profiles
- 16.2.1 Hewlett-Packard
- 16.2.1.1. Overview
- 16.2.1.2. Products
- 16.2.1.3. SWOT Analysis
- 16.2.1.4. Recent Developments
- 16.2.1.5. Financials (Based on Availability)
- 16.2.2 Synnex Corporation (Concentrix Corporation)
- 16.2.2.1. Overview
- 16.2.2.2. Products
- 16.2.2.3. SWOT Analysis
- 16.2.2.4. Recent Developments
- 16.2.2.5. Financials (Based on Availability)
- 16.2.3 HMS Holding Corp
- 16.2.3.1. Overview
- 16.2.3.2. Products
- 16.2.3.3. SWOT Analysis
- 16.2.3.4. Recent Developments
- 16.2.3.5. Financials (Based on Availability)
- 16.2.4 Change Healthcare Inc
- 16.2.4.1. Overview
- 16.2.4.2. Products
- 16.2.4.3. SWOT Analysis
- 16.2.4.4. Recent Developments
- 16.2.4.5. Financials (Based on Availability)
- 16.2.5 Wipro Limited
- 16.2.5.1. Overview
- 16.2.5.2. Products
- 16.2.5.3. SWOT Analysis
- 16.2.5.4. Recent Developments
- 16.2.5.5. Financials (Based on Availability)
- 16.2.6 Accenture PLC
- 16.2.6.1. Overview
- 16.2.6.2. Products
- 16.2.6.3. SWOT Analysis
- 16.2.6.4. Recent Developments
- 16.2.6.5. Financials (Based on Availability)
- 16.2.7 Xerox Corporation
- 16.2.7.1. Overview
- 16.2.7.2. Products
- 16.2.7.3. SWOT Analysis
- 16.2.7.4. Recent Developments
- 16.2.7.5. Financials (Based on Availability)
- 16.2.8 HCL Technologies Ltd
- 16.2.8.1. Overview
- 16.2.8.2. Products
- 16.2.8.3. SWOT Analysis
- 16.2.8.4. Recent Developments
- 16.2.8.5. Financials (Based on Availability)
- 16.2.9 Dell Inc
- 16.2.9.1. Overview
- 16.2.9.2. Products
- 16.2.9.3. SWOT Analysis
- 16.2.9.4. Recent Developments
- 16.2.9.5. Financials (Based on Availability)
- 16.2.10 Cognizant Technology Solutions
- 16.2.10.1. Overview
- 16.2.10.2. Products
- 16.2.10.3. SWOT Analysis
- 16.2.10.4. Recent Developments
- 16.2.10.5. Financials (Based on Availability)
- 16.2.11 McKESSON Corporation
- 16.2.11.1. Overview
- 16.2.11.2. Products
- 16.2.11.3. SWOT Analysis
- 16.2.11.4. Recent Developments
- 16.2.11.5. Financials (Based on Availability)
- 16.2.12 Genpact Limited
- 16.2.12.1. Overview
- 16.2.12.2. Products
- 16.2.12.3. SWOT Analysis
- 16.2.12.4. Recent Developments
- 16.2.12.5. Financials (Based on Availability)
- 16.2.1 Hewlett-Packard
List of Figures
- Figure 1: Global Payer Services in the Healthcare Industry Revenue Breakdown (Million, %) by Region 2024 & 2032
- Figure 2: North America Payer Services in the Healthcare Industry Revenue (Million), by Country 2024 & 2032
- Figure 3: North America Payer Services in the Healthcare Industry Revenue Share (%), by Country 2024 & 2032
- Figure 4: Europe Payer Services in the Healthcare Industry Revenue (Million), by Country 2024 & 2032
- Figure 5: Europe Payer Services in the Healthcare Industry Revenue Share (%), by Country 2024 & 2032
- Figure 6: Asia Pacific Payer Services in the Healthcare Industry Revenue (Million), by Country 2024 & 2032
- Figure 7: Asia Pacific Payer Services in the Healthcare Industry Revenue Share (%), by Country 2024 & 2032
- Figure 8: Middle East and Africa Payer Services in the Healthcare Industry Revenue (Million), by Country 2024 & 2032
- Figure 9: Middle East and Africa Payer Services in the Healthcare Industry Revenue Share (%), by Country 2024 & 2032
- Figure 10: South America Payer Services in the Healthcare Industry Revenue (Million), by Country 2024 & 2032
- Figure 11: South America Payer Services in the Healthcare Industry Revenue Share (%), by Country 2024 & 2032
- Figure 12: North America Payer Services in the Healthcare Industry Revenue (Million), by Service Type 2024 & 2032
- Figure 13: North America Payer Services in the Healthcare Industry Revenue Share (%), by Service Type 2024 & 2032
- Figure 14: North America Payer Services in the Healthcare Industry Revenue (Million), by Application 2024 & 2032
- Figure 15: North America Payer Services in the Healthcare Industry Revenue Share (%), by Application 2024 & 2032
- Figure 16: North America Payer Services in the Healthcare Industry Revenue (Million), by End User 2024 & 2032
- Figure 17: North America Payer Services in the Healthcare Industry Revenue Share (%), by End User 2024 & 2032
- Figure 18: North America Payer Services in the Healthcare Industry Revenue (Million), by Country 2024 & 2032
- Figure 19: North America Payer Services in the Healthcare Industry Revenue Share (%), by Country 2024 & 2032
- Figure 20: Europe Payer Services in the Healthcare Industry Revenue (Million), by Service Type 2024 & 2032
- Figure 21: Europe Payer Services in the Healthcare Industry Revenue Share (%), by Service Type 2024 & 2032
- Figure 22: Europe Payer Services in the Healthcare Industry Revenue (Million), by Application 2024 & 2032
- Figure 23: Europe Payer Services in the Healthcare Industry Revenue Share (%), by Application 2024 & 2032
- Figure 24: Europe Payer Services in the Healthcare Industry Revenue (Million), by End User 2024 & 2032
- Figure 25: Europe Payer Services in the Healthcare Industry Revenue Share (%), by End User 2024 & 2032
- Figure 26: Europe Payer Services in the Healthcare Industry Revenue (Million), by Country 2024 & 2032
- Figure 27: Europe Payer Services in the Healthcare Industry Revenue Share (%), by Country 2024 & 2032
- Figure 28: Asia Pacific Payer Services in the Healthcare Industry Revenue (Million), by Service Type 2024 & 2032
- Figure 29: Asia Pacific Payer Services in the Healthcare Industry Revenue Share (%), by Service Type 2024 & 2032
- Figure 30: Asia Pacific Payer Services in the Healthcare Industry Revenue (Million), by Application 2024 & 2032
- Figure 31: Asia Pacific Payer Services in the Healthcare Industry Revenue Share (%), by Application 2024 & 2032
- Figure 32: Asia Pacific Payer Services in the Healthcare Industry Revenue (Million), by End User 2024 & 2032
- Figure 33: Asia Pacific Payer Services in the Healthcare Industry Revenue Share (%), by End User 2024 & 2032
- Figure 34: Asia Pacific Payer Services in the Healthcare Industry Revenue (Million), by Country 2024 & 2032
- Figure 35: Asia Pacific Payer Services in the Healthcare Industry Revenue Share (%), by Country 2024 & 2032
- Figure 36: Middle East and Africa Payer Services in the Healthcare Industry Revenue (Million), by Service Type 2024 & 2032
- Figure 37: Middle East and Africa Payer Services in the Healthcare Industry Revenue Share (%), by Service Type 2024 & 2032
- Figure 38: Middle East and Africa Payer Services in the Healthcare Industry Revenue (Million), by Application 2024 & 2032
- Figure 39: Middle East and Africa Payer Services in the Healthcare Industry Revenue Share (%), by Application 2024 & 2032
- Figure 40: Middle East and Africa Payer Services in the Healthcare Industry Revenue (Million), by End User 2024 & 2032
- Figure 41: Middle East and Africa Payer Services in the Healthcare Industry Revenue Share (%), by End User 2024 & 2032
- Figure 42: Middle East and Africa Payer Services in the Healthcare Industry Revenue (Million), by Country 2024 & 2032
- Figure 43: Middle East and Africa Payer Services in the Healthcare Industry Revenue Share (%), by Country 2024 & 2032
- Figure 44: South America Payer Services in the Healthcare Industry Revenue (Million), by Service Type 2024 & 2032
- Figure 45: South America Payer Services in the Healthcare Industry Revenue Share (%), by Service Type 2024 & 2032
- Figure 46: South America Payer Services in the Healthcare Industry Revenue (Million), by Application 2024 & 2032
- Figure 47: South America Payer Services in the Healthcare Industry Revenue Share (%), by Application 2024 & 2032
- Figure 48: South America Payer Services in the Healthcare Industry Revenue (Million), by End User 2024 & 2032
- Figure 49: South America Payer Services in the Healthcare Industry Revenue Share (%), by End User 2024 & 2032
- Figure 50: South America Payer Services in the Healthcare Industry Revenue (Million), by Country 2024 & 2032
- Figure 51: South America Payer Services in the Healthcare Industry Revenue Share (%), by Country 2024 & 2032
List of Tables
- Table 1: Global Payer Services in the Healthcare Industry Revenue Million Forecast, by Region 2019 & 2032
- Table 2: Global Payer Services in the Healthcare Industry Revenue Million Forecast, by Service Type 2019 & 2032
- Table 3: Global Payer Services in the Healthcare Industry Revenue Million Forecast, by Application 2019 & 2032
- Table 4: Global Payer Services in the Healthcare Industry Revenue Million Forecast, by End User 2019 & 2032
- Table 5: Global Payer Services in the Healthcare Industry Revenue Million Forecast, by Region 2019 & 2032
- Table 6: Global Payer Services in the Healthcare Industry Revenue Million Forecast, by Country 2019 & 2032
- Table 7: United States Payer Services in the Healthcare Industry Revenue (Million) Forecast, by Application 2019 & 2032
- Table 8: Canada Payer Services in the Healthcare Industry Revenue (Million) Forecast, by Application 2019 & 2032
- Table 9: Mexico Payer Services in the Healthcare Industry Revenue (Million) Forecast, by Application 2019 & 2032
- Table 10: Global Payer Services in the Healthcare Industry Revenue Million Forecast, by Country 2019 & 2032
- Table 11: Germany Payer Services in the Healthcare Industry Revenue (Million) Forecast, by Application 2019 & 2032
- Table 12: United Kingdom Payer Services in the Healthcare Industry Revenue (Million) Forecast, by Application 2019 & 2032
- Table 13: France Payer Services in the Healthcare Industry Revenue (Million) Forecast, by Application 2019 & 2032
- Table 14: Italy Payer Services in the Healthcare Industry Revenue (Million) Forecast, by Application 2019 & 2032
- Table 15: Spain Payer Services in the Healthcare Industry Revenue (Million) Forecast, by Application 2019 & 2032
- Table 16: Rest of Europe Payer Services in the Healthcare Industry Revenue (Million) Forecast, by Application 2019 & 2032
- Table 17: Global Payer Services in the Healthcare Industry Revenue Million Forecast, by Country 2019 & 2032
- Table 18: China Payer Services in the Healthcare Industry Revenue (Million) Forecast, by Application 2019 & 2032
- Table 19: Japan Payer Services in the Healthcare Industry Revenue (Million) Forecast, by Application 2019 & 2032
- Table 20: India Payer Services in the Healthcare Industry Revenue (Million) Forecast, by Application 2019 & 2032
- Table 21: Australia Payer Services in the Healthcare Industry Revenue (Million) Forecast, by Application 2019 & 2032
- Table 22: South Korea Payer Services in the Healthcare Industry Revenue (Million) Forecast, by Application 2019 & 2032
- Table 23: Rest of Asia Pacific Payer Services in the Healthcare Industry Revenue (Million) Forecast, by Application 2019 & 2032
- Table 24: Global Payer Services in the Healthcare Industry Revenue Million Forecast, by Country 2019 & 2032
- Table 25: GCC Payer Services in the Healthcare Industry Revenue (Million) Forecast, by Application 2019 & 2032
- Table 26: South Africa Payer Services in the Healthcare Industry Revenue (Million) Forecast, by Application 2019 & 2032
- Table 27: Rest of Middle East and Africa Payer Services in the Healthcare Industry Revenue (Million) Forecast, by Application 2019 & 2032
- Table 28: Global Payer Services in the Healthcare Industry Revenue Million Forecast, by Country 2019 & 2032
- Table 29: Brazil Payer Services in the Healthcare Industry Revenue (Million) Forecast, by Application 2019 & 2032
- Table 30: Argentina Payer Services in the Healthcare Industry Revenue (Million) Forecast, by Application 2019 & 2032
- Table 31: Rest of South America Payer Services in the Healthcare Industry Revenue (Million) Forecast, by Application 2019 & 2032
- Table 32: Global Payer Services in the Healthcare Industry Revenue Million Forecast, by Service Type 2019 & 2032
- Table 33: Global Payer Services in the Healthcare Industry Revenue Million Forecast, by Application 2019 & 2032
- Table 34: Global Payer Services in the Healthcare Industry Revenue Million Forecast, by End User 2019 & 2032
- Table 35: Global Payer Services in the Healthcare Industry Revenue Million Forecast, by Country 2019 & 2032
- Table 36: United States Payer Services in the Healthcare Industry Revenue (Million) Forecast, by Application 2019 & 2032
- Table 37: Canada Payer Services in the Healthcare Industry Revenue (Million) Forecast, by Application 2019 & 2032
- Table 38: Mexico Payer Services in the Healthcare Industry Revenue (Million) Forecast, by Application 2019 & 2032
- Table 39: Global Payer Services in the Healthcare Industry Revenue Million Forecast, by Service Type 2019 & 2032
- Table 40: Global Payer Services in the Healthcare Industry Revenue Million Forecast, by Application 2019 & 2032
- Table 41: Global Payer Services in the Healthcare Industry Revenue Million Forecast, by End User 2019 & 2032
- Table 42: Global Payer Services in the Healthcare Industry Revenue Million Forecast, by Country 2019 & 2032
- Table 43: Germany Payer Services in the Healthcare Industry Revenue (Million) Forecast, by Application 2019 & 2032
- Table 44: United Kingdom Payer Services in the Healthcare Industry Revenue (Million) Forecast, by Application 2019 & 2032
- Table 45: France Payer Services in the Healthcare Industry Revenue (Million) Forecast, by Application 2019 & 2032
- Table 46: Italy Payer Services in the Healthcare Industry Revenue (Million) Forecast, by Application 2019 & 2032
- Table 47: Spain Payer Services in the Healthcare Industry Revenue (Million) Forecast, by Application 2019 & 2032
- Table 48: Rest of Europe Payer Services in the Healthcare Industry Revenue (Million) Forecast, by Application 2019 & 2032
- Table 49: Global Payer Services in the Healthcare Industry Revenue Million Forecast, by Service Type 2019 & 2032
- Table 50: Global Payer Services in the Healthcare Industry Revenue Million Forecast, by Application 2019 & 2032
- Table 51: Global Payer Services in the Healthcare Industry Revenue Million Forecast, by End User 2019 & 2032
- Table 52: Global Payer Services in the Healthcare Industry Revenue Million Forecast, by Country 2019 & 2032
- Table 53: China Payer Services in the Healthcare Industry Revenue (Million) Forecast, by Application 2019 & 2032
- Table 54: Japan Payer Services in the Healthcare Industry Revenue (Million) Forecast, by Application 2019 & 2032
- Table 55: India Payer Services in the Healthcare Industry Revenue (Million) Forecast, by Application 2019 & 2032
- Table 56: Australia Payer Services in the Healthcare Industry Revenue (Million) Forecast, by Application 2019 & 2032
- Table 57: South Korea Payer Services in the Healthcare Industry Revenue (Million) Forecast, by Application 2019 & 2032
- Table 58: Rest of Asia Pacific Payer Services in the Healthcare Industry Revenue (Million) Forecast, by Application 2019 & 2032
- Table 59: Global Payer Services in the Healthcare Industry Revenue Million Forecast, by Service Type 2019 & 2032
- Table 60: Global Payer Services in the Healthcare Industry Revenue Million Forecast, by Application 2019 & 2032
- Table 61: Global Payer Services in the Healthcare Industry Revenue Million Forecast, by End User 2019 & 2032
- Table 62: Global Payer Services in the Healthcare Industry Revenue Million Forecast, by Country 2019 & 2032
- Table 63: GCC Payer Services in the Healthcare Industry Revenue (Million) Forecast, by Application 2019 & 2032
- Table 64: South Africa Payer Services in the Healthcare Industry Revenue (Million) Forecast, by Application 2019 & 2032
- Table 65: Rest of Middle East and Africa Payer Services in the Healthcare Industry Revenue (Million) Forecast, by Application 2019 & 2032
- Table 66: Global Payer Services in the Healthcare Industry Revenue Million Forecast, by Service Type 2019 & 2032
- Table 67: Global Payer Services in the Healthcare Industry Revenue Million Forecast, by Application 2019 & 2032
- Table 68: Global Payer Services in the Healthcare Industry Revenue Million Forecast, by End User 2019 & 2032
- Table 69: Global Payer Services in the Healthcare Industry Revenue Million Forecast, by Country 2019 & 2032
- Table 70: Brazil Payer Services in the Healthcare Industry Revenue (Million) Forecast, by Application 2019 & 2032
- Table 71: Argentina Payer Services in the Healthcare Industry Revenue (Million) Forecast, by Application 2019 & 2032
- Table 72: Rest of South America Payer Services in the Healthcare Industry Revenue (Million) Forecast, by Application 2019 & 2032
Frequently Asked Questions
1. What is the projected Compound Annual Growth Rate (CAGR) of the Payer Services in the Healthcare Industry?
The projected CAGR is approximately 9.43%.
2. Which companies are prominent players in the Payer Services in the Healthcare Industry?
Key companies in the market include Hewlett-Packard, Synnex Corporation (Concentrix Corporation), HMS Holding Corp, Change Healthcare Inc, Wipro Limited, Accenture PLC, Xerox Corporation, HCL Technologies Ltd, Dell Inc, Cognizant Technology Solutions, McKESSON Corporation, Genpact Limited.
3. What are the main segments of the Payer Services in the Healthcare Industry?
The market segments include Service Type, Application, End User.
4. Can you provide details about the market size?
The market size is estimated to be USD 75.53 Million as of 2022.
5. What are some drivers contributing to market growth?
Rise In Adoption of Health Insurance Policies; Rise In Healthcare Frauds; Growing Burden of Chronic Diseases.
6. What are the notable trends driving market growth?
Claims Management Services Segment Is Expected To Hold A Major Share In The Market..
7. Are there any restraints impacting market growth?
High Incidences of Data Breaches and Loss of Confidentiality; Unpredicted Costs Associated With Outsourcing.
8. Can you provide examples of recent developments in the market?
N/A
9. What pricing options are available for accessing the report?
Pricing options include single-user, multi-user, and enterprise licenses priced at USD 4750, USD 5250, and USD 8750 respectively.
10. Is the market size provided in terms of value or volume?
The market size is provided in terms of value, measured in Million.
11. Are there any specific market keywords associated with the report?
Yes, the market keyword associated with the report is "Payer Services in the Healthcare Industry," which aids in identifying and referencing the specific market segment covered.
12. How do I determine which pricing option suits my needs best?
The pricing options vary based on user requirements and access needs. Individual users may opt for single-user licenses, while businesses requiring broader access may choose multi-user or enterprise licenses for cost-effective access to the report.
13. Are there any additional resources or data provided in the Payer Services in the Healthcare Industry report?
While the report offers comprehensive insights, it's advisable to review the specific contents or supplementary materials provided to ascertain if additional resources or data are available.
14. How can I stay updated on further developments or reports in the Payer Services in the Healthcare Industry?
To stay informed about further developments, trends, and reports in the Payer Services in the Healthcare Industry, consider subscribing to industry newsletters, following relevant companies and organizations, or regularly checking reputable industry news sources and publications.
Methodology
Step 1 - Identification of Relevant Samples Size from Population Database


Step 2 - Approaches for Defining Global Market Size (Value, Volume* & Price*)

Note*: In applicable scenarios
Step 3 - Data Sources
Primary Research
- Web Analytics
- Survey Reports
- Research Institute
- Latest Research Reports
- Opinion Leaders
Secondary Research
- Annual Reports
- White Paper
- Latest Press Release
- Industry Association
- Paid Database
- Investor Presentations

Step 4 - Data Triangulation
Involves using different sources of information in order to increase the validity of a study
These sources are likely to be stakeholders in a program - participants, other researchers, program staff, other community members, and so on.
Then we put all data in single framework & apply various statistical tools to find out the dynamic on the market.
During the analysis stage, feedback from the stakeholder groups would be compared to determine areas of agreement as well as areas of divergence
