

Key Insights
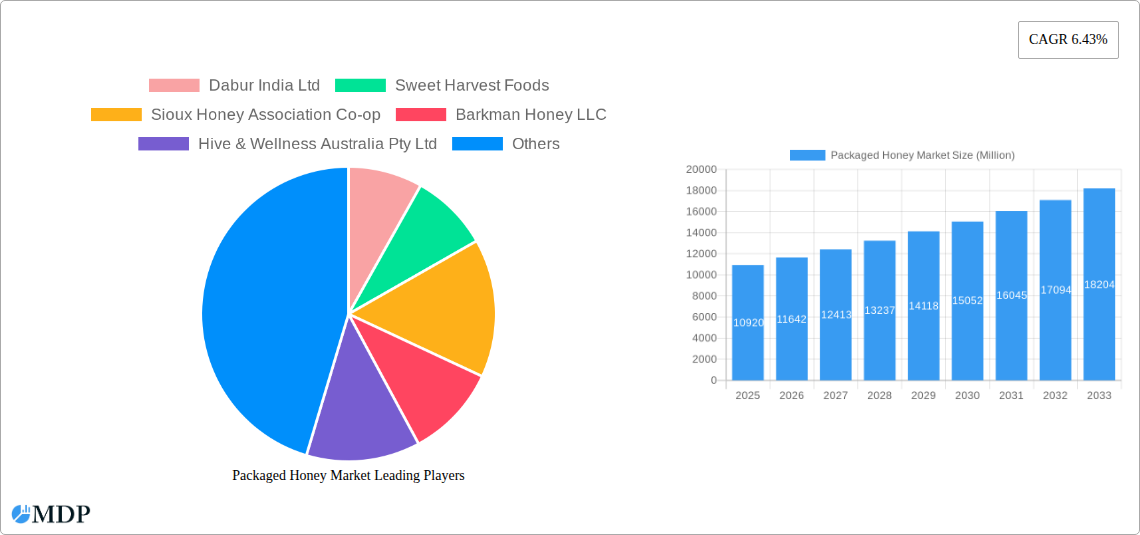
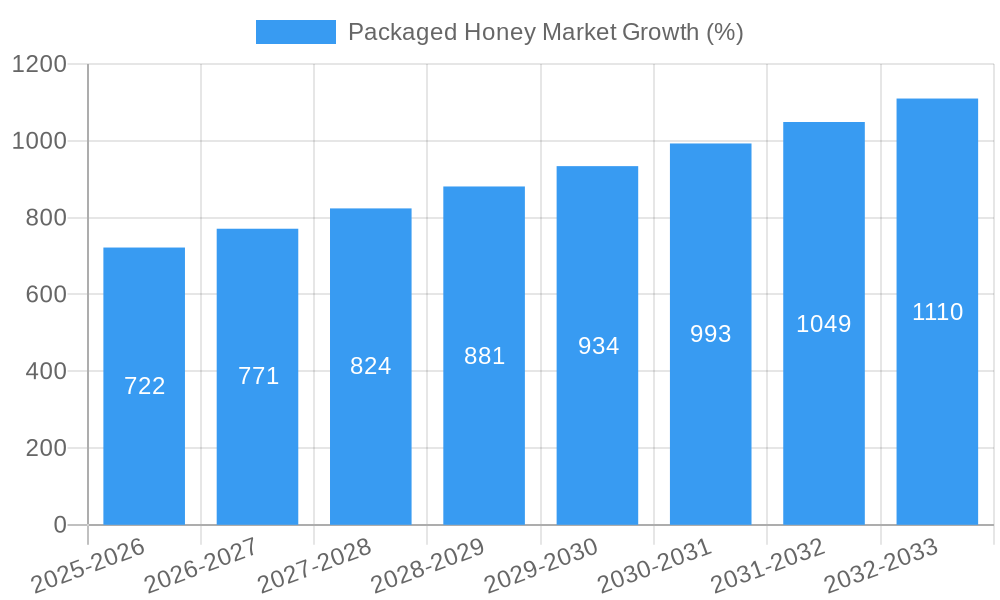
The global packaged honey market, valued at $10.92 billion in 2025, is projected to experience robust growth, exhibiting a compound annual growth rate (CAGR) of 6.43% from 2025 to 2033. This expansion is driven by several key factors. Rising consumer awareness of honey's health benefits, including its antioxidant and antimicrobial properties, fuels demand. The increasing preference for natural and organic sweeteners, coupled with growing concerns about artificial sweeteners, further contributes to market growth. Moreover, the expanding food and beverage industry, incorporating honey as an ingredient in various products, significantly boosts market volume. The rising popularity of honey in functional foods and beverages, along with its increasing use in cosmetics and personal care products, also contributes to market expansion. Key players like Dabur India Ltd, Patanjali Ayurved Limited, and McCormick & Company Inc. are leveraging these trends through product diversification and strategic expansions. However, factors such as honey adulteration and fluctuating honey prices due to variations in climatic conditions and bee populations could potentially restrain market growth.
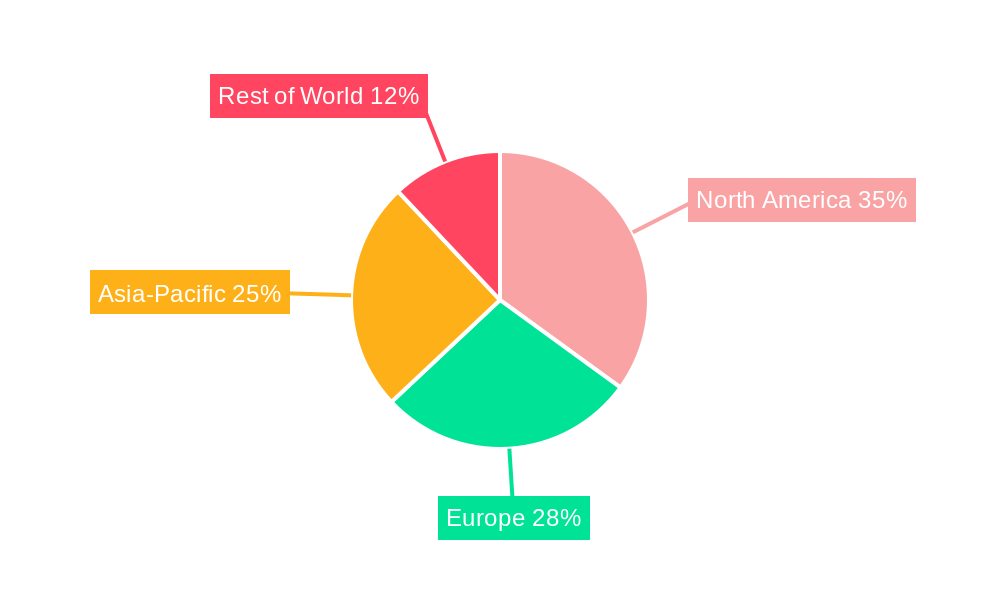
The forecast period of 2025-2033 anticipates continued market penetration across various regions. Geographic expansion into developing economies with large populations and increasing disposable incomes holds significant growth potential. While precise regional breakdowns are unavailable, it's reasonable to assume a higher market share for regions with established honey production and strong consumer preference for natural sweeteners, such as North America and Europe. Market segmentation analysis would likely reveal diverse product offerings based on honey type (e.g., wildflower, clover), packaging formats, and targeted consumer segments (e.g., health-conscious, value-conscious). Continuous innovation in product offerings, focusing on unique flavor profiles and functional benefits, is crucial for maintaining market competitiveness and attracting consumer attention within the increasingly dynamic packaged honey landscape.
Deep Dive into the Packaged Honey Market: A Comprehensive Report (2019-2033)
This comprehensive report provides an in-depth analysis of the Packaged Honey Market, offering invaluable insights for industry stakeholders, investors, and strategic decision-makers. With a focus on market dynamics, trends, and future opportunities, this report covers the period from 2019 to 2033, with a base year of 2025 and a forecast period of 2025-2033. The study meticulously examines key players such as Dabur India Ltd, Sweet Harvest Foods, Sioux Honey Association Co-op, Barkman Honey LLC, Hive & Wellness Australia Pty Ltd, Patanjali Ayurved Limited, Bright Food Group Co Ltd, McCormick & Company Inc, The J M Smucker Company, and Apis Group, among others. Discover crucial data points, actionable strategies, and projections to navigate this dynamic market effectively.
Packaged Honey Market Market Dynamics & Concentration
The Packaged Honey Market exhibits a moderately concentrated structure, with a few major players holding significant market share. However, the market is also characterized by a substantial number of smaller regional players and niche brands. Innovation in packaging, product formulations (e.g., infused honeys, specialized blends), and sustainable sourcing practices are key drivers of market growth. Stringent regulatory frameworks concerning food safety and labeling standards influence market operations, particularly in developed regions. The rise of vegan and plant-based alternatives, such as MeliBio's vegan honey, presents both a challenge and an opportunity for traditional honey producers. Consumer trends increasingly prioritize natural, organic, and ethically sourced products, pushing for transparency and sustainability throughout the supply chain. The market has witnessed a moderate level of M&A activity in recent years, with xx major deals concluded during the historical period (2019-2024). This activity is expected to continue, albeit at a similar pace, in the forecast period. Market share data for the top five players accounts for approximately xx% of the total market, indicating a moderate level of market concentration.
- Market Concentration: Moderately concentrated, with xx% market share held by top 5 players.
- Innovation Drivers: Sustainable sourcing, unique flavor infusions, functional honey products.
- Regulatory Framework: Stringent food safety and labeling regulations impacting market access.
- Product Substitutes: Growth of vegan honey alternatives impacting market dynamics.
- End-user Trends: Increasing demand for natural, organic, and ethically sourced honey.
- M&A Activity: xx major mergers and acquisitions during 2019-2024.
Packaged Honey Market Industry Trends & Analysis
The Packaged Honey Market is experiencing steady growth, with a projected CAGR of xx% during the forecast period (2025-2033). This growth is fueled by rising consumer awareness of honey's health benefits, increasing disposable incomes in developing economies, and expanding retail channels for honey products. Technological advancements in honey processing and packaging are enhancing product quality and shelf life. Consumer preferences are shifting towards specialty honeys, such as organic, raw, and varietal honeys, creating niche market segments. The competitive landscape is characterized by both large multinational corporations and smaller, specialized honey producers. Market penetration of organic and specialty honey products is gradually increasing, currently standing at approximately xx% and projected to reach xx% by 2033. The rising popularity of e-commerce platforms also significantly impacts market dynamics, particularly concerning direct-to-consumer sales.
Leading Markets & Segments in Packaged Honey Market
The North American region currently holds the largest market share in the packaged honey market, driven by high honey consumption, strong demand for organic and specialty honey, and well-established distribution networks. This dominance is further supported by robust agricultural infrastructure and favorable government policies supporting the beekeeping industry. However, the Asia-Pacific region is witnessing the fastest growth rate, propelled by rising disposable incomes, increasing urbanization, and a growing preference for natural sweeteners.
- Key Drivers in North America: High honey consumption, strong demand for organic and specialty honey, well-established distribution networks.
- Key Drivers in Asia-Pacific: Rising disposable incomes, increasing urbanization, growing preference for natural sweeteners.
- Dominance Analysis: North America holds the largest market share, while Asia-Pacific exhibits the fastest growth.
Packaged Honey Market Product Developments
Recent product innovations focus on enhancing convenience, expanding flavor profiles, and highlighting health benefits. This includes the introduction of single-serve honey packs, flavored honey varieties, and honey-based functional foods and beverages. Companies are also investing in sustainable and eco-friendly packaging solutions to meet growing consumer demand for environmentally conscious products. These advancements offer competitive advantages by catering to diverse consumer needs and preferences. The launch of vegan honey alternatives represents a significant technological breakthrough that expands the market's potential reach.
Key Drivers of Packaged Honey Market Growth
Several factors fuel the growth of the packaged honey market. Rising consumer awareness of honey's health benefits, including its antioxidant properties and potential to improve immunity, is a major driver. The increasing demand for natural and organic food products complements this trend. Furthermore, economic growth in developing countries boosts disposable incomes, making honey a more accessible product. Favorable government policies and initiatives promoting beekeeping and sustainable honey production provide additional support to the market.
Challenges in the Packaged Honey Market
The Packaged Honey Market faces several challenges. Fluctuating honey yields due to unpredictable weather patterns and bee colony health issues create supply chain vulnerabilities, potentially impacting pricing and availability. Intense competition among numerous producers, including both large multinational corporations and smaller local businesses, exerts downward pressure on profit margins. Stringent food safety and labeling regulations, while important for consumer protection, can add to operational costs for manufacturers. These factors, cumulatively, impact market stability and overall profitability. The rising cost of raw materials (sugar, packaging) further contributes to production cost increase.
Emerging Opportunities in Packaged Honey Market
The Packaged Honey Market presents several opportunities for long-term growth. Technological innovations in honey processing and extraction can improve efficiency and product quality. Strategic partnerships between honey producers and food and beverage companies can expand the applications of honey in various food and beverage products. Moreover, market expansion into new geographic regions with rising demand for honey presents substantial growth potential. The development of novel honey-based products with functional health benefits also provides promising avenues for market penetration and differentiation.
Leading Players in the Packaged Honey Market Sector
- Dabur India Ltd
- Sweet Harvest Foods
- Sioux Honey Association Co-op
- Barkman Honey LLC
- Hive & Wellness Australia Pty Ltd
- Patanjali Ayurved Limited
- Bright Food Group Co Ltd
- McCormick & Company Inc
- The J M Smucker Company
- Apis Group
Key Milestones in Packaged Honey Market Industry
- January 2024: Dabur India Ltd invested INR 135 crore in expanding its manufacturing facility, boosting production capacity for its honey products.
- January 2024: APIS Honey launched Apis Organic Honey, sourced from Kashmir, expanding its product portfolio.
- December 2023: Better Foodie launched MeliBio's vegan honey in approximately 200 UK retailers, introducing a significant market disruption.
Strategic Outlook for Packaged Honey Market
The Packaged Honey Market is poised for continued growth, driven by sustained demand for natural sweeteners and innovative product development. Strategic focus on sustainable sourcing, organic certification, and product diversification, combined with targeted marketing campaigns emphasizing the health benefits of honey, will prove crucial for success. Expanding into emerging markets and leveraging e-commerce platforms can further unlock significant growth potential. Companies proactively managing supply chain challenges and adapting to changing consumer preferences will be well-positioned to thrive in this dynamic market.
Packaged Honey Market Segmentation
-
1. Product Category
- 1.1. Conventional
- 1.2. Organic
-
2. Packaging Type
- 2.1. Pet Bottles
- 2.2. Glass Jars
- 2.3. Other Packaging Types
Packaged Honey Market Segmentation By Geography
-
1. North America
- 1.1. United States
- 1.2. Canada
- 1.3. Mexico
- 1.4. Rest of North America
-
2. Europe
- 2.1. Germany
- 2.2. France
- 2.3. Russia
- 2.4. Spain
- 2.5. United Kingdom
- 2.6. Italy
- 2.7. Rest of Europe
-
3. Asia Pacific
- 3.1. India
- 3.2. China
- 3.3. Japan
- 3.4. Australia
- 3.5. Rest of Asia pacific
-
4. South America
- 4.1. Brazil
- 4.2. Argentina
- 4.3. Rest of South America
-
5. Middle East and Africa
- 5.1. United Arab Emirates
- 5.2. South Africa
- 5.3. Rest of Middle East
Packaged Honey Market REPORT HIGHLIGHTS
| Aspects | Details |
|---|---|
| Study Period | 2019-2033 |
| Base Year | 2024 |
| Estimated Year | 2025 |
| Forecast Period | 2025-2033 |
| Historical Period | 2019-2024 |
| Growth Rate | CAGR of 6.43% from 2019-2033 |
| Segmentation |
|
Table of Contents
- 1. Introduction
- 1.1. Research Scope
- 1.2. Market Segmentation
- 1.3. Research Methodology
- 1.4. Definitions and Assumptions
- 2. Executive Summary
- 2.1. Introduction
- 3. Market Dynamics
- 3.1. Introduction
- 3.2. Market Drivers
- 3.2.1. Increasing Demand for Natural Sweeteners; Government Initiatives Boost Honey Production and Beekeeping
- 3.3. Market Restrains
- 3.3.1. Increasing Demand for Natural Sweeteners; Government Initiatives Boost Honey Production and Beekeeping
- 3.4. Market Trends
- 3.4.1. Conventional Honey Is Consumed Globally
- 4. Market Factor Analysis
- 4.1. Porters Five Forces
- 4.2. Supply/Value Chain
- 4.3. PESTEL analysis
- 4.4. Market Entropy
- 4.5. Patent/Trademark Analysis
- 5. Global Packaged Honey Market Analysis, Insights and Forecast, 2019-2031
- 5.1. Market Analysis, Insights and Forecast - by Product Category
- 5.1.1. Conventional
- 5.1.2. Organic
- 5.2. Market Analysis, Insights and Forecast - by Packaging Type
- 5.2.1. Pet Bottles
- 5.2.2. Glass Jars
- 5.2.3. Other Packaging Types
- 5.3. Market Analysis, Insights and Forecast - by Region
- 5.3.1. North America
- 5.3.2. Europe
- 5.3.3. Asia Pacific
- 5.3.4. South America
- 5.3.5. Middle East and Africa
- 5.1. Market Analysis, Insights and Forecast - by Product Category
- 6. North America Packaged Honey Market Analysis, Insights and Forecast, 2019-2031
- 6.1. Market Analysis, Insights and Forecast - by Product Category
- 6.1.1. Conventional
- 6.1.2. Organic
- 6.2. Market Analysis, Insights and Forecast - by Packaging Type
- 6.2.1. Pet Bottles
- 6.2.2. Glass Jars
- 6.2.3. Other Packaging Types
- 6.1. Market Analysis, Insights and Forecast - by Product Category
- 7. Europe Packaged Honey Market Analysis, Insights and Forecast, 2019-2031
- 7.1. Market Analysis, Insights and Forecast - by Product Category
- 7.1.1. Conventional
- 7.1.2. Organic
- 7.2. Market Analysis, Insights and Forecast - by Packaging Type
- 7.2.1. Pet Bottles
- 7.2.2. Glass Jars
- 7.2.3. Other Packaging Types
- 7.1. Market Analysis, Insights and Forecast - by Product Category
- 8. Asia Pacific Packaged Honey Market Analysis, Insights and Forecast, 2019-2031
- 8.1. Market Analysis, Insights and Forecast - by Product Category
- 8.1.1. Conventional
- 8.1.2. Organic
- 8.2. Market Analysis, Insights and Forecast - by Packaging Type
- 8.2.1. Pet Bottles
- 8.2.2. Glass Jars
- 8.2.3. Other Packaging Types
- 8.1. Market Analysis, Insights and Forecast - by Product Category
- 9. South America Packaged Honey Market Analysis, Insights and Forecast, 2019-2031
- 9.1. Market Analysis, Insights and Forecast - by Product Category
- 9.1.1. Conventional
- 9.1.2. Organic
- 9.2. Market Analysis, Insights and Forecast - by Packaging Type
- 9.2.1. Pet Bottles
- 9.2.2. Glass Jars
- 9.2.3. Other Packaging Types
- 9.1. Market Analysis, Insights and Forecast - by Product Category
- 10. Middle East and Africa Packaged Honey Market Analysis, Insights and Forecast, 2019-2031
- 10.1. Market Analysis, Insights and Forecast - by Product Category
- 10.1.1. Conventional
- 10.1.2. Organic
- 10.2. Market Analysis, Insights and Forecast - by Packaging Type
- 10.2.1. Pet Bottles
- 10.2.2. Glass Jars
- 10.2.3. Other Packaging Types
- 10.1. Market Analysis, Insights and Forecast - by Product Category
- 11. Competitive Analysis
- 11.1. Global Market Share Analysis 2024
- 11.2. Company Profiles
- 11.2.1 Dabur India Ltd
- 11.2.1.1. Overview
- 11.2.1.2. Products
- 11.2.1.3. SWOT Analysis
- 11.2.1.4. Recent Developments
- 11.2.1.5. Financials (Based on Availability)
- 11.2.2 Sweet Harvest Foods
- 11.2.2.1. Overview
- 11.2.2.2. Products
- 11.2.2.3. SWOT Analysis
- 11.2.2.4. Recent Developments
- 11.2.2.5. Financials (Based on Availability)
- 11.2.3 Sioux Honey Association Co-op
- 11.2.3.1. Overview
- 11.2.3.2. Products
- 11.2.3.3. SWOT Analysis
- 11.2.3.4. Recent Developments
- 11.2.3.5. Financials (Based on Availability)
- 11.2.4 Barkman Honey LLC
- 11.2.4.1. Overview
- 11.2.4.2. Products
- 11.2.4.3. SWOT Analysis
- 11.2.4.4. Recent Developments
- 11.2.4.5. Financials (Based on Availability)
- 11.2.5 Hive & Wellness Australia Pty Ltd
- 11.2.5.1. Overview
- 11.2.5.2. Products
- 11.2.5.3. SWOT Analysis
- 11.2.5.4. Recent Developments
- 11.2.5.5. Financials (Based on Availability)
- 11.2.6 Patanjali Ayurved Limited
- 11.2.6.1. Overview
- 11.2.6.2. Products
- 11.2.6.3. SWOT Analysis
- 11.2.6.4. Recent Developments
- 11.2.6.5. Financials (Based on Availability)
- 11.2.7 Bright Food Group co Ltd
- 11.2.7.1. Overview
- 11.2.7.2. Products
- 11.2.7.3. SWOT Analysis
- 11.2.7.4. Recent Developments
- 11.2.7.5. Financials (Based on Availability)
- 11.2.8 Mccormick & Company Inc
- 11.2.8.1. Overview
- 11.2.8.2. Products
- 11.2.8.3. SWOT Analysis
- 11.2.8.4. Recent Developments
- 11.2.8.5. Financials (Based on Availability)
- 11.2.9 The J M Smucker Company
- 11.2.9.1. Overview
- 11.2.9.2. Products
- 11.2.9.3. SWOT Analysis
- 11.2.9.4. Recent Developments
- 11.2.9.5. Financials (Based on Availability)
- 11.2.10 Apis Group*List Not Exhaustive
- 11.2.10.1. Overview
- 11.2.10.2. Products
- 11.2.10.3. SWOT Analysis
- 11.2.10.4. Recent Developments
- 11.2.10.5. Financials (Based on Availability)
- 11.2.1 Dabur India Ltd
List of Figures
- Figure 1: Global Packaged Honey Market Revenue Breakdown (Million, %) by Region 2024 & 2032
- Figure 2: Global Packaged Honey Market Volume Breakdown (Billion, %) by Region 2024 & 2032
- Figure 3: North America Packaged Honey Market Revenue (Million), by Product Category 2024 & 2032
- Figure 4: North America Packaged Honey Market Volume (Billion), by Product Category 2024 & 2032
- Figure 5: North America Packaged Honey Market Revenue Share (%), by Product Category 2024 & 2032
- Figure 6: North America Packaged Honey Market Volume Share (%), by Product Category 2024 & 2032
- Figure 7: North America Packaged Honey Market Revenue (Million), by Packaging Type 2024 & 2032
- Figure 8: North America Packaged Honey Market Volume (Billion), by Packaging Type 2024 & 2032
- Figure 9: North America Packaged Honey Market Revenue Share (%), by Packaging Type 2024 & 2032
- Figure 10: North America Packaged Honey Market Volume Share (%), by Packaging Type 2024 & 2032
- Figure 11: North America Packaged Honey Market Revenue (Million), by Country 2024 & 2032
- Figure 12: North America Packaged Honey Market Volume (Billion), by Country 2024 & 2032
- Figure 13: North America Packaged Honey Market Revenue Share (%), by Country 2024 & 2032
- Figure 14: North America Packaged Honey Market Volume Share (%), by Country 2024 & 2032
- Figure 15: Europe Packaged Honey Market Revenue (Million), by Product Category 2024 & 2032
- Figure 16: Europe Packaged Honey Market Volume (Billion), by Product Category 2024 & 2032
- Figure 17: Europe Packaged Honey Market Revenue Share (%), by Product Category 2024 & 2032
- Figure 18: Europe Packaged Honey Market Volume Share (%), by Product Category 2024 & 2032
- Figure 19: Europe Packaged Honey Market Revenue (Million), by Packaging Type 2024 & 2032
- Figure 20: Europe Packaged Honey Market Volume (Billion), by Packaging Type 2024 & 2032
- Figure 21: Europe Packaged Honey Market Revenue Share (%), by Packaging Type 2024 & 2032
- Figure 22: Europe Packaged Honey Market Volume Share (%), by Packaging Type 2024 & 2032
- Figure 23: Europe Packaged Honey Market Revenue (Million), by Country 2024 & 2032
- Figure 24: Europe Packaged Honey Market Volume (Billion), by Country 2024 & 2032
- Figure 25: Europe Packaged Honey Market Revenue Share (%), by Country 2024 & 2032
- Figure 26: Europe Packaged Honey Market Volume Share (%), by Country 2024 & 2032
- Figure 27: Asia Pacific Packaged Honey Market Revenue (Million), by Product Category 2024 & 2032
- Figure 28: Asia Pacific Packaged Honey Market Volume (Billion), by Product Category 2024 & 2032
- Figure 29: Asia Pacific Packaged Honey Market Revenue Share (%), by Product Category 2024 & 2032
- Figure 30: Asia Pacific Packaged Honey Market Volume Share (%), by Product Category 2024 & 2032
- Figure 31: Asia Pacific Packaged Honey Market Revenue (Million), by Packaging Type 2024 & 2032
- Figure 32: Asia Pacific Packaged Honey Market Volume (Billion), by Packaging Type 2024 & 2032
- Figure 33: Asia Pacific Packaged Honey Market Revenue Share (%), by Packaging Type 2024 & 2032
- Figure 34: Asia Pacific Packaged Honey Market Volume Share (%), by Packaging Type 2024 & 2032
- Figure 35: Asia Pacific Packaged Honey Market Revenue (Million), by Country 2024 & 2032
- Figure 36: Asia Pacific Packaged Honey Market Volume (Billion), by Country 2024 & 2032
- Figure 37: Asia Pacific Packaged Honey Market Revenue Share (%), by Country 2024 & 2032
- Figure 38: Asia Pacific Packaged Honey Market Volume Share (%), by Country 2024 & 2032
- Figure 39: South America Packaged Honey Market Revenue (Million), by Product Category 2024 & 2032
- Figure 40: South America Packaged Honey Market Volume (Billion), by Product Category 2024 & 2032
- Figure 41: South America Packaged Honey Market Revenue Share (%), by Product Category 2024 & 2032
- Figure 42: South America Packaged Honey Market Volume Share (%), by Product Category 2024 & 2032
- Figure 43: South America Packaged Honey Market Revenue (Million), by Packaging Type 2024 & 2032
- Figure 44: South America Packaged Honey Market Volume (Billion), by Packaging Type 2024 & 2032
- Figure 45: South America Packaged Honey Market Revenue Share (%), by Packaging Type 2024 & 2032
- Figure 46: South America Packaged Honey Market Volume Share (%), by Packaging Type 2024 & 2032
- Figure 47: South America Packaged Honey Market Revenue (Million), by Country 2024 & 2032
- Figure 48: South America Packaged Honey Market Volume (Billion), by Country 2024 & 2032
- Figure 49: South America Packaged Honey Market Revenue Share (%), by Country 2024 & 2032
- Figure 50: South America Packaged Honey Market Volume Share (%), by Country 2024 & 2032
- Figure 51: Middle East and Africa Packaged Honey Market Revenue (Million), by Product Category 2024 & 2032
- Figure 52: Middle East and Africa Packaged Honey Market Volume (Billion), by Product Category 2024 & 2032
- Figure 53: Middle East and Africa Packaged Honey Market Revenue Share (%), by Product Category 2024 & 2032
- Figure 54: Middle East and Africa Packaged Honey Market Volume Share (%), by Product Category 2024 & 2032
- Figure 55: Middle East and Africa Packaged Honey Market Revenue (Million), by Packaging Type 2024 & 2032
- Figure 56: Middle East and Africa Packaged Honey Market Volume (Billion), by Packaging Type 2024 & 2032
- Figure 57: Middle East and Africa Packaged Honey Market Revenue Share (%), by Packaging Type 2024 & 2032
- Figure 58: Middle East and Africa Packaged Honey Market Volume Share (%), by Packaging Type 2024 & 2032
- Figure 59: Middle East and Africa Packaged Honey Market Revenue (Million), by Country 2024 & 2032
- Figure 60: Middle East and Africa Packaged Honey Market Volume (Billion), by Country 2024 & 2032
- Figure 61: Middle East and Africa Packaged Honey Market Revenue Share (%), by Country 2024 & 2032
- Figure 62: Middle East and Africa Packaged Honey Market Volume Share (%), by Country 2024 & 2032
List of Tables
- Table 1: Global Packaged Honey Market Revenue Million Forecast, by Region 2019 & 2032
- Table 2: Global Packaged Honey Market Volume Billion Forecast, by Region 2019 & 2032
- Table 3: Global Packaged Honey Market Revenue Million Forecast, by Product Category 2019 & 2032
- Table 4: Global Packaged Honey Market Volume Billion Forecast, by Product Category 2019 & 2032
- Table 5: Global Packaged Honey Market Revenue Million Forecast, by Packaging Type 2019 & 2032
- Table 6: Global Packaged Honey Market Volume Billion Forecast, by Packaging Type 2019 & 2032
- Table 7: Global Packaged Honey Market Revenue Million Forecast, by Region 2019 & 2032
- Table 8: Global Packaged Honey Market Volume Billion Forecast, by Region 2019 & 2032
- Table 9: Global Packaged Honey Market Revenue Million Forecast, by Product Category 2019 & 2032
- Table 10: Global Packaged Honey Market Volume Billion Forecast, by Product Category 2019 & 2032
- Table 11: Global Packaged Honey Market Revenue Million Forecast, by Packaging Type 2019 & 2032
- Table 12: Global Packaged Honey Market Volume Billion Forecast, by Packaging Type 2019 & 2032
- Table 13: Global Packaged Honey Market Revenue Million Forecast, by Country 2019 & 2032
- Table 14: Global Packaged Honey Market Volume Billion Forecast, by Country 2019 & 2032
- Table 15: United States Packaged Honey Market Revenue (Million) Forecast, by Application 2019 & 2032
- Table 16: United States Packaged Honey Market Volume (Billion) Forecast, by Application 2019 & 2032
- Table 17: Canada Packaged Honey Market Revenue (Million) Forecast, by Application 2019 & 2032
- Table 18: Canada Packaged Honey Market Volume (Billion) Forecast, by Application 2019 & 2032
- Table 19: Mexico Packaged Honey Market Revenue (Million) Forecast, by Application 2019 & 2032
- Table 20: Mexico Packaged Honey Market Volume (Billion) Forecast, by Application 2019 & 2032
- Table 21: Rest of North America Packaged Honey Market Revenue (Million) Forecast, by Application 2019 & 2032
- Table 22: Rest of North America Packaged Honey Market Volume (Billion) Forecast, by Application 2019 & 2032
- Table 23: Global Packaged Honey Market Revenue Million Forecast, by Product Category 2019 & 2032
- Table 24: Global Packaged Honey Market Volume Billion Forecast, by Product Category 2019 & 2032
- Table 25: Global Packaged Honey Market Revenue Million Forecast, by Packaging Type 2019 & 2032
- Table 26: Global Packaged Honey Market Volume Billion Forecast, by Packaging Type 2019 & 2032
- Table 27: Global Packaged Honey Market Revenue Million Forecast, by Country 2019 & 2032
- Table 28: Global Packaged Honey Market Volume Billion Forecast, by Country 2019 & 2032
- Table 29: Germany Packaged Honey Market Revenue (Million) Forecast, by Application 2019 & 2032
- Table 30: Germany Packaged Honey Market Volume (Billion) Forecast, by Application 2019 & 2032
- Table 31: France Packaged Honey Market Revenue (Million) Forecast, by Application 2019 & 2032
- Table 32: France Packaged Honey Market Volume (Billion) Forecast, by Application 2019 & 2032
- Table 33: Russia Packaged Honey Market Revenue (Million) Forecast, by Application 2019 & 2032
- Table 34: Russia Packaged Honey Market Volume (Billion) Forecast, by Application 2019 & 2032
- Table 35: Spain Packaged Honey Market Revenue (Million) Forecast, by Application 2019 & 2032
- Table 36: Spain Packaged Honey Market Volume (Billion) Forecast, by Application 2019 & 2032
- Table 37: United Kingdom Packaged Honey Market Revenue (Million) Forecast, by Application 2019 & 2032
- Table 38: United Kingdom Packaged Honey Market Volume (Billion) Forecast, by Application 2019 & 2032
- Table 39: Italy Packaged Honey Market Revenue (Million) Forecast, by Application 2019 & 2032
- Table 40: Italy Packaged Honey Market Volume (Billion) Forecast, by Application 2019 & 2032
- Table 41: Rest of Europe Packaged Honey Market Revenue (Million) Forecast, by Application 2019 & 2032
- Table 42: Rest of Europe Packaged Honey Market Volume (Billion) Forecast, by Application 2019 & 2032
- Table 43: Global Packaged Honey Market Revenue Million Forecast, by Product Category 2019 & 2032
- Table 44: Global Packaged Honey Market Volume Billion Forecast, by Product Category 2019 & 2032
- Table 45: Global Packaged Honey Market Revenue Million Forecast, by Packaging Type 2019 & 2032
- Table 46: Global Packaged Honey Market Volume Billion Forecast, by Packaging Type 2019 & 2032
- Table 47: Global Packaged Honey Market Revenue Million Forecast, by Country 2019 & 2032
- Table 48: Global Packaged Honey Market Volume Billion Forecast, by Country 2019 & 2032
- Table 49: India Packaged Honey Market Revenue (Million) Forecast, by Application 2019 & 2032
- Table 50: India Packaged Honey Market Volume (Billion) Forecast, by Application 2019 & 2032
- Table 51: China Packaged Honey Market Revenue (Million) Forecast, by Application 2019 & 2032
- Table 52: China Packaged Honey Market Volume (Billion) Forecast, by Application 2019 & 2032
- Table 53: Japan Packaged Honey Market Revenue (Million) Forecast, by Application 2019 & 2032
- Table 54: Japan Packaged Honey Market Volume (Billion) Forecast, by Application 2019 & 2032
- Table 55: Australia Packaged Honey Market Revenue (Million) Forecast, by Application 2019 & 2032
- Table 56: Australia Packaged Honey Market Volume (Billion) Forecast, by Application 2019 & 2032
- Table 57: Rest of Asia pacific Packaged Honey Market Revenue (Million) Forecast, by Application 2019 & 2032
- Table 58: Rest of Asia pacific Packaged Honey Market Volume (Billion) Forecast, by Application 2019 & 2032
- Table 59: Global Packaged Honey Market Revenue Million Forecast, by Product Category 2019 & 2032
- Table 60: Global Packaged Honey Market Volume Billion Forecast, by Product Category 2019 & 2032
- Table 61: Global Packaged Honey Market Revenue Million Forecast, by Packaging Type 2019 & 2032
- Table 62: Global Packaged Honey Market Volume Billion Forecast, by Packaging Type 2019 & 2032
- Table 63: Global Packaged Honey Market Revenue Million Forecast, by Country 2019 & 2032
- Table 64: Global Packaged Honey Market Volume Billion Forecast, by Country 2019 & 2032
- Table 65: Brazil Packaged Honey Market Revenue (Million) Forecast, by Application 2019 & 2032
- Table 66: Brazil Packaged Honey Market Volume (Billion) Forecast, by Application 2019 & 2032
- Table 67: Argentina Packaged Honey Market Revenue (Million) Forecast, by Application 2019 & 2032
- Table 68: Argentina Packaged Honey Market Volume (Billion) Forecast, by Application 2019 & 2032
- Table 69: Rest of South America Packaged Honey Market Revenue (Million) Forecast, by Application 2019 & 2032
- Table 70: Rest of South America Packaged Honey Market Volume (Billion) Forecast, by Application 2019 & 2032
- Table 71: Global Packaged Honey Market Revenue Million Forecast, by Product Category 2019 & 2032
- Table 72: Global Packaged Honey Market Volume Billion Forecast, by Product Category 2019 & 2032
- Table 73: Global Packaged Honey Market Revenue Million Forecast, by Packaging Type 2019 & 2032
- Table 74: Global Packaged Honey Market Volume Billion Forecast, by Packaging Type 2019 & 2032
- Table 75: Global Packaged Honey Market Revenue Million Forecast, by Country 2019 & 2032
- Table 76: Global Packaged Honey Market Volume Billion Forecast, by Country 2019 & 2032
- Table 77: United Arab Emirates Packaged Honey Market Revenue (Million) Forecast, by Application 2019 & 2032
- Table 78: United Arab Emirates Packaged Honey Market Volume (Billion) Forecast, by Application 2019 & 2032
- Table 79: South Africa Packaged Honey Market Revenue (Million) Forecast, by Application 2019 & 2032
- Table 80: South Africa Packaged Honey Market Volume (Billion) Forecast, by Application 2019 & 2032
- Table 81: Rest of Middle East Packaged Honey Market Revenue (Million) Forecast, by Application 2019 & 2032
- Table 82: Rest of Middle East Packaged Honey Market Volume (Billion) Forecast, by Application 2019 & 2032
Frequently Asked Questions
1. What is the projected Compound Annual Growth Rate (CAGR) of the Packaged Honey Market?
The projected CAGR is approximately 6.43%.
2. Which companies are prominent players in the Packaged Honey Market?
Key companies in the market include Dabur India Ltd, Sweet Harvest Foods, Sioux Honey Association Co-op, Barkman Honey LLC, Hive & Wellness Australia Pty Ltd, Patanjali Ayurved Limited, Bright Food Group co Ltd, Mccormick & Company Inc, The J M Smucker Company, Apis Group*List Not Exhaustive.
3. What are the main segments of the Packaged Honey Market?
The market segments include Product Category, Packaging Type.
4. Can you provide details about the market size?
The market size is estimated to be USD 10.92 Million as of 2022.
5. What are some drivers contributing to market growth?
Increasing Demand for Natural Sweeteners; Government Initiatives Boost Honey Production and Beekeeping.
6. What are the notable trends driving market growth?
Conventional Honey Is Consumed Globally.
7. Are there any restraints impacting market growth?
Increasing Demand for Natural Sweeteners; Government Initiatives Boost Honey Production and Beekeeping.
8. Can you provide examples of recent developments in the market?
January 2024: Dabur, one of the leading firms in the Ayurvedic and personal care space, recently invested approximately INR 135 crore in expanding its manufacturing facility in South India. This move is geared toward bolstering the production capacity of its flagship products, including Dabur Honey, Dabur Red Paste, and Odonil air fresheners.
9. What pricing options are available for accessing the report?
Pricing options include single-user, multi-user, and enterprise licenses priced at USD 4750, USD 5250, and USD 8750 respectively.
10. Is the market size provided in terms of value or volume?
The market size is provided in terms of value, measured in Million and volume, measured in Billion.
11. Are there any specific market keywords associated with the report?
Yes, the market keyword associated with the report is "Packaged Honey Market," which aids in identifying and referencing the specific market segment covered.
12. How do I determine which pricing option suits my needs best?
The pricing options vary based on user requirements and access needs. Individual users may opt for single-user licenses, while businesses requiring broader access may choose multi-user or enterprise licenses for cost-effective access to the report.
13. Are there any additional resources or data provided in the Packaged Honey Market report?
While the report offers comprehensive insights, it's advisable to review the specific contents or supplementary materials provided to ascertain if additional resources or data are available.
14. How can I stay updated on further developments or reports in the Packaged Honey Market?
To stay informed about further developments, trends, and reports in the Packaged Honey Market, consider subscribing to industry newsletters, following relevant companies and organizations, or regularly checking reputable industry news sources and publications.
Methodology
Step 1 - Identification of Relevant Samples Size from Population Database


Step 2 - Approaches for Defining Global Market Size (Value, Volume* & Price*)

Note*: In applicable scenarios
Step 3 - Data Sources
Primary Research
- Web Analytics
- Survey Reports
- Research Institute
- Latest Research Reports
- Opinion Leaders
Secondary Research
- Annual Reports
- White Paper
- Latest Press Release
- Industry Association
- Paid Database
- Investor Presentations

Step 4 - Data Triangulation
Involves using different sources of information in order to increase the validity of a study
These sources are likely to be stakeholders in a program - participants, other researchers, program staff, other community members, and so on.
Then we put all data in single framework & apply various statistical tools to find out the dynamic on the market.
During the analysis stage, feedback from the stakeholder groups would be compared to determine areas of agreement as well as areas of divergence
