

Key Insights
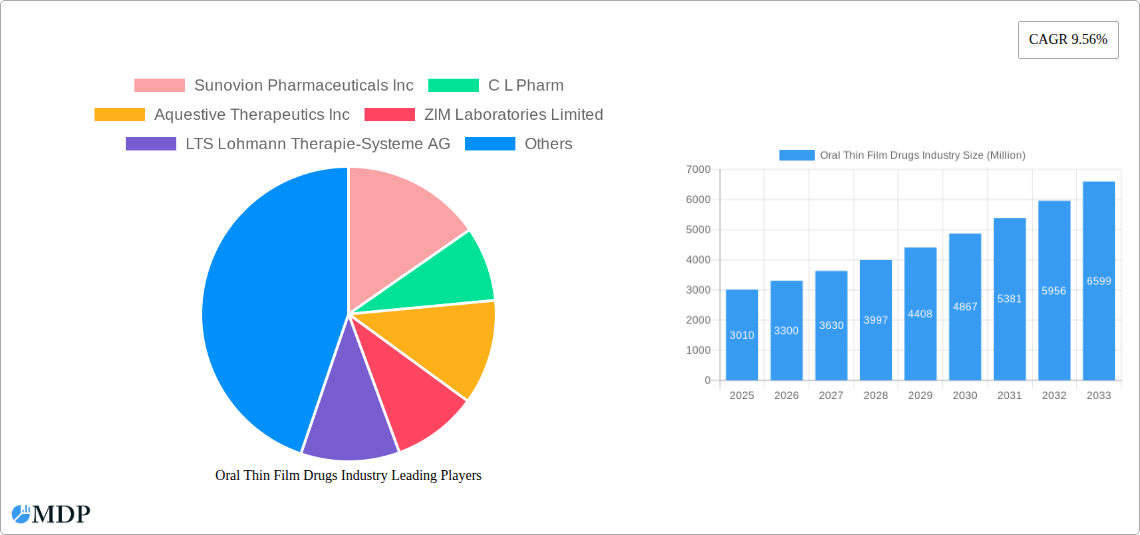
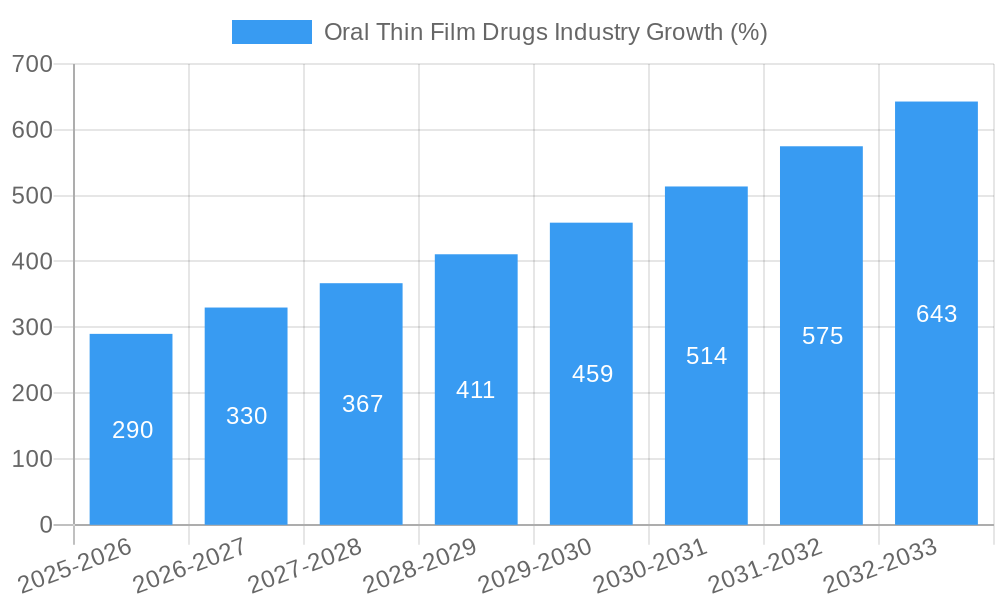
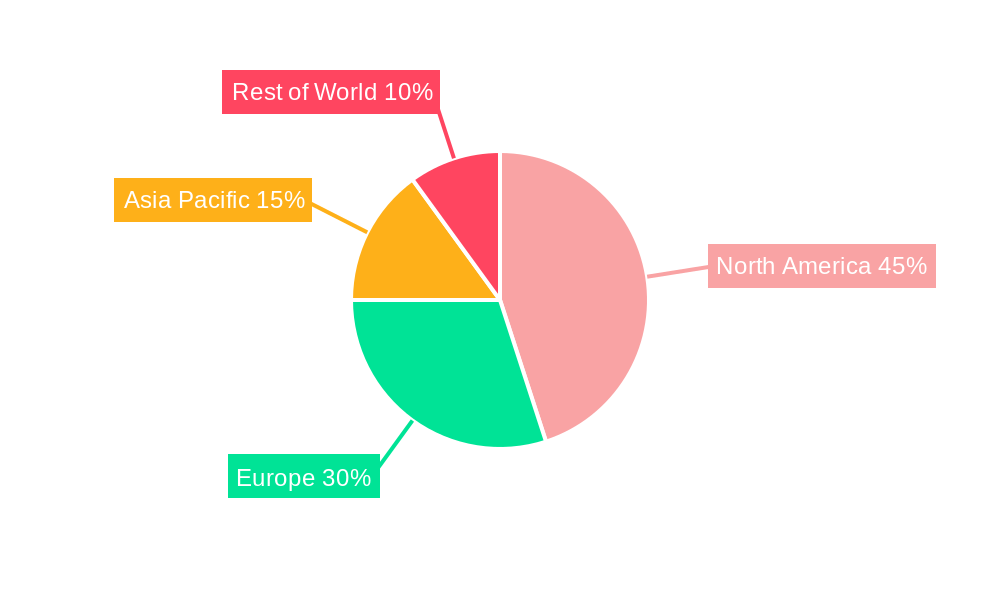
The oral thin film drug market, valued at $3.01 billion in 2025, is projected to experience robust growth, driven by a compound annual growth rate (CAGR) of 9.56% from 2025 to 2033. This expansion is fueled by several key factors. Firstly, the increasing prevalence of chronic diseases requiring convenient and effective drug delivery methods significantly boosts demand. Opioid dependence and nausea/vomiting are major disease indications driving market growth, alongside a rising number of patients seeking alternative drug delivery systems due to ease of administration and improved patient compliance. The sublingual film format enjoys a significant market share, favored for its rapid onset of action and ease of use, particularly for patients with swallowing difficulties. Furthermore, the growing geriatric population, more susceptible to swallowing problems, fuels the demand for such formulations. Technological advancements in thin film manufacturing are leading to improved drug stability and bioavailability, further enhancing market attractiveness. However, challenges remain, including the relatively higher cost of production compared to traditional oral dosage forms and potential regulatory hurdles related to new drug approvals and market entry. Regional growth is expected to be diverse, with North America and Europe maintaining strong market positions due to high healthcare expenditure and robust regulatory frameworks. Asia-Pacific is projected to show significant growth potential, driven by rising healthcare awareness and increasing disposable incomes.
Growth within specific segments will vary. Hospital pharmacies currently hold a significant share of the distribution channels, reflecting the use of oral thin films in acute care settings. However, the retail pharmacy segment is anticipated to show considerable growth as more drugs become available through this channel, catering to patients with chronic conditions needing long-term medication. Competition among leading players such as Sunovion Pharmaceuticals Inc, Aquestive Therapeutics Inc, and Viatris is intense, with ongoing innovation and strategic partnerships shaping market dynamics. The forecast period (2025-2033) offers significant opportunities for companies focusing on research and development of innovative oral thin film formulations for diverse therapeutic areas and expanding their market presence in emerging economies. Further market penetration hinges on successful clinical trials, regulatory approvals, and strategic marketing efforts to reach targeted patient populations and healthcare professionals.
Oral Thin Film Drugs Industry Market Report: 2019-2033 Forecast
This comprehensive report provides a detailed analysis of the Oral Thin Film Drugs industry, offering invaluable insights for stakeholders, investors, and industry professionals. Covering the period 2019-2033, with a focus on 2025, this report analyzes market dynamics, leading players, emerging trends, and future growth potential. The market is projected to reach xx Million by 2033, exhibiting a CAGR of xx% during the forecast period (2025-2033).
Oral Thin Film Drugs Industry Market Dynamics & Concentration
The Oral Thin Film Drugs market is characterized by moderate concentration, with key players like Sunovion Pharmaceuticals Inc, C L Pharm, Aquestive Therapeutics Inc, ZIM Laboratories Limited, LTS Lohmann Therapie- Systeme AG, Viatris, Cure Pharmaceutical, IntelGenx Corp, and NAL Pharma holding significant market share. However, the entry of new players and the ongoing development of innovative products are driving increased competition. Market concentration is further shaped by regulatory approvals, intellectual property rights, and the successful marketing and distribution of innovative oral thin film formulations.
Innovation within the industry is fueled by the demand for improved patient compliance and the development of more effective drug delivery systems. Stringent regulatory frameworks, particularly from agencies like the FDA, play a crucial role in shaping market dynamics. The existence of alternative drug delivery methods, such as tablets and capsules, poses a competitive challenge. End-user trends, such as a growing preference for convenient and easy-to-administer medications, favor the growth of oral thin film drugs.
Mergers and acquisitions (M&A) activity has been relatively modest in recent years. However, strategic partnerships and collaborations are increasing as companies seek to expand their product portfolios and market reach. The number of M&A deals in the industry between 2019 and 2024 averaged approximately xx per year, with a xx% increase in value between 2023 and 2024. The market share of the top 5 players accounts for approximately xx% of the global market.
Oral Thin Film Drugs Industry Industry Trends & Analysis
The Oral Thin Film Drugs market is experiencing significant growth, driven by several key factors. The rising prevalence of chronic diseases, coupled with the increasing demand for convenient and patient-friendly drug delivery systems, is a major driver. Technological advancements, such as the development of novel film-forming materials and improved manufacturing processes, are enabling the creation of more effective and stable oral thin film formulations. The shift towards personalized medicine and the growing demand for targeted drug delivery are also boosting market growth.
Consumer preferences for easy-to-use medications with improved bioavailability and reduced side effects are significantly influencing market trends. The competitive landscape is becoming increasingly dynamic, with established pharmaceutical companies and emerging biotech firms vying for market share. The market is witnessing a considerable increase in the adoption of oral thin films for various therapeutic applications. The CAGR for the Oral Thin Film Drugs market during the historical period (2019-2024) was xx%, and market penetration for the leading product types in 2024 was estimated at xx%. This high penetration is expected to propel sustained market growth during the forecast period.
Leading Markets & Segments in Oral Thin Film Drugs Industry
The North American region currently dominates the Oral Thin Film Drugs market, driven by factors such as high healthcare expenditure, a robust regulatory framework, and strong technological capabilities. Within this region, the United States holds the largest market share. Key drivers for this dominance include:
- Strong R&D infrastructure: Significant investments in research and development (R&D) have led to the development of innovative oral thin film formulations.
- High healthcare expenditure: The high level of healthcare spending enables the adoption of advanced drug delivery technologies.
- Favorable regulatory environment: Clear and well-defined regulatory guidelines from the FDA facilitate product approvals and market entry.
While the North American market is dominant, the Asia Pacific region is expected to experience significant growth in the coming years, driven by increasing healthcare expenditure, rising prevalence of chronic diseases, and growing awareness of advanced drug delivery systems.
In terms of disease indications, Opioid Dependence and Nausea and Vomiting currently account for the largest segments of the market. The growth in these segments is fueled by the effectiveness of oral thin films in delivering these critical medications and addressing the associated challenges of patient adherence. Retail pharmacies are the most dominant distribution channel, largely due to the convenient access they provide to patients. Sublingual films represent the majority of the products within the market.
Oral Thin Film Drugs Industry Product Developments
Recent years have witnessed significant advancements in oral thin film technology. Innovations focus on improving drug solubility, stability, and bioavailability. The development of novel film-forming materials and manufacturing processes is leading to improved product quality and patient experience. Competition is driving manufacturers to develop unique formulations with enhanced efficacy and convenience features, catering to specific patient needs and therapeutic applications. This technological progress allows for targeted drug delivery and improved therapeutic outcomes, widening the applications of oral thin films across diverse disease indications.
Key Drivers of Oral Thin Film Drugs Industry Growth
Several factors fuel the growth of the Oral Thin Film Drugs industry:
- Technological advancements: Continuous innovations in film-forming materials, manufacturing processes, and drug delivery systems are improving product efficacy and patient compliance.
- Favorable regulatory environment: Supportive regulatory frameworks are streamlining the approval process for new oral thin film products.
- Rising healthcare expenditure: Increased investment in healthcare and the growing awareness of advanced drug delivery systems contribute to market expansion.
- Growing prevalence of chronic diseases: The escalating incidence of chronic diseases necessitates the development of more effective and convenient drug delivery methods.
Challenges in the Oral Thin Film Drugs Industry Market
The Oral Thin Film Drugs market faces challenges, such as stringent regulatory approvals, complex manufacturing processes, and intense competition. Regulatory hurdles significantly impact the time and cost associated with product development and launch. Supply chain disruptions, particularly concerning the sourcing of specialized raw materials, can affect the production and availability of oral thin film drugs. Competition from established pharmaceutical companies and emerging biotech firms poses a significant challenge to market entry and growth for new players. These factors cumulatively impact profitability margins.
Emerging Opportunities in Oral Thin Film Drugs Industry
Long-term growth prospects are promising, fueled by continuous technological innovation, strategic partnerships, and market expansion into emerging economies. Breakthroughs in drug delivery technologies are expected to unlock new therapeutic applications for oral thin films. Strategic alliances and collaborations between pharmaceutical companies and technology providers can accelerate innovation and enhance market reach. Penetration into untapped markets, particularly in developing countries, presents significant growth potential, driven by increasing healthcare awareness and growing demand for convenient and effective drug delivery solutions.
Leading Players in the Oral Thin Film Drugs Industry Sector
- Sunovion Pharmaceuticals Inc
- C L Pharm
- Aquestive Therapeutics Inc
- ZIM Laboratories Limited
- LTS Lohmann Therapie-Systeme AG
- Viatris
- Cure Pharmaceutical
- IntelGenx Corp
- NAL Pharma
Key Milestones in Oral Thin Film Drugs Industry Industry
- October 2022: IntelGenx Corp. received a U.S. FDA Generic Drug User Fee Act ("GDUFA") for its Buprenorphine Buccal Film, a generic version of Belbuca. This significantly expands market access for a key opioid pain management drug in a convenient formulation.
- August 2022: Aquestive Therapeutics received FDA approval for Libervant (diazepam) Buccal Film for treating seizures, expanding the therapeutic applications of oral thin films in a critical area of neurological care.
Strategic Outlook for Oral Thin Film Drugs Industry Market
The Oral Thin Film Drugs market is poised for substantial growth driven by technological advancements, increasing healthcare expenditure, and the rising prevalence of chronic diseases. Strategic partnerships and collaborations will play a crucial role in accelerating innovation and market expansion. Focusing on developing targeted therapies for specific patient populations, leveraging personalized medicine approaches, and expanding into emerging markets presents significant opportunities for growth. The market's future success hinges on adapting to evolving regulatory landscapes and fostering continuous innovation to maintain a competitive edge.
Oral Thin Film Drugs Industry Segmentation
-
1. Product
- 1.1. Sublingual Film
- 1.2. Other Products
-
2. Disease Indication
- 2.1. Opioid Dependence
- 2.2. Nausea and Vomiting
- 2.3. Other Disease Indications
-
3. Distribution Channel
- 3.1. Hospital Pharmacies
- 3.2. Retail Pharmacies
- 3.3. Other Distribution Channels
Oral Thin Film Drugs Industry Segmentation By Geography
-
1. North America
- 1.1. United States
- 1.2. Canada
- 1.3. Mexico
-
2. Europe
- 2.1. Germany
- 2.2. United Kingdom
- 2.3. France
- 2.4. Italy
- 2.5. Spain
- 2.6. Rest of Europe
-
3. Asia Pacific
- 3.1. China
- 3.2. Japan
- 3.3. India
- 3.4. Australia
- 3.5. South Korea
- 3.6. Rest of Asia Pacific
-
4. Middle East and Africa
- 4.1. GCC
- 4.2. South Africa
- 4.3. Rest of Middle East and Africa
-
5. South America
- 5.1. Brazil
- 5.2. Argentina
- 5.3. Rest of South America
Oral Thin Film Drugs Industry REPORT HIGHLIGHTS
| Aspects | Details |
|---|---|
| Study Period | 2019-2033 |
| Base Year | 2024 |
| Estimated Year | 2025 |
| Forecast Period | 2025-2033 |
| Historical Period | 2019-2024 |
| Growth Rate | CAGR of 9.56% from 2019-2033 |
| Segmentation |
|
Table of Contents
- 1. Introduction
- 1.1. Research Scope
- 1.2. Market Segmentation
- 1.3. Research Methodology
- 1.4. Definitions and Assumptions
- 2. Executive Summary
- 2.1. Introduction
- 3. Market Dynamics
- 3.1. Introduction
- 3.2. Market Drivers
- 3.2.1. Growing Burden of Target Diseases; Advantages Associated with the Thin Films
- 3.3. Market Restrains
- 3.3.1. Technical Limitations of Oral Thin Films
- 3.4. Market Trends
- 3.4.1. The Sublingual Film Segment is Expected to Witness Considerable Growth Over the Forecast Period
- 4. Market Factor Analysis
- 4.1. Porters Five Forces
- 4.2. Supply/Value Chain
- 4.3. PESTEL analysis
- 4.4. Market Entropy
- 4.5. Patent/Trademark Analysis
- 5. Global Oral Thin Film Drugs Industry Analysis, Insights and Forecast, 2019-2031
- 5.1. Market Analysis, Insights and Forecast - by Product
- 5.1.1. Sublingual Film
- 5.1.2. Other Products
- 5.2. Market Analysis, Insights and Forecast - by Disease Indication
- 5.2.1. Opioid Dependence
- 5.2.2. Nausea and Vomiting
- 5.2.3. Other Disease Indications
- 5.3. Market Analysis, Insights and Forecast - by Distribution Channel
- 5.3.1. Hospital Pharmacies
- 5.3.2. Retail Pharmacies
- 5.3.3. Other Distribution Channels
- 5.4. Market Analysis, Insights and Forecast - by Region
- 5.4.1. North America
- 5.4.2. Europe
- 5.4.3. Asia Pacific
- 5.4.4. Middle East and Africa
- 5.4.5. South America
- 5.1. Market Analysis, Insights and Forecast - by Product
- 6. North America Oral Thin Film Drugs Industry Analysis, Insights and Forecast, 2019-2031
- 6.1. Market Analysis, Insights and Forecast - by Product
- 6.1.1. Sublingual Film
- 6.1.2. Other Products
- 6.2. Market Analysis, Insights and Forecast - by Disease Indication
- 6.2.1. Opioid Dependence
- 6.2.2. Nausea and Vomiting
- 6.2.3. Other Disease Indications
- 6.3. Market Analysis, Insights and Forecast - by Distribution Channel
- 6.3.1. Hospital Pharmacies
- 6.3.2. Retail Pharmacies
- 6.3.3. Other Distribution Channels
- 6.1. Market Analysis, Insights and Forecast - by Product
- 7. Europe Oral Thin Film Drugs Industry Analysis, Insights and Forecast, 2019-2031
- 7.1. Market Analysis, Insights and Forecast - by Product
- 7.1.1. Sublingual Film
- 7.1.2. Other Products
- 7.2. Market Analysis, Insights and Forecast - by Disease Indication
- 7.2.1. Opioid Dependence
- 7.2.2. Nausea and Vomiting
- 7.2.3. Other Disease Indications
- 7.3. Market Analysis, Insights and Forecast - by Distribution Channel
- 7.3.1. Hospital Pharmacies
- 7.3.2. Retail Pharmacies
- 7.3.3. Other Distribution Channels
- 7.1. Market Analysis, Insights and Forecast - by Product
- 8. Asia Pacific Oral Thin Film Drugs Industry Analysis, Insights and Forecast, 2019-2031
- 8.1. Market Analysis, Insights and Forecast - by Product
- 8.1.1. Sublingual Film
- 8.1.2. Other Products
- 8.2. Market Analysis, Insights and Forecast - by Disease Indication
- 8.2.1. Opioid Dependence
- 8.2.2. Nausea and Vomiting
- 8.2.3. Other Disease Indications
- 8.3. Market Analysis, Insights and Forecast - by Distribution Channel
- 8.3.1. Hospital Pharmacies
- 8.3.2. Retail Pharmacies
- 8.3.3. Other Distribution Channels
- 8.1. Market Analysis, Insights and Forecast - by Product
- 9. Middle East and Africa Oral Thin Film Drugs Industry Analysis, Insights and Forecast, 2019-2031
- 9.1. Market Analysis, Insights and Forecast - by Product
- 9.1.1. Sublingual Film
- 9.1.2. Other Products
- 9.2. Market Analysis, Insights and Forecast - by Disease Indication
- 9.2.1. Opioid Dependence
- 9.2.2. Nausea and Vomiting
- 9.2.3. Other Disease Indications
- 9.3. Market Analysis, Insights and Forecast - by Distribution Channel
- 9.3.1. Hospital Pharmacies
- 9.3.2. Retail Pharmacies
- 9.3.3. Other Distribution Channels
- 9.1. Market Analysis, Insights and Forecast - by Product
- 10. South America Oral Thin Film Drugs Industry Analysis, Insights and Forecast, 2019-2031
- 10.1. Market Analysis, Insights and Forecast - by Product
- 10.1.1. Sublingual Film
- 10.1.2. Other Products
- 10.2. Market Analysis, Insights and Forecast - by Disease Indication
- 10.2.1. Opioid Dependence
- 10.2.2. Nausea and Vomiting
- 10.2.3. Other Disease Indications
- 10.3. Market Analysis, Insights and Forecast - by Distribution Channel
- 10.3.1. Hospital Pharmacies
- 10.3.2. Retail Pharmacies
- 10.3.3. Other Distribution Channels
- 10.1. Market Analysis, Insights and Forecast - by Product
- 11. North America Oral Thin Film Drugs Industry Analysis, Insights and Forecast, 2019-2031
- 11.1. Market Analysis, Insights and Forecast - By Country/Sub-region
- 11.1.1 United States
- 11.1.2 Canada
- 11.1.3 Mexico
- 12. Europe Oral Thin Film Drugs Industry Analysis, Insights and Forecast, 2019-2031
- 12.1. Market Analysis, Insights and Forecast - By Country/Sub-region
- 12.1.1 Germany
- 12.1.2 United Kingdom
- 12.1.3 France
- 12.1.4 Italy
- 12.1.5 Spain
- 12.1.6 Rest of Europe
- 13. Asia Pacific Oral Thin Film Drugs Industry Analysis, Insights and Forecast, 2019-2031
- 13.1. Market Analysis, Insights and Forecast - By Country/Sub-region
- 13.1.1 China
- 13.1.2 Japan
- 13.1.3 India
- 13.1.4 Australia
- 13.1.5 South Korea
- 13.1.6 Rest of Asia Pacific
- 14. Middle East Oral Thin Film Drugs Industry Analysis, Insights and Forecast, 2019-2031
- 14.1. Market Analysis, Insights and Forecast - By Country/Sub-region
- 14.1.1.
- 15. GCC Oral Thin Film Drugs Industry Analysis, Insights and Forecast, 2019-2031
- 15.1. Market Analysis, Insights and Forecast - By Country/Sub-region
- 15.1.1 South Africa
- 15.1.2 Rest of Middle East
- 16. South America Oral Thin Film Drugs Industry Analysis, Insights and Forecast, 2019-2031
- 16.1. Market Analysis, Insights and Forecast - By Country/Sub-region
- 16.1.1 Brazil
- 16.1.2 Argentina
- 16.1.3 Rest of South America
- 17. Competitive Analysis
- 17.1. Global Market Share Analysis 2024
- 17.2. Company Profiles
- 17.2.1 Sunovion Pharmaceuticals Inc
- 17.2.1.1. Overview
- 17.2.1.2. Products
- 17.2.1.3. SWOT Analysis
- 17.2.1.4. Recent Developments
- 17.2.1.5. Financials (Based on Availability)
- 17.2.2 C L Pharm
- 17.2.2.1. Overview
- 17.2.2.2. Products
- 17.2.2.3. SWOT Analysis
- 17.2.2.4. Recent Developments
- 17.2.2.5. Financials (Based on Availability)
- 17.2.3 Aquestive Therapeutics Inc
- 17.2.3.1. Overview
- 17.2.3.2. Products
- 17.2.3.3. SWOT Analysis
- 17.2.3.4. Recent Developments
- 17.2.3.5. Financials (Based on Availability)
- 17.2.4 ZIM Laboratories Limited
- 17.2.4.1. Overview
- 17.2.4.2. Products
- 17.2.4.3. SWOT Analysis
- 17.2.4.4. Recent Developments
- 17.2.4.5. Financials (Based on Availability)
- 17.2.5 LTS Lohmann Therapie-Systeme AG
- 17.2.5.1. Overview
- 17.2.5.2. Products
- 17.2.5.3. SWOT Analysis
- 17.2.5.4. Recent Developments
- 17.2.5.5. Financials (Based on Availability)
- 17.2.6 Viatris
- 17.2.6.1. Overview
- 17.2.6.2. Products
- 17.2.6.3. SWOT Analysis
- 17.2.6.4. Recent Developments
- 17.2.6.5. Financials (Based on Availability)
- 17.2.7 Cure Pharmaceutical
- 17.2.7.1. Overview
- 17.2.7.2. Products
- 17.2.7.3. SWOT Analysis
- 17.2.7.4. Recent Developments
- 17.2.7.5. Financials (Based on Availability)
- 17.2.8 IntelGenx Corp
- 17.2.8.1. Overview
- 17.2.8.2. Products
- 17.2.8.3. SWOT Analysis
- 17.2.8.4. Recent Developments
- 17.2.8.5. Financials (Based on Availability)
- 17.2.9 NAL Pharma
- 17.2.9.1. Overview
- 17.2.9.2. Products
- 17.2.9.3. SWOT Analysis
- 17.2.9.4. Recent Developments
- 17.2.9.5. Financials (Based on Availability)
- 17.2.1 Sunovion Pharmaceuticals Inc
List of Figures
- Figure 1: Global Oral Thin Film Drugs Industry Revenue Breakdown (Million, %) by Region 2024 & 2032
- Figure 2: Global Oral Thin Film Drugs Industry Volume Breakdown (K Unit, %) by Region 2024 & 2032
- Figure 3: North America Oral Thin Film Drugs Industry Revenue (Million), by Country 2024 & 2032
- Figure 4: North America Oral Thin Film Drugs Industry Volume (K Unit), by Country 2024 & 2032
- Figure 5: North America Oral Thin Film Drugs Industry Revenue Share (%), by Country 2024 & 2032
- Figure 6: North America Oral Thin Film Drugs Industry Volume Share (%), by Country 2024 & 2032
- Figure 7: Europe Oral Thin Film Drugs Industry Revenue (Million), by Country 2024 & 2032
- Figure 8: Europe Oral Thin Film Drugs Industry Volume (K Unit), by Country 2024 & 2032
- Figure 9: Europe Oral Thin Film Drugs Industry Revenue Share (%), by Country 2024 & 2032
- Figure 10: Europe Oral Thin Film Drugs Industry Volume Share (%), by Country 2024 & 2032
- Figure 11: Asia Pacific Oral Thin Film Drugs Industry Revenue (Million), by Country 2024 & 2032
- Figure 12: Asia Pacific Oral Thin Film Drugs Industry Volume (K Unit), by Country 2024 & 2032
- Figure 13: Asia Pacific Oral Thin Film Drugs Industry Revenue Share (%), by Country 2024 & 2032
- Figure 14: Asia Pacific Oral Thin Film Drugs Industry Volume Share (%), by Country 2024 & 2032
- Figure 15: Middle East Oral Thin Film Drugs Industry Revenue (Million), by Country 2024 & 2032
- Figure 16: Middle East Oral Thin Film Drugs Industry Volume (K Unit), by Country 2024 & 2032
- Figure 17: Middle East Oral Thin Film Drugs Industry Revenue Share (%), by Country 2024 & 2032
- Figure 18: Middle East Oral Thin Film Drugs Industry Volume Share (%), by Country 2024 & 2032
- Figure 19: GCC Oral Thin Film Drugs Industry Revenue (Million), by Country 2024 & 2032
- Figure 20: GCC Oral Thin Film Drugs Industry Volume (K Unit), by Country 2024 & 2032
- Figure 21: GCC Oral Thin Film Drugs Industry Revenue Share (%), by Country 2024 & 2032
- Figure 22: GCC Oral Thin Film Drugs Industry Volume Share (%), by Country 2024 & 2032
- Figure 23: South America Oral Thin Film Drugs Industry Revenue (Million), by Country 2024 & 2032
- Figure 24: South America Oral Thin Film Drugs Industry Volume (K Unit), by Country 2024 & 2032
- Figure 25: South America Oral Thin Film Drugs Industry Revenue Share (%), by Country 2024 & 2032
- Figure 26: South America Oral Thin Film Drugs Industry Volume Share (%), by Country 2024 & 2032
- Figure 27: North America Oral Thin Film Drugs Industry Revenue (Million), by Product 2024 & 2032
- Figure 28: North America Oral Thin Film Drugs Industry Volume (K Unit), by Product 2024 & 2032
- Figure 29: North America Oral Thin Film Drugs Industry Revenue Share (%), by Product 2024 & 2032
- Figure 30: North America Oral Thin Film Drugs Industry Volume Share (%), by Product 2024 & 2032
- Figure 31: North America Oral Thin Film Drugs Industry Revenue (Million), by Disease Indication 2024 & 2032
- Figure 32: North America Oral Thin Film Drugs Industry Volume (K Unit), by Disease Indication 2024 & 2032
- Figure 33: North America Oral Thin Film Drugs Industry Revenue Share (%), by Disease Indication 2024 & 2032
- Figure 34: North America Oral Thin Film Drugs Industry Volume Share (%), by Disease Indication 2024 & 2032
- Figure 35: North America Oral Thin Film Drugs Industry Revenue (Million), by Distribution Channel 2024 & 2032
- Figure 36: North America Oral Thin Film Drugs Industry Volume (K Unit), by Distribution Channel 2024 & 2032
- Figure 37: North America Oral Thin Film Drugs Industry Revenue Share (%), by Distribution Channel 2024 & 2032
- Figure 38: North America Oral Thin Film Drugs Industry Volume Share (%), by Distribution Channel 2024 & 2032
- Figure 39: North America Oral Thin Film Drugs Industry Revenue (Million), by Country 2024 & 2032
- Figure 40: North America Oral Thin Film Drugs Industry Volume (K Unit), by Country 2024 & 2032
- Figure 41: North America Oral Thin Film Drugs Industry Revenue Share (%), by Country 2024 & 2032
- Figure 42: North America Oral Thin Film Drugs Industry Volume Share (%), by Country 2024 & 2032
- Figure 43: Europe Oral Thin Film Drugs Industry Revenue (Million), by Product 2024 & 2032
- Figure 44: Europe Oral Thin Film Drugs Industry Volume (K Unit), by Product 2024 & 2032
- Figure 45: Europe Oral Thin Film Drugs Industry Revenue Share (%), by Product 2024 & 2032
- Figure 46: Europe Oral Thin Film Drugs Industry Volume Share (%), by Product 2024 & 2032
- Figure 47: Europe Oral Thin Film Drugs Industry Revenue (Million), by Disease Indication 2024 & 2032
- Figure 48: Europe Oral Thin Film Drugs Industry Volume (K Unit), by Disease Indication 2024 & 2032
- Figure 49: Europe Oral Thin Film Drugs Industry Revenue Share (%), by Disease Indication 2024 & 2032
- Figure 50: Europe Oral Thin Film Drugs Industry Volume Share (%), by Disease Indication 2024 & 2032
- Figure 51: Europe Oral Thin Film Drugs Industry Revenue (Million), by Distribution Channel 2024 & 2032
- Figure 52: Europe Oral Thin Film Drugs Industry Volume (K Unit), by Distribution Channel 2024 & 2032
- Figure 53: Europe Oral Thin Film Drugs Industry Revenue Share (%), by Distribution Channel 2024 & 2032
- Figure 54: Europe Oral Thin Film Drugs Industry Volume Share (%), by Distribution Channel 2024 & 2032
- Figure 55: Europe Oral Thin Film Drugs Industry Revenue (Million), by Country 2024 & 2032
- Figure 56: Europe Oral Thin Film Drugs Industry Volume (K Unit), by Country 2024 & 2032
- Figure 57: Europe Oral Thin Film Drugs Industry Revenue Share (%), by Country 2024 & 2032
- Figure 58: Europe Oral Thin Film Drugs Industry Volume Share (%), by Country 2024 & 2032
- Figure 59: Asia Pacific Oral Thin Film Drugs Industry Revenue (Million), by Product 2024 & 2032
- Figure 60: Asia Pacific Oral Thin Film Drugs Industry Volume (K Unit), by Product 2024 & 2032
- Figure 61: Asia Pacific Oral Thin Film Drugs Industry Revenue Share (%), by Product 2024 & 2032
- Figure 62: Asia Pacific Oral Thin Film Drugs Industry Volume Share (%), by Product 2024 & 2032
- Figure 63: Asia Pacific Oral Thin Film Drugs Industry Revenue (Million), by Disease Indication 2024 & 2032
- Figure 64: Asia Pacific Oral Thin Film Drugs Industry Volume (K Unit), by Disease Indication 2024 & 2032
- Figure 65: Asia Pacific Oral Thin Film Drugs Industry Revenue Share (%), by Disease Indication 2024 & 2032
- Figure 66: Asia Pacific Oral Thin Film Drugs Industry Volume Share (%), by Disease Indication 2024 & 2032
- Figure 67: Asia Pacific Oral Thin Film Drugs Industry Revenue (Million), by Distribution Channel 2024 & 2032
- Figure 68: Asia Pacific Oral Thin Film Drugs Industry Volume (K Unit), by Distribution Channel 2024 & 2032
- Figure 69: Asia Pacific Oral Thin Film Drugs Industry Revenue Share (%), by Distribution Channel 2024 & 2032
- Figure 70: Asia Pacific Oral Thin Film Drugs Industry Volume Share (%), by Distribution Channel 2024 & 2032
- Figure 71: Asia Pacific Oral Thin Film Drugs Industry Revenue (Million), by Country 2024 & 2032
- Figure 72: Asia Pacific Oral Thin Film Drugs Industry Volume (K Unit), by Country 2024 & 2032
- Figure 73: Asia Pacific Oral Thin Film Drugs Industry Revenue Share (%), by Country 2024 & 2032
- Figure 74: Asia Pacific Oral Thin Film Drugs Industry Volume Share (%), by Country 2024 & 2032
- Figure 75: Middle East and Africa Oral Thin Film Drugs Industry Revenue (Million), by Product 2024 & 2032
- Figure 76: Middle East and Africa Oral Thin Film Drugs Industry Volume (K Unit), by Product 2024 & 2032
- Figure 77: Middle East and Africa Oral Thin Film Drugs Industry Revenue Share (%), by Product 2024 & 2032
- Figure 78: Middle East and Africa Oral Thin Film Drugs Industry Volume Share (%), by Product 2024 & 2032
- Figure 79: Middle East and Africa Oral Thin Film Drugs Industry Revenue (Million), by Disease Indication 2024 & 2032
- Figure 80: Middle East and Africa Oral Thin Film Drugs Industry Volume (K Unit), by Disease Indication 2024 & 2032
- Figure 81: Middle East and Africa Oral Thin Film Drugs Industry Revenue Share (%), by Disease Indication 2024 & 2032
- Figure 82: Middle East and Africa Oral Thin Film Drugs Industry Volume Share (%), by Disease Indication 2024 & 2032
- Figure 83: Middle East and Africa Oral Thin Film Drugs Industry Revenue (Million), by Distribution Channel 2024 & 2032
- Figure 84: Middle East and Africa Oral Thin Film Drugs Industry Volume (K Unit), by Distribution Channel 2024 & 2032
- Figure 85: Middle East and Africa Oral Thin Film Drugs Industry Revenue Share (%), by Distribution Channel 2024 & 2032
- Figure 86: Middle East and Africa Oral Thin Film Drugs Industry Volume Share (%), by Distribution Channel 2024 & 2032
- Figure 87: Middle East and Africa Oral Thin Film Drugs Industry Revenue (Million), by Country 2024 & 2032
- Figure 88: Middle East and Africa Oral Thin Film Drugs Industry Volume (K Unit), by Country 2024 & 2032
- Figure 89: Middle East and Africa Oral Thin Film Drugs Industry Revenue Share (%), by Country 2024 & 2032
- Figure 90: Middle East and Africa Oral Thin Film Drugs Industry Volume Share (%), by Country 2024 & 2032
- Figure 91: South America Oral Thin Film Drugs Industry Revenue (Million), by Product 2024 & 2032
- Figure 92: South America Oral Thin Film Drugs Industry Volume (K Unit), by Product 2024 & 2032
- Figure 93: South America Oral Thin Film Drugs Industry Revenue Share (%), by Product 2024 & 2032
- Figure 94: South America Oral Thin Film Drugs Industry Volume Share (%), by Product 2024 & 2032
- Figure 95: South America Oral Thin Film Drugs Industry Revenue (Million), by Disease Indication 2024 & 2032
- Figure 96: South America Oral Thin Film Drugs Industry Volume (K Unit), by Disease Indication 2024 & 2032
- Figure 97: South America Oral Thin Film Drugs Industry Revenue Share (%), by Disease Indication 2024 & 2032
- Figure 98: South America Oral Thin Film Drugs Industry Volume Share (%), by Disease Indication 2024 & 2032
- Figure 99: South America Oral Thin Film Drugs Industry Revenue (Million), by Distribution Channel 2024 & 2032
- Figure 100: South America Oral Thin Film Drugs Industry Volume (K Unit), by Distribution Channel 2024 & 2032
- Figure 101: South America Oral Thin Film Drugs Industry Revenue Share (%), by Distribution Channel 2024 & 2032
- Figure 102: South America Oral Thin Film Drugs Industry Volume Share (%), by Distribution Channel 2024 & 2032
- Figure 103: South America Oral Thin Film Drugs Industry Revenue (Million), by Country 2024 & 2032
- Figure 104: South America Oral Thin Film Drugs Industry Volume (K Unit), by Country 2024 & 2032
- Figure 105: South America Oral Thin Film Drugs Industry Revenue Share (%), by Country 2024 & 2032
- Figure 106: South America Oral Thin Film Drugs Industry Volume Share (%), by Country 2024 & 2032
List of Tables
- Table 1: Global Oral Thin Film Drugs Industry Revenue Million Forecast, by Region 2019 & 2032
- Table 2: Global Oral Thin Film Drugs Industry Volume K Unit Forecast, by Region 2019 & 2032
- Table 3: Global Oral Thin Film Drugs Industry Revenue Million Forecast, by Product 2019 & 2032
- Table 4: Global Oral Thin Film Drugs Industry Volume K Unit Forecast, by Product 2019 & 2032
- Table 5: Global Oral Thin Film Drugs Industry Revenue Million Forecast, by Disease Indication 2019 & 2032
- Table 6: Global Oral Thin Film Drugs Industry Volume K Unit Forecast, by Disease Indication 2019 & 2032
- Table 7: Global Oral Thin Film Drugs Industry Revenue Million Forecast, by Distribution Channel 2019 & 2032
- Table 8: Global Oral Thin Film Drugs Industry Volume K Unit Forecast, by Distribution Channel 2019 & 2032
- Table 9: Global Oral Thin Film Drugs Industry Revenue Million Forecast, by Region 2019 & 2032
- Table 10: Global Oral Thin Film Drugs Industry Volume K Unit Forecast, by Region 2019 & 2032
- Table 11: Global Oral Thin Film Drugs Industry Revenue Million Forecast, by Country 2019 & 2032
- Table 12: Global Oral Thin Film Drugs Industry Volume K Unit Forecast, by Country 2019 & 2032
- Table 13: United States Oral Thin Film Drugs Industry Revenue (Million) Forecast, by Application 2019 & 2032
- Table 14: United States Oral Thin Film Drugs Industry Volume (K Unit) Forecast, by Application 2019 & 2032
- Table 15: Canada Oral Thin Film Drugs Industry Revenue (Million) Forecast, by Application 2019 & 2032
- Table 16: Canada Oral Thin Film Drugs Industry Volume (K Unit) Forecast, by Application 2019 & 2032
- Table 17: Mexico Oral Thin Film Drugs Industry Revenue (Million) Forecast, by Application 2019 & 2032
- Table 18: Mexico Oral Thin Film Drugs Industry Volume (K Unit) Forecast, by Application 2019 & 2032
- Table 19: Global Oral Thin Film Drugs Industry Revenue Million Forecast, by Country 2019 & 2032
- Table 20: Global Oral Thin Film Drugs Industry Volume K Unit Forecast, by Country 2019 & 2032
- Table 21: Germany Oral Thin Film Drugs Industry Revenue (Million) Forecast, by Application 2019 & 2032
- Table 22: Germany Oral Thin Film Drugs Industry Volume (K Unit) Forecast, by Application 2019 & 2032
- Table 23: United Kingdom Oral Thin Film Drugs Industry Revenue (Million) Forecast, by Application 2019 & 2032
- Table 24: United Kingdom Oral Thin Film Drugs Industry Volume (K Unit) Forecast, by Application 2019 & 2032
- Table 25: France Oral Thin Film Drugs Industry Revenue (Million) Forecast, by Application 2019 & 2032
- Table 26: France Oral Thin Film Drugs Industry Volume (K Unit) Forecast, by Application 2019 & 2032
- Table 27: Italy Oral Thin Film Drugs Industry Revenue (Million) Forecast, by Application 2019 & 2032
- Table 28: Italy Oral Thin Film Drugs Industry Volume (K Unit) Forecast, by Application 2019 & 2032
- Table 29: Spain Oral Thin Film Drugs Industry Revenue (Million) Forecast, by Application 2019 & 2032
- Table 30: Spain Oral Thin Film Drugs Industry Volume (K Unit) Forecast, by Application 2019 & 2032
- Table 31: Rest of Europe Oral Thin Film Drugs Industry Revenue (Million) Forecast, by Application 2019 & 2032
- Table 32: Rest of Europe Oral Thin Film Drugs Industry Volume (K Unit) Forecast, by Application 2019 & 2032
- Table 33: Global Oral Thin Film Drugs Industry Revenue Million Forecast, by Country 2019 & 2032
- Table 34: Global Oral Thin Film Drugs Industry Volume K Unit Forecast, by Country 2019 & 2032
- Table 35: China Oral Thin Film Drugs Industry Revenue (Million) Forecast, by Application 2019 & 2032
- Table 36: China Oral Thin Film Drugs Industry Volume (K Unit) Forecast, by Application 2019 & 2032
- Table 37: Japan Oral Thin Film Drugs Industry Revenue (Million) Forecast, by Application 2019 & 2032
- Table 38: Japan Oral Thin Film Drugs Industry Volume (K Unit) Forecast, by Application 2019 & 2032
- Table 39: India Oral Thin Film Drugs Industry Revenue (Million) Forecast, by Application 2019 & 2032
- Table 40: India Oral Thin Film Drugs Industry Volume (K Unit) Forecast, by Application 2019 & 2032
- Table 41: Australia Oral Thin Film Drugs Industry Revenue (Million) Forecast, by Application 2019 & 2032
- Table 42: Australia Oral Thin Film Drugs Industry Volume (K Unit) Forecast, by Application 2019 & 2032
- Table 43: South Korea Oral Thin Film Drugs Industry Revenue (Million) Forecast, by Application 2019 & 2032
- Table 44: South Korea Oral Thin Film Drugs Industry Volume (K Unit) Forecast, by Application 2019 & 2032
- Table 45: Rest of Asia Pacific Oral Thin Film Drugs Industry Revenue (Million) Forecast, by Application 2019 & 2032
- Table 46: Rest of Asia Pacific Oral Thin Film Drugs Industry Volume (K Unit) Forecast, by Application 2019 & 2032
- Table 47: Global Oral Thin Film Drugs Industry Revenue Million Forecast, by Country 2019 & 2032
- Table 48: Global Oral Thin Film Drugs Industry Volume K Unit Forecast, by Country 2019 & 2032
- Table 49: Oral Thin Film Drugs Industry Revenue (Million) Forecast, by Application 2019 & 2032
- Table 50: Oral Thin Film Drugs Industry Volume (K Unit) Forecast, by Application 2019 & 2032
- Table 51: Global Oral Thin Film Drugs Industry Revenue Million Forecast, by Country 2019 & 2032
- Table 52: Global Oral Thin Film Drugs Industry Volume K Unit Forecast, by Country 2019 & 2032
- Table 53: South Africa Oral Thin Film Drugs Industry Revenue (Million) Forecast, by Application 2019 & 2032
- Table 54: South Africa Oral Thin Film Drugs Industry Volume (K Unit) Forecast, by Application 2019 & 2032
- Table 55: Rest of Middle East Oral Thin Film Drugs Industry Revenue (Million) Forecast, by Application 2019 & 2032
- Table 56: Rest of Middle East Oral Thin Film Drugs Industry Volume (K Unit) Forecast, by Application 2019 & 2032
- Table 57: Global Oral Thin Film Drugs Industry Revenue Million Forecast, by Country 2019 & 2032
- Table 58: Global Oral Thin Film Drugs Industry Volume K Unit Forecast, by Country 2019 & 2032
- Table 59: Brazil Oral Thin Film Drugs Industry Revenue (Million) Forecast, by Application 2019 & 2032
- Table 60: Brazil Oral Thin Film Drugs Industry Volume (K Unit) Forecast, by Application 2019 & 2032
- Table 61: Argentina Oral Thin Film Drugs Industry Revenue (Million) Forecast, by Application 2019 & 2032
- Table 62: Argentina Oral Thin Film Drugs Industry Volume (K Unit) Forecast, by Application 2019 & 2032
- Table 63: Rest of South America Oral Thin Film Drugs Industry Revenue (Million) Forecast, by Application 2019 & 2032
- Table 64: Rest of South America Oral Thin Film Drugs Industry Volume (K Unit) Forecast, by Application 2019 & 2032
- Table 65: Global Oral Thin Film Drugs Industry Revenue Million Forecast, by Product 2019 & 2032
- Table 66: Global Oral Thin Film Drugs Industry Volume K Unit Forecast, by Product 2019 & 2032
- Table 67: Global Oral Thin Film Drugs Industry Revenue Million Forecast, by Disease Indication 2019 & 2032
- Table 68: Global Oral Thin Film Drugs Industry Volume K Unit Forecast, by Disease Indication 2019 & 2032
- Table 69: Global Oral Thin Film Drugs Industry Revenue Million Forecast, by Distribution Channel 2019 & 2032
- Table 70: Global Oral Thin Film Drugs Industry Volume K Unit Forecast, by Distribution Channel 2019 & 2032
- Table 71: Global Oral Thin Film Drugs Industry Revenue Million Forecast, by Country 2019 & 2032
- Table 72: Global Oral Thin Film Drugs Industry Volume K Unit Forecast, by Country 2019 & 2032
- Table 73: United States Oral Thin Film Drugs Industry Revenue (Million) Forecast, by Application 2019 & 2032
- Table 74: United States Oral Thin Film Drugs Industry Volume (K Unit) Forecast, by Application 2019 & 2032
- Table 75: Canada Oral Thin Film Drugs Industry Revenue (Million) Forecast, by Application 2019 & 2032
- Table 76: Canada Oral Thin Film Drugs Industry Volume (K Unit) Forecast, by Application 2019 & 2032
- Table 77: Mexico Oral Thin Film Drugs Industry Revenue (Million) Forecast, by Application 2019 & 2032
- Table 78: Mexico Oral Thin Film Drugs Industry Volume (K Unit) Forecast, by Application 2019 & 2032
- Table 79: Global Oral Thin Film Drugs Industry Revenue Million Forecast, by Product 2019 & 2032
- Table 80: Global Oral Thin Film Drugs Industry Volume K Unit Forecast, by Product 2019 & 2032
- Table 81: Global Oral Thin Film Drugs Industry Revenue Million Forecast, by Disease Indication 2019 & 2032
- Table 82: Global Oral Thin Film Drugs Industry Volume K Unit Forecast, by Disease Indication 2019 & 2032
- Table 83: Global Oral Thin Film Drugs Industry Revenue Million Forecast, by Distribution Channel 2019 & 2032
- Table 84: Global Oral Thin Film Drugs Industry Volume K Unit Forecast, by Distribution Channel 2019 & 2032
- Table 85: Global Oral Thin Film Drugs Industry Revenue Million Forecast, by Country 2019 & 2032
- Table 86: Global Oral Thin Film Drugs Industry Volume K Unit Forecast, by Country 2019 & 2032
- Table 87: Germany Oral Thin Film Drugs Industry Revenue (Million) Forecast, by Application 2019 & 2032
- Table 88: Germany Oral Thin Film Drugs Industry Volume (K Unit) Forecast, by Application 2019 & 2032
- Table 89: United Kingdom Oral Thin Film Drugs Industry Revenue (Million) Forecast, by Application 2019 & 2032
- Table 90: United Kingdom Oral Thin Film Drugs Industry Volume (K Unit) Forecast, by Application 2019 & 2032
- Table 91: France Oral Thin Film Drugs Industry Revenue (Million) Forecast, by Application 2019 & 2032
- Table 92: France Oral Thin Film Drugs Industry Volume (K Unit) Forecast, by Application 2019 & 2032
- Table 93: Italy Oral Thin Film Drugs Industry Revenue (Million) Forecast, by Application 2019 & 2032
- Table 94: Italy Oral Thin Film Drugs Industry Volume (K Unit) Forecast, by Application 2019 & 2032
- Table 95: Spain Oral Thin Film Drugs Industry Revenue (Million) Forecast, by Application 2019 & 2032
- Table 96: Spain Oral Thin Film Drugs Industry Volume (K Unit) Forecast, by Application 2019 & 2032
- Table 97: Rest of Europe Oral Thin Film Drugs Industry Revenue (Million) Forecast, by Application 2019 & 2032
- Table 98: Rest of Europe Oral Thin Film Drugs Industry Volume (K Unit) Forecast, by Application 2019 & 2032
- Table 99: Global Oral Thin Film Drugs Industry Revenue Million Forecast, by Product 2019 & 2032
- Table 100: Global Oral Thin Film Drugs Industry Volume K Unit Forecast, by Product 2019 & 2032
- Table 101: Global Oral Thin Film Drugs Industry Revenue Million Forecast, by Disease Indication 2019 & 2032
- Table 102: Global Oral Thin Film Drugs Industry Volume K Unit Forecast, by Disease Indication 2019 & 2032
- Table 103: Global Oral Thin Film Drugs Industry Revenue Million Forecast, by Distribution Channel 2019 & 2032
- Table 104: Global Oral Thin Film Drugs Industry Volume K Unit Forecast, by Distribution Channel 2019 & 2032
- Table 105: Global Oral Thin Film Drugs Industry Revenue Million Forecast, by Country 2019 & 2032
- Table 106: Global Oral Thin Film Drugs Industry Volume K Unit Forecast, by Country 2019 & 2032
- Table 107: China Oral Thin Film Drugs Industry Revenue (Million) Forecast, by Application 2019 & 2032
- Table 108: China Oral Thin Film Drugs Industry Volume (K Unit) Forecast, by Application 2019 & 2032
- Table 109: Japan Oral Thin Film Drugs Industry Revenue (Million) Forecast, by Application 2019 & 2032
- Table 110: Japan Oral Thin Film Drugs Industry Volume (K Unit) Forecast, by Application 2019 & 2032
- Table 111: India Oral Thin Film Drugs Industry Revenue (Million) Forecast, by Application 2019 & 2032
- Table 112: India Oral Thin Film Drugs Industry Volume (K Unit) Forecast, by Application 2019 & 2032
- Table 113: Australia Oral Thin Film Drugs Industry Revenue (Million) Forecast, by Application 2019 & 2032
- Table 114: Australia Oral Thin Film Drugs Industry Volume (K Unit) Forecast, by Application 2019 & 2032
- Table 115: South Korea Oral Thin Film Drugs Industry Revenue (Million) Forecast, by Application 2019 & 2032
- Table 116: South Korea Oral Thin Film Drugs Industry Volume (K Unit) Forecast, by Application 2019 & 2032
- Table 117: Rest of Asia Pacific Oral Thin Film Drugs Industry Revenue (Million) Forecast, by Application 2019 & 2032
- Table 118: Rest of Asia Pacific Oral Thin Film Drugs Industry Volume (K Unit) Forecast, by Application 2019 & 2032
- Table 119: Global Oral Thin Film Drugs Industry Revenue Million Forecast, by Product 2019 & 2032
- Table 120: Global Oral Thin Film Drugs Industry Volume K Unit Forecast, by Product 2019 & 2032
- Table 121: Global Oral Thin Film Drugs Industry Revenue Million Forecast, by Disease Indication 2019 & 2032
- Table 122: Global Oral Thin Film Drugs Industry Volume K Unit Forecast, by Disease Indication 2019 & 2032
- Table 123: Global Oral Thin Film Drugs Industry Revenue Million Forecast, by Distribution Channel 2019 & 2032
- Table 124: Global Oral Thin Film Drugs Industry Volume K Unit Forecast, by Distribution Channel 2019 & 2032
- Table 125: Global Oral Thin Film Drugs Industry Revenue Million Forecast, by Country 2019 & 2032
- Table 126: Global Oral Thin Film Drugs Industry Volume K Unit Forecast, by Country 2019 & 2032
- Table 127: GCC Oral Thin Film Drugs Industry Revenue (Million) Forecast, by Application 2019 & 2032
- Table 128: GCC Oral Thin Film Drugs Industry Volume (K Unit) Forecast, by Application 2019 & 2032
- Table 129: South Africa Oral Thin Film Drugs Industry Revenue (Million) Forecast, by Application 2019 & 2032
- Table 130: South Africa Oral Thin Film Drugs Industry Volume (K Unit) Forecast, by Application 2019 & 2032
- Table 131: Rest of Middle East and Africa Oral Thin Film Drugs Industry Revenue (Million) Forecast, by Application 2019 & 2032
- Table 132: Rest of Middle East and Africa Oral Thin Film Drugs Industry Volume (K Unit) Forecast, by Application 2019 & 2032
- Table 133: Global Oral Thin Film Drugs Industry Revenue Million Forecast, by Product 2019 & 2032
- Table 134: Global Oral Thin Film Drugs Industry Volume K Unit Forecast, by Product 2019 & 2032
- Table 135: Global Oral Thin Film Drugs Industry Revenue Million Forecast, by Disease Indication 2019 & 2032
- Table 136: Global Oral Thin Film Drugs Industry Volume K Unit Forecast, by Disease Indication 2019 & 2032
- Table 137: Global Oral Thin Film Drugs Industry Revenue Million Forecast, by Distribution Channel 2019 & 2032
- Table 138: Global Oral Thin Film Drugs Industry Volume K Unit Forecast, by Distribution Channel 2019 & 2032
- Table 139: Global Oral Thin Film Drugs Industry Revenue Million Forecast, by Country 2019 & 2032
- Table 140: Global Oral Thin Film Drugs Industry Volume K Unit Forecast, by Country 2019 & 2032
- Table 141: Brazil Oral Thin Film Drugs Industry Revenue (Million) Forecast, by Application 2019 & 2032
- Table 142: Brazil Oral Thin Film Drugs Industry Volume (K Unit) Forecast, by Application 2019 & 2032
- Table 143: Argentina Oral Thin Film Drugs Industry Revenue (Million) Forecast, by Application 2019 & 2032
- Table 144: Argentina Oral Thin Film Drugs Industry Volume (K Unit) Forecast, by Application 2019 & 2032
- Table 145: Rest of South America Oral Thin Film Drugs Industry Revenue (Million) Forecast, by Application 2019 & 2032
- Table 146: Rest of South America Oral Thin Film Drugs Industry Volume (K Unit) Forecast, by Application 2019 & 2032
Frequently Asked Questions
1. What is the projected Compound Annual Growth Rate (CAGR) of the Oral Thin Film Drugs Industry?
The projected CAGR is approximately 9.56%.
2. Which companies are prominent players in the Oral Thin Film Drugs Industry?
Key companies in the market include Sunovion Pharmaceuticals Inc, C L Pharm, Aquestive Therapeutics Inc, ZIM Laboratories Limited, LTS Lohmann Therapie-Systeme AG, Viatris, Cure Pharmaceutical, IntelGenx Corp, NAL Pharma.
3. What are the main segments of the Oral Thin Film Drugs Industry?
The market segments include Product, Disease Indication, Distribution Channel.
4. Can you provide details about the market size?
The market size is estimated to be USD 3.01 Million as of 2022.
5. What are some drivers contributing to market growth?
Growing Burden of Target Diseases; Advantages Associated with the Thin Films.
6. What are the notable trends driving market growth?
The Sublingual Film Segment is Expected to Witness Considerable Growth Over the Forecast Period.
7. Are there any restraints impacting market growth?
Technical Limitations of Oral Thin Films.
8. Can you provide examples of recent developments in the market?
In October 2022, IntelGenxCorp. announced that it had received a U.S. FDA Generic Drug User Fee Act ("GDUFA") for its Buprenorphine Buccal Film. Buprenorphine Buccal Film is a generic version of Belbuca, an opioid used to manage severe continuous pain and can be used for long-term treatment.
9. What pricing options are available for accessing the report?
Pricing options include single-user, multi-user, and enterprise licenses priced at USD 4750, USD 5250, and USD 8750 respectively.
10. Is the market size provided in terms of value or volume?
The market size is provided in terms of value, measured in Million and volume, measured in K Unit.
11. Are there any specific market keywords associated with the report?
Yes, the market keyword associated with the report is "Oral Thin Film Drugs Industry," which aids in identifying and referencing the specific market segment covered.
12. How do I determine which pricing option suits my needs best?
The pricing options vary based on user requirements and access needs. Individual users may opt for single-user licenses, while businesses requiring broader access may choose multi-user or enterprise licenses for cost-effective access to the report.
13. Are there any additional resources or data provided in the Oral Thin Film Drugs Industry report?
While the report offers comprehensive insights, it's advisable to review the specific contents or supplementary materials provided to ascertain if additional resources or data are available.
14. How can I stay updated on further developments or reports in the Oral Thin Film Drugs Industry?
To stay informed about further developments, trends, and reports in the Oral Thin Film Drugs Industry, consider subscribing to industry newsletters, following relevant companies and organizations, or regularly checking reputable industry news sources and publications.
Methodology
Step 1 - Identification of Relevant Samples Size from Population Database


Step 2 - Approaches for Defining Global Market Size (Value, Volume* & Price*)

Note*: In applicable scenarios
Step 3 - Data Sources
Primary Research
- Web Analytics
- Survey Reports
- Research Institute
- Latest Research Reports
- Opinion Leaders
Secondary Research
- Annual Reports
- White Paper
- Latest Press Release
- Industry Association
- Paid Database
- Investor Presentations

Step 4 - Data Triangulation
Involves using different sources of information in order to increase the validity of a study
These sources are likely to be stakeholders in a program - participants, other researchers, program staff, other community members, and so on.
Then we put all data in single framework & apply various statistical tools to find out the dynamic on the market.
During the analysis stage, feedback from the stakeholder groups would be compared to determine areas of agreement as well as areas of divergence
