

Key Insights
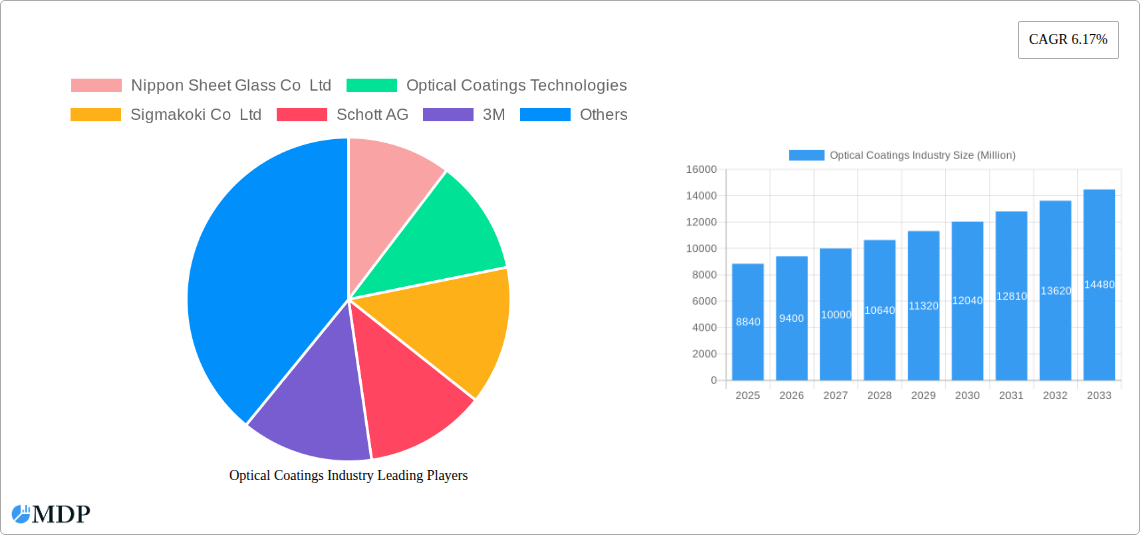
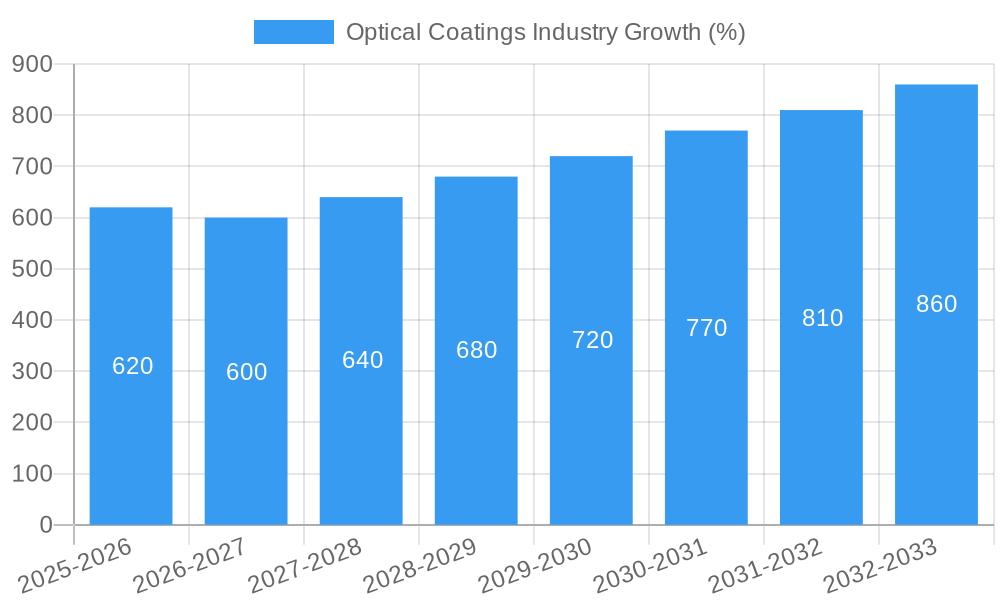
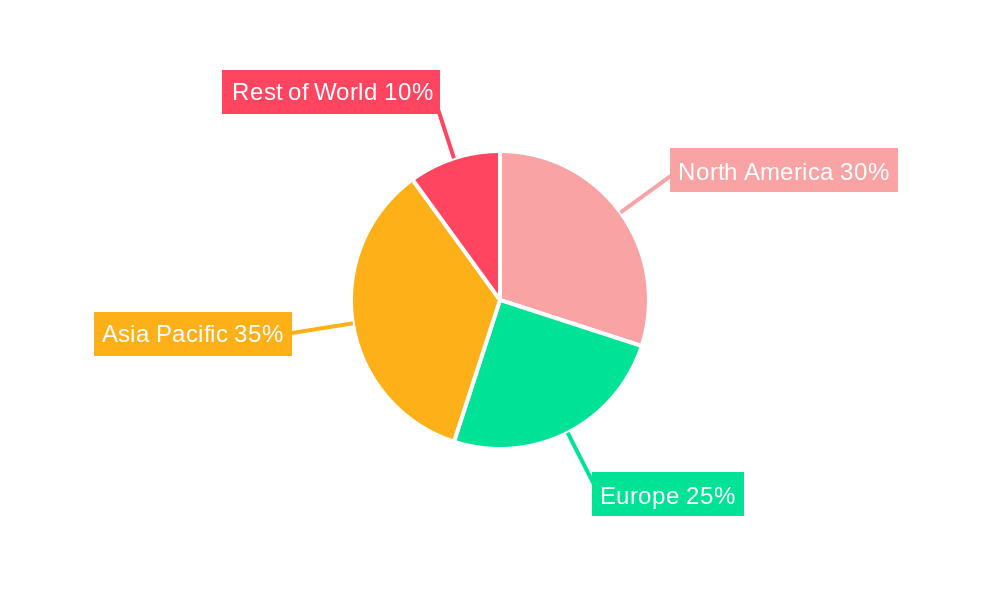
The global optical coatings market, valued at $8.84 billion in 2025, is projected to experience robust growth, driven by a compound annual growth rate (CAGR) of 6.17% from 2025 to 2033. This expansion is fueled by several key factors. The increasing demand for advanced optical components in diverse sectors like electronics, telecommunications, and automotive is a major catalyst. The proliferation of smartphones, high-resolution displays, and sophisticated automotive safety systems necessitates high-performance optical coatings with enhanced functionalities such as anti-reflective, mirror, and transparent conductive properties. Furthermore, advancements in coating technologies, including chemical vapor deposition (CVD) and atomic layer deposition (ALD), are enabling the creation of more durable, efficient, and customized coatings, further boosting market growth. The Asia-Pacific region, particularly China and India, is expected to be a significant growth engine due to burgeoning electronics manufacturing and increasing investments in infrastructure development.
However, the market is not without challenges. The high initial investment costs associated with advanced coating technologies can pose a barrier to entry for smaller players. Furthermore, stringent regulatory standards regarding environmental impact and material safety can influence production costs and market dynamics. Despite these constraints, the long-term outlook for the optical coatings market remains positive. The continuous innovation in materials science and the expanding applications across various industries will likely drive sustained market growth throughout the forecast period. Specific segments like anti-reflective coatings for displays and mirror coatings for solar energy applications are anticipated to demonstrate particularly strong growth in the coming years. The competitive landscape is characterized by both established players and emerging innovative companies, leading to continuous advancements and price competition.
Optical Coatings Industry Market Report: 2019-2033
This comprehensive report provides an in-depth analysis of the Optical Coatings Industry, offering invaluable insights for stakeholders, investors, and industry professionals. With a focus on market dynamics, leading players, and future trends, this report covers the period from 2019 to 2033, with a base year of 2025 and a forecast period of 2025-2033. The report analyzes key segments including Product Types (Optical Filter Coatings, Anti-reflective Coatings, Transparent Conductive Coatings, Mirror Coatings (High Reflective), Beam Splitter Coatings, and Other Product Types), Technologies (Chemical Vapor Deposition, Ion-beam Sputtering, Plasma Sputtering, Atomic Layer Deposition, Sub-wavelength Structured Surfaces), and End-user Industries (Aerospace and Defense, Electronics and Semiconductors, Telecommunications, Healthcare, Solar, Automotive, and Other End-user Industries). The market size is estimated to be in the Billions of USD range. Key players such as Nippon Sheet Glass Co Ltd, 3M, and Zeiss International are analyzed extensively.
Optical Coatings Industry Market Dynamics & Concentration
The Optical Coatings industry exhibits a moderately concentrated market structure, with a few major players holding significant market share. The global market size in 2024 was estimated at xx Million USD. However, the presence of numerous smaller, specialized companies fosters innovation and competition. Market concentration is influenced by factors like technological advancements, economies of scale, and mergers & acquisitions (M&A) activity. The industry is driven by continuous innovation in coating materials and deposition techniques, seeking to improve performance metrics such as durability, transmission, and reflection characteristics. Stringent regulatory frameworks, particularly concerning environmental impact and safety, significantly shape industry practices. Product substitutes, such as alternative materials or surface treatments, present competitive pressures. End-user trends, particularly the increasing demand for advanced coatings in high-growth sectors like electronics and renewable energy, significantly impact market growth.
M&A activity plays a crucial role in shaping the industry landscape. While precise M&A deal counts are xx for the study period, these transactions often lead to increased market consolidation, expanded product portfolios, and enhanced technological capabilities. For example, the acquisition of Kogent Surgical and Katalyst Surgical by Carl Zeiss Meditec in April 2022 strengthened their market position. The market share of the top 5 players in 2024 is estimated at xx%.
Optical Coatings Industry Industry Trends & Analysis
The Optical Coatings industry is characterized by robust growth driven by increasing demand across diverse sectors. The compound annual growth rate (CAGR) during the forecast period (2025-2033) is projected at xx%. This growth is fueled by several factors, including: advancements in coating technologies enabling enhanced performance characteristics, growing demand from high-growth end-use industries like electronics and renewable energy, and the increasing adoption of optical coatings in consumer electronics. Technological disruptions, such as the development of novel deposition techniques and materials with improved properties, are constantly reshaping the competitive landscape. Consumer preferences are shifting towards high-performance, durable, and environmentally friendly coatings. Competitive dynamics are characterized by intense rivalry among established players and the emergence of innovative startups. Market penetration of advanced coatings, such as those incorporating nanotechnology, is steadily increasing, with xx% penetration in the electronics sector by 2024.
Leading Markets & Segments in Optical Coatings Industry
The Electronics and Semiconductors sector represents the dominant end-user industry for optical coatings, followed closely by Aerospace and Defense. Within product types, Anti-reflective coatings and Optical Filter Coatings hold the largest market share, owing to their widespread applications across various industries. The Asia-Pacific region leads in market share due to rapid technological advancement, substantial investments in manufacturing, and strong growth in end-user industries.
Key Drivers for Dominant Regions/Segments:
- Asia-Pacific: High economic growth, substantial investments in semiconductor manufacturing, and increasing adoption of consumer electronics.
- Electronics and Semiconductors: The relentless miniaturization of electronic devices and increasing demand for improved performance and efficiency.
- Anti-reflective coatings: Widespread use in displays, lenses, and solar panels.
The dominance analysis indicates a strong correlation between technological advancements, economic growth, and market penetration across leading segments and regions.
Optical Coatings Industry Product Developments
Recent product innovations focus on enhancing durability, scratch resistance, and environmental stability. New coating materials and deposition techniques enable superior performance and expand application possibilities. These developments leverage nanotechnology and advanced materials science to create coatings with tailored optical properties, such as enhanced transmission, reflection, and polarization control. This translates to a significant competitive advantage for companies that can offer customized solutions tailored to specific industry needs. The market is also witnessing the emergence of eco-friendly coatings to cater to growing environmental concerns.
Key Drivers of Optical Coatings Industry Growth
The Optical Coatings industry's growth is fueled by technological advancements, economic factors, and supportive regulatory frameworks. Technological breakthroughs in deposition techniques (like ALD) and new materials lead to improved coating performance. Strong economic growth in key end-use sectors like electronics and renewable energy drives demand. Government policies promoting clean energy and advanced manufacturing further support the industry's expansion. For instance, government incentives for solar energy adoption directly boost the demand for high-performance solar coatings.
Challenges in the Optical Coatings Industry Market
The industry faces challenges, including stringent environmental regulations increasing production costs and complexities. Supply chain disruptions can impact material availability and production timelines. Intense competition from both established players and new entrants necessitates continuous innovation and cost optimization. The impact of these factors on profitability is estimated at xx% reduction in margin for some market segments in 2024.
Emerging Opportunities in Optical Coatings Industry
Emerging opportunities stem from technological advancements like advanced metamaterials and the development of flexible and transparent electronics. Strategic partnerships between coating manufacturers and end-users facilitate the development of customized solutions, leading to significant market expansion. Moreover, the growing demand for augmented and virtual reality (AR/VR) technologies further stimulates the need for high-performance optical coatings. The development of cost-effective, high-performance coatings will be a key catalyst.
Leading Players in the Optical Coatings Industry Sector
- Nippon Sheet Glass Co Ltd
- Optical Coatings Technologies
- Sigmakoki Co Ltd
- Schott AG
- 3M
- PPG Industries Inc
- Quantum Coating
- Zeiss International
- Edmund Optics Inc
- DuPont
- Inrad Optics
- Artemis Optical Ltd
- Accucoat Inc
- Materion Corporation
- Abrisa Technologies
- Reynard Corporation
- Newport Corporation
- Zygo Corporation
*List Not Exhaustive
Key Milestones in Optical Coatings Industry Industry
- April 2022: Imatest partnered with Edmund Optics Inc., enhancing software accessibility for imaging performance evaluation.
- April 2022: Edmund Optics Inc. opened a new facility in New Jersey, expanding its capabilities and services.
- April 2022: Carl Zeiss Meditec acquired Kogent Surgical, LLC and Katalyst Surgical, LLC, strengthening its surgical solutions portfolio. These milestones showcase industry expansion and collaboration, impacting market dynamics through enhanced product offerings and broadened reach.
Strategic Outlook for Optical Coatings Industry Market
The future of the Optical Coatings industry is bright, driven by continuous technological innovation, expanding end-use applications, and supportive government policies. Strategic partnerships and collaborations will play a crucial role in driving future growth. Companies that focus on developing sustainable and cost-effective solutions will be best positioned to capitalize on emerging market opportunities. The industry's long-term potential is significant, with growth expected to continue across various segments and geographical regions.
Optical Coatings Industry Segmentation
-
1. Product Type
- 1.1. Optical Filter Coatings
- 1.2. Anti-reflective Coatings
- 1.3. Transparent Conductive Coatings
- 1.4. Mirror Coatings (High Reflective)
- 1.5. Beam Splitter Coatings
- 1.6. Other Pr
-
2. Technology
- 2.1. Chemical Vapor Deposition
- 2.2. Ion-beam Sputtering
- 2.3. Plasma Sputtering
- 2.4. Atomic Layer Deposition
- 2.5. Sub-wavelength Structured Surfaces
-
3. End-user Industry
- 3.1. Aerospace and Defense
- 3.2. Electronics and Semiconductors
- 3.3. Telecommunications
- 3.4. Healthcare
- 3.5. Solar
- 3.6. Automotive
- 3.7. Other En
Optical Coatings Industry Segmentation By Geography
-
1. Asia Pacific
- 1.1. China
- 1.2. India
- 1.3. Japan
- 1.4. South Korea
- 1.5. Malaysia
- 1.6. Thailand
- 1.7. Indonesia
- 1.8. Vietnam
- 1.9. Rest of Asia Pacific
-
2. North America
- 2.1. United States
- 2.2. Canada
- 2.3. Mexico
-
3. Europe
- 3.1. Germany
- 3.2. United Kingdom
- 3.3. Italy
- 3.4. France
- 3.5. Spain
- 3.6. Nordic Countries
- 3.7. Turkey
- 3.8. Russia
- 3.9. Rest of Europe
-
4. South America
- 4.1. Brazil
- 4.2. Argentina
- 4.3. Colombia
- 4.4. Rest of South America
-
5. Middle East and Africa
- 5.1. Saudi Arabia
- 5.2. South Africa
- 5.3. Qatar
- 5.4. United Arab Emirates
- 5.5. Nigeria
- 5.6. Egypt
- 5.7. Rest of Middle East and Africa
Optical Coatings Industry REPORT HIGHLIGHTS
| Aspects | Details |
|---|---|
| Study Period | 2019-2033 |
| Base Year | 2024 |
| Estimated Year | 2025 |
| Forecast Period | 2025-2033 |
| Historical Period | 2019-2024 |
| Growth Rate | CAGR of 6.17% from 2019-2033 |
| Segmentation |
|
Table of Contents
- 1. Introduction
- 1.1. Research Scope
- 1.2. Market Segmentation
- 1.3. Research Methodology
- 1.4. Definitions and Assumptions
- 2. Executive Summary
- 2.1. Introduction
- 3. Market Dynamics
- 3.1. Introduction
- 3.2. Market Drivers
- 3.2.1. Growing Demand from the Solar Industry; Technological Advancements in the Optical Coatings Process
- 3.3. Market Restrains
- 3.3.1. High Costs and Some Limiting Properties of Optical Coatings
- 3.4. Market Trends
- 3.4.1. The Electronics and Semiconductors Segment is Expected to Dominate the Market
- 4. Market Factor Analysis
- 4.1. Porters Five Forces
- 4.2. Supply/Value Chain
- 4.3. PESTEL analysis
- 4.4. Market Entropy
- 4.5. Patent/Trademark Analysis
- 5. Global Optical Coatings Industry Analysis, Insights and Forecast, 2019-2031
- 5.1. Market Analysis, Insights and Forecast - by Product Type
- 5.1.1. Optical Filter Coatings
- 5.1.2. Anti-reflective Coatings
- 5.1.3. Transparent Conductive Coatings
- 5.1.4. Mirror Coatings (High Reflective)
- 5.1.5. Beam Splitter Coatings
- 5.1.6. Other Pr
- 5.2. Market Analysis, Insights and Forecast - by Technology
- 5.2.1. Chemical Vapor Deposition
- 5.2.2. Ion-beam Sputtering
- 5.2.3. Plasma Sputtering
- 5.2.4. Atomic Layer Deposition
- 5.2.5. Sub-wavelength Structured Surfaces
- 5.3. Market Analysis, Insights and Forecast - by End-user Industry
- 5.3.1. Aerospace and Defense
- 5.3.2. Electronics and Semiconductors
- 5.3.3. Telecommunications
- 5.3.4. Healthcare
- 5.3.5. Solar
- 5.3.6. Automotive
- 5.3.7. Other En
- 5.4. Market Analysis, Insights and Forecast - by Region
- 5.4.1. Asia Pacific
- 5.4.2. North America
- 5.4.3. Europe
- 5.4.4. South America
- 5.4.5. Middle East and Africa
- 5.1. Market Analysis, Insights and Forecast - by Product Type
- 6. Asia Pacific Optical Coatings Industry Analysis, Insights and Forecast, 2019-2031
- 6.1. Market Analysis, Insights and Forecast - by Product Type
- 6.1.1. Optical Filter Coatings
- 6.1.2. Anti-reflective Coatings
- 6.1.3. Transparent Conductive Coatings
- 6.1.4. Mirror Coatings (High Reflective)
- 6.1.5. Beam Splitter Coatings
- 6.1.6. Other Pr
- 6.2. Market Analysis, Insights and Forecast - by Technology
- 6.2.1. Chemical Vapor Deposition
- 6.2.2. Ion-beam Sputtering
- 6.2.3. Plasma Sputtering
- 6.2.4. Atomic Layer Deposition
- 6.2.5. Sub-wavelength Structured Surfaces
- 6.3. Market Analysis, Insights and Forecast - by End-user Industry
- 6.3.1. Aerospace and Defense
- 6.3.2. Electronics and Semiconductors
- 6.3.3. Telecommunications
- 6.3.4. Healthcare
- 6.3.5. Solar
- 6.3.6. Automotive
- 6.3.7. Other En
- 6.1. Market Analysis, Insights and Forecast - by Product Type
- 7. North America Optical Coatings Industry Analysis, Insights and Forecast, 2019-2031
- 7.1. Market Analysis, Insights and Forecast - by Product Type
- 7.1.1. Optical Filter Coatings
- 7.1.2. Anti-reflective Coatings
- 7.1.3. Transparent Conductive Coatings
- 7.1.4. Mirror Coatings (High Reflective)
- 7.1.5. Beam Splitter Coatings
- 7.1.6. Other Pr
- 7.2. Market Analysis, Insights and Forecast - by Technology
- 7.2.1. Chemical Vapor Deposition
- 7.2.2. Ion-beam Sputtering
- 7.2.3. Plasma Sputtering
- 7.2.4. Atomic Layer Deposition
- 7.2.5. Sub-wavelength Structured Surfaces
- 7.3. Market Analysis, Insights and Forecast - by End-user Industry
- 7.3.1. Aerospace and Defense
- 7.3.2. Electronics and Semiconductors
- 7.3.3. Telecommunications
- 7.3.4. Healthcare
- 7.3.5. Solar
- 7.3.6. Automotive
- 7.3.7. Other En
- 7.1. Market Analysis, Insights and Forecast - by Product Type
- 8. Europe Optical Coatings Industry Analysis, Insights and Forecast, 2019-2031
- 8.1. Market Analysis, Insights and Forecast - by Product Type
- 8.1.1. Optical Filter Coatings
- 8.1.2. Anti-reflective Coatings
- 8.1.3. Transparent Conductive Coatings
- 8.1.4. Mirror Coatings (High Reflective)
- 8.1.5. Beam Splitter Coatings
- 8.1.6. Other Pr
- 8.2. Market Analysis, Insights and Forecast - by Technology
- 8.2.1. Chemical Vapor Deposition
- 8.2.2. Ion-beam Sputtering
- 8.2.3. Plasma Sputtering
- 8.2.4. Atomic Layer Deposition
- 8.2.5. Sub-wavelength Structured Surfaces
- 8.3. Market Analysis, Insights and Forecast - by End-user Industry
- 8.3.1. Aerospace and Defense
- 8.3.2. Electronics and Semiconductors
- 8.3.3. Telecommunications
- 8.3.4. Healthcare
- 8.3.5. Solar
- 8.3.6. Automotive
- 8.3.7. Other En
- 8.1. Market Analysis, Insights and Forecast - by Product Type
- 9. South America Optical Coatings Industry Analysis, Insights and Forecast, 2019-2031
- 9.1. Market Analysis, Insights and Forecast - by Product Type
- 9.1.1. Optical Filter Coatings
- 9.1.2. Anti-reflective Coatings
- 9.1.3. Transparent Conductive Coatings
- 9.1.4. Mirror Coatings (High Reflective)
- 9.1.5. Beam Splitter Coatings
- 9.1.6. Other Pr
- 9.2. Market Analysis, Insights and Forecast - by Technology
- 9.2.1. Chemical Vapor Deposition
- 9.2.2. Ion-beam Sputtering
- 9.2.3. Plasma Sputtering
- 9.2.4. Atomic Layer Deposition
- 9.2.5. Sub-wavelength Structured Surfaces
- 9.3. Market Analysis, Insights and Forecast - by End-user Industry
- 9.3.1. Aerospace and Defense
- 9.3.2. Electronics and Semiconductors
- 9.3.3. Telecommunications
- 9.3.4. Healthcare
- 9.3.5. Solar
- 9.3.6. Automotive
- 9.3.7. Other En
- 9.1. Market Analysis, Insights and Forecast - by Product Type
- 10. Middle East and Africa Optical Coatings Industry Analysis, Insights and Forecast, 2019-2031
- 10.1. Market Analysis, Insights and Forecast - by Product Type
- 10.1.1. Optical Filter Coatings
- 10.1.2. Anti-reflective Coatings
- 10.1.3. Transparent Conductive Coatings
- 10.1.4. Mirror Coatings (High Reflective)
- 10.1.5. Beam Splitter Coatings
- 10.1.6. Other Pr
- 10.2. Market Analysis, Insights and Forecast - by Technology
- 10.2.1. Chemical Vapor Deposition
- 10.2.2. Ion-beam Sputtering
- 10.2.3. Plasma Sputtering
- 10.2.4. Atomic Layer Deposition
- 10.2.5. Sub-wavelength Structured Surfaces
- 10.3. Market Analysis, Insights and Forecast - by End-user Industry
- 10.3.1. Aerospace and Defense
- 10.3.2. Electronics and Semiconductors
- 10.3.3. Telecommunications
- 10.3.4. Healthcare
- 10.3.5. Solar
- 10.3.6. Automotive
- 10.3.7. Other En
- 10.1. Market Analysis, Insights and Forecast - by Product Type
- 11. Asia Pacific Optical Coatings Industry Analysis, Insights and Forecast, 2019-2031
- 11.1. Market Analysis, Insights and Forecast - By Country/Sub-region
- 11.1.1 China
- 11.1.2 India
- 11.1.3 Japan
- 11.1.4 South Korea
- 11.1.5 Rest of Asia Pacific
- 12. North America Optical Coatings Industry Analysis, Insights and Forecast, 2019-2031
- 12.1. Market Analysis, Insights and Forecast - By Country/Sub-region
- 12.1.1 United States
- 12.1.2 Canada
- 12.1.3 Mexico
- 13. Europe Optical Coatings Industry Analysis, Insights and Forecast, 2019-2031
- 13.1. Market Analysis, Insights and Forecast - By Country/Sub-region
- 13.1.1 Germany
- 13.1.2 United Kingdom
- 13.1.3 Italy
- 13.1.4 France
- 13.1.5 Rest of Europe
- 14. South America Optical Coatings Industry Analysis, Insights and Forecast, 2019-2031
- 14.1. Market Analysis, Insights and Forecast - By Country/Sub-region
- 14.1.1 Brazil
- 14.1.2 Argentina
- 14.1.3 Rest of South America
- 15. Middle East and Africa Optical Coatings Industry Analysis, Insights and Forecast, 2019-2031
- 15.1. Market Analysis, Insights and Forecast - By Country/Sub-region
- 15.1.1 Saudi Arabia
- 15.1.2 South Africa
- 15.1.3 Rest of Middle East and Africa
- 16. Competitive Analysis
- 16.1. Global Market Share Analysis 2024
- 16.2. Company Profiles
- 16.2.1 Nippon Sheet Glass Co Ltd
- 16.2.1.1. Overview
- 16.2.1.2. Products
- 16.2.1.3. SWOT Analysis
- 16.2.1.4. Recent Developments
- 16.2.1.5. Financials (Based on Availability)
- 16.2.2 Optical Coatings Technologies
- 16.2.2.1. Overview
- 16.2.2.2. Products
- 16.2.2.3. SWOT Analysis
- 16.2.2.4. Recent Developments
- 16.2.2.5. Financials (Based on Availability)
- 16.2.3 Sigmakoki Co Ltd
- 16.2.3.1. Overview
- 16.2.3.2. Products
- 16.2.3.3. SWOT Analysis
- 16.2.3.4. Recent Developments
- 16.2.3.5. Financials (Based on Availability)
- 16.2.4 Schott AG
- 16.2.4.1. Overview
- 16.2.4.2. Products
- 16.2.4.3. SWOT Analysis
- 16.2.4.4. Recent Developments
- 16.2.4.5. Financials (Based on Availability)
- 16.2.5 3M
- 16.2.5.1. Overview
- 16.2.5.2. Products
- 16.2.5.3. SWOT Analysis
- 16.2.5.4. Recent Developments
- 16.2.5.5. Financials (Based on Availability)
- 16.2.6 PPG Industries Inc
- 16.2.6.1. Overview
- 16.2.6.2. Products
- 16.2.6.3. SWOT Analysis
- 16.2.6.4. Recent Developments
- 16.2.6.5. Financials (Based on Availability)
- 16.2.7 Quantum Coating
- 16.2.7.1. Overview
- 16.2.7.2. Products
- 16.2.7.3. SWOT Analysis
- 16.2.7.4. Recent Developments
- 16.2.7.5. Financials (Based on Availability)
- 16.2.8 Zeiss International
- 16.2.8.1. Overview
- 16.2.8.2. Products
- 16.2.8.3. SWOT Analysis
- 16.2.8.4. Recent Developments
- 16.2.8.5. Financials (Based on Availability)
- 16.2.9 Edmund Optics Inc
- 16.2.9.1. Overview
- 16.2.9.2. Products
- 16.2.9.3. SWOT Analysis
- 16.2.9.4. Recent Developments
- 16.2.9.5. Financials (Based on Availability)
- 16.2.10 DuPont
- 16.2.10.1. Overview
- 16.2.10.2. Products
- 16.2.10.3. SWOT Analysis
- 16.2.10.4. Recent Developments
- 16.2.10.5. Financials (Based on Availability)
- 16.2.11 Inrad Optics
- 16.2.11.1. Overview
- 16.2.11.2. Products
- 16.2.11.3. SWOT Analysis
- 16.2.11.4. Recent Developments
- 16.2.11.5. Financials (Based on Availability)
- 16.2.12 Artemis Optical Ltd
- 16.2.12.1. Overview
- 16.2.12.2. Products
- 16.2.12.3. SWOT Analysis
- 16.2.12.4. Recent Developments
- 16.2.12.5. Financials (Based on Availability)
- 16.2.13 Accucoat Inc
- 16.2.13.1. Overview
- 16.2.13.2. Products
- 16.2.13.3. SWOT Analysis
- 16.2.13.4. Recent Developments
- 16.2.13.5. Financials (Based on Availability)
- 16.2.14 Materion Corporation
- 16.2.14.1. Overview
- 16.2.14.2. Products
- 16.2.14.3. SWOT Analysis
- 16.2.14.4. Recent Developments
- 16.2.14.5. Financials (Based on Availability)
- 16.2.15 Abrisa Technologies
- 16.2.15.1. Overview
- 16.2.15.2. Products
- 16.2.15.3. SWOT Analysis
- 16.2.15.4. Recent Developments
- 16.2.15.5. Financials (Based on Availability)
- 16.2.16 Reynard Corporation
- 16.2.16.1. Overview
- 16.2.16.2. Products
- 16.2.16.3. SWOT Analysis
- 16.2.16.4. Recent Developments
- 16.2.16.5. Financials (Based on Availability)
- 16.2.17 Newport Corporation
- 16.2.17.1. Overview
- 16.2.17.2. Products
- 16.2.17.3. SWOT Analysis
- 16.2.17.4. Recent Developments
- 16.2.17.5. Financials (Based on Availability)
- 16.2.18 Zygo Corporation*List Not Exhaustive
- 16.2.18.1. Overview
- 16.2.18.2. Products
- 16.2.18.3. SWOT Analysis
- 16.2.18.4. Recent Developments
- 16.2.18.5. Financials (Based on Availability)
- 16.2.1 Nippon Sheet Glass Co Ltd
List of Figures
- Figure 1: Global Optical Coatings Industry Revenue Breakdown (Million, %) by Region 2024 & 2032
- Figure 2: Asia Pacific Optical Coatings Industry Revenue (Million), by Country 2024 & 2032
- Figure 3: Asia Pacific Optical Coatings Industry Revenue Share (%), by Country 2024 & 2032
- Figure 4: North America Optical Coatings Industry Revenue (Million), by Country 2024 & 2032
- Figure 5: North America Optical Coatings Industry Revenue Share (%), by Country 2024 & 2032
- Figure 6: Europe Optical Coatings Industry Revenue (Million), by Country 2024 & 2032
- Figure 7: Europe Optical Coatings Industry Revenue Share (%), by Country 2024 & 2032
- Figure 8: South America Optical Coatings Industry Revenue (Million), by Country 2024 & 2032
- Figure 9: South America Optical Coatings Industry Revenue Share (%), by Country 2024 & 2032
- Figure 10: Middle East and Africa Optical Coatings Industry Revenue (Million), by Country 2024 & 2032
- Figure 11: Middle East and Africa Optical Coatings Industry Revenue Share (%), by Country 2024 & 2032
- Figure 12: Asia Pacific Optical Coatings Industry Revenue (Million), by Product Type 2024 & 2032
- Figure 13: Asia Pacific Optical Coatings Industry Revenue Share (%), by Product Type 2024 & 2032
- Figure 14: Asia Pacific Optical Coatings Industry Revenue (Million), by Technology 2024 & 2032
- Figure 15: Asia Pacific Optical Coatings Industry Revenue Share (%), by Technology 2024 & 2032
- Figure 16: Asia Pacific Optical Coatings Industry Revenue (Million), by End-user Industry 2024 & 2032
- Figure 17: Asia Pacific Optical Coatings Industry Revenue Share (%), by End-user Industry 2024 & 2032
- Figure 18: Asia Pacific Optical Coatings Industry Revenue (Million), by Country 2024 & 2032
- Figure 19: Asia Pacific Optical Coatings Industry Revenue Share (%), by Country 2024 & 2032
- Figure 20: North America Optical Coatings Industry Revenue (Million), by Product Type 2024 & 2032
- Figure 21: North America Optical Coatings Industry Revenue Share (%), by Product Type 2024 & 2032
- Figure 22: North America Optical Coatings Industry Revenue (Million), by Technology 2024 & 2032
- Figure 23: North America Optical Coatings Industry Revenue Share (%), by Technology 2024 & 2032
- Figure 24: North America Optical Coatings Industry Revenue (Million), by End-user Industry 2024 & 2032
- Figure 25: North America Optical Coatings Industry Revenue Share (%), by End-user Industry 2024 & 2032
- Figure 26: North America Optical Coatings Industry Revenue (Million), by Country 2024 & 2032
- Figure 27: North America Optical Coatings Industry Revenue Share (%), by Country 2024 & 2032
- Figure 28: Europe Optical Coatings Industry Revenue (Million), by Product Type 2024 & 2032
- Figure 29: Europe Optical Coatings Industry Revenue Share (%), by Product Type 2024 & 2032
- Figure 30: Europe Optical Coatings Industry Revenue (Million), by Technology 2024 & 2032
- Figure 31: Europe Optical Coatings Industry Revenue Share (%), by Technology 2024 & 2032
- Figure 32: Europe Optical Coatings Industry Revenue (Million), by End-user Industry 2024 & 2032
- Figure 33: Europe Optical Coatings Industry Revenue Share (%), by End-user Industry 2024 & 2032
- Figure 34: Europe Optical Coatings Industry Revenue (Million), by Country 2024 & 2032
- Figure 35: Europe Optical Coatings Industry Revenue Share (%), by Country 2024 & 2032
- Figure 36: South America Optical Coatings Industry Revenue (Million), by Product Type 2024 & 2032
- Figure 37: South America Optical Coatings Industry Revenue Share (%), by Product Type 2024 & 2032
- Figure 38: South America Optical Coatings Industry Revenue (Million), by Technology 2024 & 2032
- Figure 39: South America Optical Coatings Industry Revenue Share (%), by Technology 2024 & 2032
- Figure 40: South America Optical Coatings Industry Revenue (Million), by End-user Industry 2024 & 2032
- Figure 41: South America Optical Coatings Industry Revenue Share (%), by End-user Industry 2024 & 2032
- Figure 42: South America Optical Coatings Industry Revenue (Million), by Country 2024 & 2032
- Figure 43: South America Optical Coatings Industry Revenue Share (%), by Country 2024 & 2032
- Figure 44: Middle East and Africa Optical Coatings Industry Revenue (Million), by Product Type 2024 & 2032
- Figure 45: Middle East and Africa Optical Coatings Industry Revenue Share (%), by Product Type 2024 & 2032
- Figure 46: Middle East and Africa Optical Coatings Industry Revenue (Million), by Technology 2024 & 2032
- Figure 47: Middle East and Africa Optical Coatings Industry Revenue Share (%), by Technology 2024 & 2032
- Figure 48: Middle East and Africa Optical Coatings Industry Revenue (Million), by End-user Industry 2024 & 2032
- Figure 49: Middle East and Africa Optical Coatings Industry Revenue Share (%), by End-user Industry 2024 & 2032
- Figure 50: Middle East and Africa Optical Coatings Industry Revenue (Million), by Country 2024 & 2032
- Figure 51: Middle East and Africa Optical Coatings Industry Revenue Share (%), by Country 2024 & 2032
List of Tables
- Table 1: Global Optical Coatings Industry Revenue Million Forecast, by Region 2019 & 2032
- Table 2: Global Optical Coatings Industry Revenue Million Forecast, by Product Type 2019 & 2032
- Table 3: Global Optical Coatings Industry Revenue Million Forecast, by Technology 2019 & 2032
- Table 4: Global Optical Coatings Industry Revenue Million Forecast, by End-user Industry 2019 & 2032
- Table 5: Global Optical Coatings Industry Revenue Million Forecast, by Region 2019 & 2032
- Table 6: Global Optical Coatings Industry Revenue Million Forecast, by Country 2019 & 2032
- Table 7: China Optical Coatings Industry Revenue (Million) Forecast, by Application 2019 & 2032
- Table 8: India Optical Coatings Industry Revenue (Million) Forecast, by Application 2019 & 2032
- Table 9: Japan Optical Coatings Industry Revenue (Million) Forecast, by Application 2019 & 2032
- Table 10: South Korea Optical Coatings Industry Revenue (Million) Forecast, by Application 2019 & 2032
- Table 11: Rest of Asia Pacific Optical Coatings Industry Revenue (Million) Forecast, by Application 2019 & 2032
- Table 12: Global Optical Coatings Industry Revenue Million Forecast, by Country 2019 & 2032
- Table 13: United States Optical Coatings Industry Revenue (Million) Forecast, by Application 2019 & 2032
- Table 14: Canada Optical Coatings Industry Revenue (Million) Forecast, by Application 2019 & 2032
- Table 15: Mexico Optical Coatings Industry Revenue (Million) Forecast, by Application 2019 & 2032
- Table 16: Global Optical Coatings Industry Revenue Million Forecast, by Country 2019 & 2032
- Table 17: Germany Optical Coatings Industry Revenue (Million) Forecast, by Application 2019 & 2032
- Table 18: United Kingdom Optical Coatings Industry Revenue (Million) Forecast, by Application 2019 & 2032
- Table 19: Italy Optical Coatings Industry Revenue (Million) Forecast, by Application 2019 & 2032
- Table 20: France Optical Coatings Industry Revenue (Million) Forecast, by Application 2019 & 2032
- Table 21: Rest of Europe Optical Coatings Industry Revenue (Million) Forecast, by Application 2019 & 2032
- Table 22: Global Optical Coatings Industry Revenue Million Forecast, by Country 2019 & 2032
- Table 23: Brazil Optical Coatings Industry Revenue (Million) Forecast, by Application 2019 & 2032
- Table 24: Argentina Optical Coatings Industry Revenue (Million) Forecast, by Application 2019 & 2032
- Table 25: Rest of South America Optical Coatings Industry Revenue (Million) Forecast, by Application 2019 & 2032
- Table 26: Global Optical Coatings Industry Revenue Million Forecast, by Country 2019 & 2032
- Table 27: Saudi Arabia Optical Coatings Industry Revenue (Million) Forecast, by Application 2019 & 2032
- Table 28: South Africa Optical Coatings Industry Revenue (Million) Forecast, by Application 2019 & 2032
- Table 29: Rest of Middle East and Africa Optical Coatings Industry Revenue (Million) Forecast, by Application 2019 & 2032
- Table 30: Global Optical Coatings Industry Revenue Million Forecast, by Product Type 2019 & 2032
- Table 31: Global Optical Coatings Industry Revenue Million Forecast, by Technology 2019 & 2032
- Table 32: Global Optical Coatings Industry Revenue Million Forecast, by End-user Industry 2019 & 2032
- Table 33: Global Optical Coatings Industry Revenue Million Forecast, by Country 2019 & 2032
- Table 34: China Optical Coatings Industry Revenue (Million) Forecast, by Application 2019 & 2032
- Table 35: India Optical Coatings Industry Revenue (Million) Forecast, by Application 2019 & 2032
- Table 36: Japan Optical Coatings Industry Revenue (Million) Forecast, by Application 2019 & 2032
- Table 37: South Korea Optical Coatings Industry Revenue (Million) Forecast, by Application 2019 & 2032
- Table 38: Malaysia Optical Coatings Industry Revenue (Million) Forecast, by Application 2019 & 2032
- Table 39: Thailand Optical Coatings Industry Revenue (Million) Forecast, by Application 2019 & 2032
- Table 40: Indonesia Optical Coatings Industry Revenue (Million) Forecast, by Application 2019 & 2032
- Table 41: Vietnam Optical Coatings Industry Revenue (Million) Forecast, by Application 2019 & 2032
- Table 42: Rest of Asia Pacific Optical Coatings Industry Revenue (Million) Forecast, by Application 2019 & 2032
- Table 43: Global Optical Coatings Industry Revenue Million Forecast, by Product Type 2019 & 2032
- Table 44: Global Optical Coatings Industry Revenue Million Forecast, by Technology 2019 & 2032
- Table 45: Global Optical Coatings Industry Revenue Million Forecast, by End-user Industry 2019 & 2032
- Table 46: Global Optical Coatings Industry Revenue Million Forecast, by Country 2019 & 2032
- Table 47: United States Optical Coatings Industry Revenue (Million) Forecast, by Application 2019 & 2032
- Table 48: Canada Optical Coatings Industry Revenue (Million) Forecast, by Application 2019 & 2032
- Table 49: Mexico Optical Coatings Industry Revenue (Million) Forecast, by Application 2019 & 2032
- Table 50: Global Optical Coatings Industry Revenue Million Forecast, by Product Type 2019 & 2032
- Table 51: Global Optical Coatings Industry Revenue Million Forecast, by Technology 2019 & 2032
- Table 52: Global Optical Coatings Industry Revenue Million Forecast, by End-user Industry 2019 & 2032
- Table 53: Global Optical Coatings Industry Revenue Million Forecast, by Country 2019 & 2032
- Table 54: Germany Optical Coatings Industry Revenue (Million) Forecast, by Application 2019 & 2032
- Table 55: United Kingdom Optical Coatings Industry Revenue (Million) Forecast, by Application 2019 & 2032
- Table 56: Italy Optical Coatings Industry Revenue (Million) Forecast, by Application 2019 & 2032
- Table 57: France Optical Coatings Industry Revenue (Million) Forecast, by Application 2019 & 2032
- Table 58: Spain Optical Coatings Industry Revenue (Million) Forecast, by Application 2019 & 2032
- Table 59: Nordic Countries Optical Coatings Industry Revenue (Million) Forecast, by Application 2019 & 2032
- Table 60: Turkey Optical Coatings Industry Revenue (Million) Forecast, by Application 2019 & 2032
- Table 61: Russia Optical Coatings Industry Revenue (Million) Forecast, by Application 2019 & 2032
- Table 62: Rest of Europe Optical Coatings Industry Revenue (Million) Forecast, by Application 2019 & 2032
- Table 63: Global Optical Coatings Industry Revenue Million Forecast, by Product Type 2019 & 2032
- Table 64: Global Optical Coatings Industry Revenue Million Forecast, by Technology 2019 & 2032
- Table 65: Global Optical Coatings Industry Revenue Million Forecast, by End-user Industry 2019 & 2032
- Table 66: Global Optical Coatings Industry Revenue Million Forecast, by Country 2019 & 2032
- Table 67: Brazil Optical Coatings Industry Revenue (Million) Forecast, by Application 2019 & 2032
- Table 68: Argentina Optical Coatings Industry Revenue (Million) Forecast, by Application 2019 & 2032
- Table 69: Colombia Optical Coatings Industry Revenue (Million) Forecast, by Application 2019 & 2032
- Table 70: Rest of South America Optical Coatings Industry Revenue (Million) Forecast, by Application 2019 & 2032
- Table 71: Global Optical Coatings Industry Revenue Million Forecast, by Product Type 2019 & 2032
- Table 72: Global Optical Coatings Industry Revenue Million Forecast, by Technology 2019 & 2032
- Table 73: Global Optical Coatings Industry Revenue Million Forecast, by End-user Industry 2019 & 2032
- Table 74: Global Optical Coatings Industry Revenue Million Forecast, by Country 2019 & 2032
- Table 75: Saudi Arabia Optical Coatings Industry Revenue (Million) Forecast, by Application 2019 & 2032
- Table 76: South Africa Optical Coatings Industry Revenue (Million) Forecast, by Application 2019 & 2032
- Table 77: Qatar Optical Coatings Industry Revenue (Million) Forecast, by Application 2019 & 2032
- Table 78: United Arab Emirates Optical Coatings Industry Revenue (Million) Forecast, by Application 2019 & 2032
- Table 79: Nigeria Optical Coatings Industry Revenue (Million) Forecast, by Application 2019 & 2032
- Table 80: Egypt Optical Coatings Industry Revenue (Million) Forecast, by Application 2019 & 2032
- Table 81: Rest of Middle East and Africa Optical Coatings Industry Revenue (Million) Forecast, by Application 2019 & 2032
Frequently Asked Questions
1. What is the projected Compound Annual Growth Rate (CAGR) of the Optical Coatings Industry?
The projected CAGR is approximately 6.17%.
2. Which companies are prominent players in the Optical Coatings Industry?
Key companies in the market include Nippon Sheet Glass Co Ltd, Optical Coatings Technologies, Sigmakoki Co Ltd, Schott AG, 3M, PPG Industries Inc, Quantum Coating, Zeiss International, Edmund Optics Inc, DuPont, Inrad Optics, Artemis Optical Ltd, Accucoat Inc, Materion Corporation, Abrisa Technologies, Reynard Corporation, Newport Corporation, Zygo Corporation*List Not Exhaustive.
3. What are the main segments of the Optical Coatings Industry?
The market segments include Product Type, Technology, End-user Industry.
4. Can you provide details about the market size?
The market size is estimated to be USD 8.84 Million as of 2022.
5. What are some drivers contributing to market growth?
Growing Demand from the Solar Industry; Technological Advancements in the Optical Coatings Process.
6. What are the notable trends driving market growth?
The Electronics and Semiconductors Segment is Expected to Dominate the Market.
7. Are there any restraints impacting market growth?
High Costs and Some Limiting Properties of Optical Coatings.
8. Can you provide examples of recent developments in the market?
April 2022: Imatest announced a new partnership with Edmund Optics Inc. to enable its customers to buy Imatest software and charts via Edmund Optics' website seamlessly. Additionally, this partnership will allow Edmund Optics' imaging customers to easily acquire the tools needed to evaluate their imaging performance.
9. What pricing options are available for accessing the report?
Pricing options include single-user, multi-user, and enterprise licenses priced at USD 4750, USD 5250, and USD 8750 respectively.
10. Is the market size provided in terms of value or volume?
The market size is provided in terms of value, measured in Million.
11. Are there any specific market keywords associated with the report?
Yes, the market keyword associated with the report is "Optical Coatings Industry," which aids in identifying and referencing the specific market segment covered.
12. How do I determine which pricing option suits my needs best?
The pricing options vary based on user requirements and access needs. Individual users may opt for single-user licenses, while businesses requiring broader access may choose multi-user or enterprise licenses for cost-effective access to the report.
13. Are there any additional resources or data provided in the Optical Coatings Industry report?
While the report offers comprehensive insights, it's advisable to review the specific contents or supplementary materials provided to ascertain if additional resources or data are available.
14. How can I stay updated on further developments or reports in the Optical Coatings Industry?
To stay informed about further developments, trends, and reports in the Optical Coatings Industry, consider subscribing to industry newsletters, following relevant companies and organizations, or regularly checking reputable industry news sources and publications.
Methodology
Step 1 - Identification of Relevant Samples Size from Population Database


Step 2 - Approaches for Defining Global Market Size (Value, Volume* & Price*)

Note*: In applicable scenarios
Step 3 - Data Sources
Primary Research
- Web Analytics
- Survey Reports
- Research Institute
- Latest Research Reports
- Opinion Leaders
Secondary Research
- Annual Reports
- White Paper
- Latest Press Release
- Industry Association
- Paid Database
- Investor Presentations

Step 4 - Data Triangulation
Involves using different sources of information in order to increase the validity of a study
These sources are likely to be stakeholders in a program - participants, other researchers, program staff, other community members, and so on.
Then we put all data in single framework & apply various statistical tools to find out the dynamic on the market.
During the analysis stage, feedback from the stakeholder groups would be compared to determine areas of agreement as well as areas of divergence
