

Key Insights
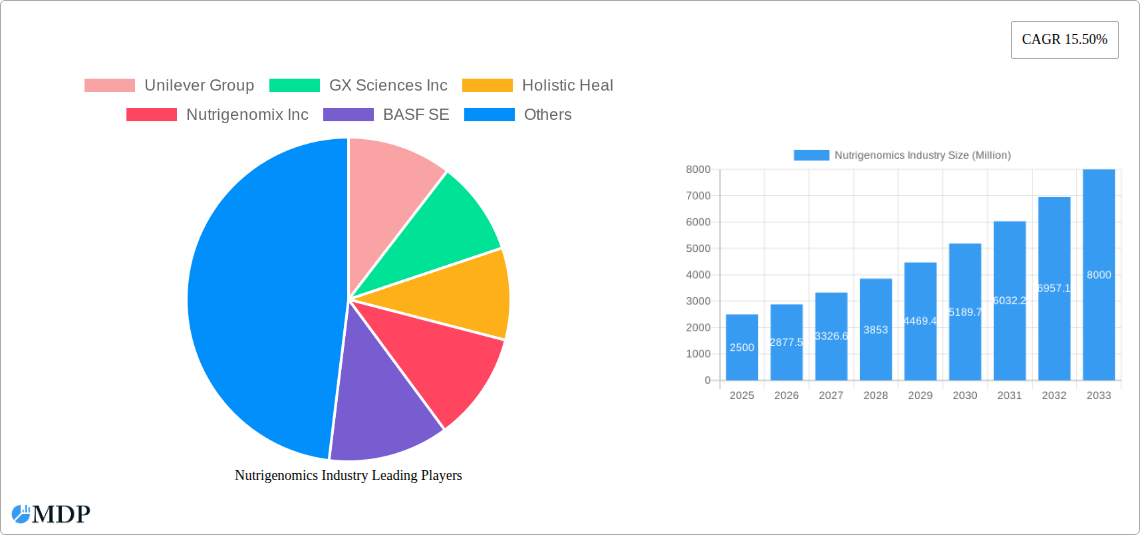
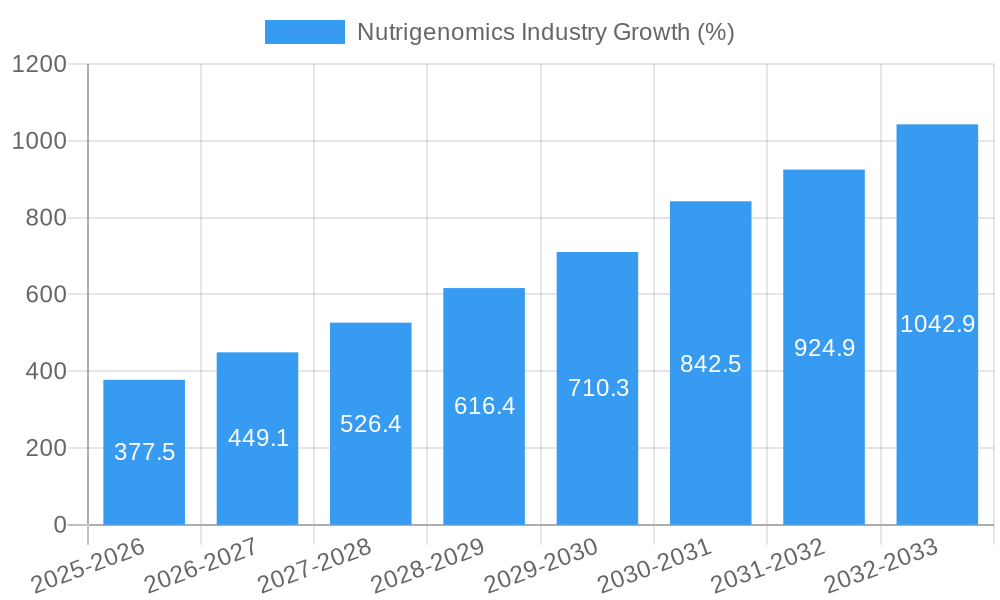
The nutrigenomics market, encompassing the study of how genes interact with nutrition, is experiencing robust growth, projected at a 15.50% CAGR from 2025 to 2033. This expansion is fueled by several key drivers. Firstly, the increasing prevalence of chronic diseases like cardiovascular diseases, obesity, and cancer is creating a significant demand for personalized nutrition strategies. Nutrigenomics offers a powerful approach to tailoring dietary recommendations based on an individual's genetic predisposition, leading to improved health outcomes and disease prevention. Secondly, advancements in genomics technology are reducing the cost and increasing the accessibility of genetic testing, making nutrigenomics-based interventions more feasible for a wider population. Finally, rising consumer awareness of the link between diet and genetics, coupled with a growing interest in personalized healthcare, is driving market adoption. Major players like Unilever, BASF, and Danone are investing heavily in research and development, further propelling market growth. While data privacy concerns and the need for standardized guidelines represent potential restraints, the overall market outlook remains positive.
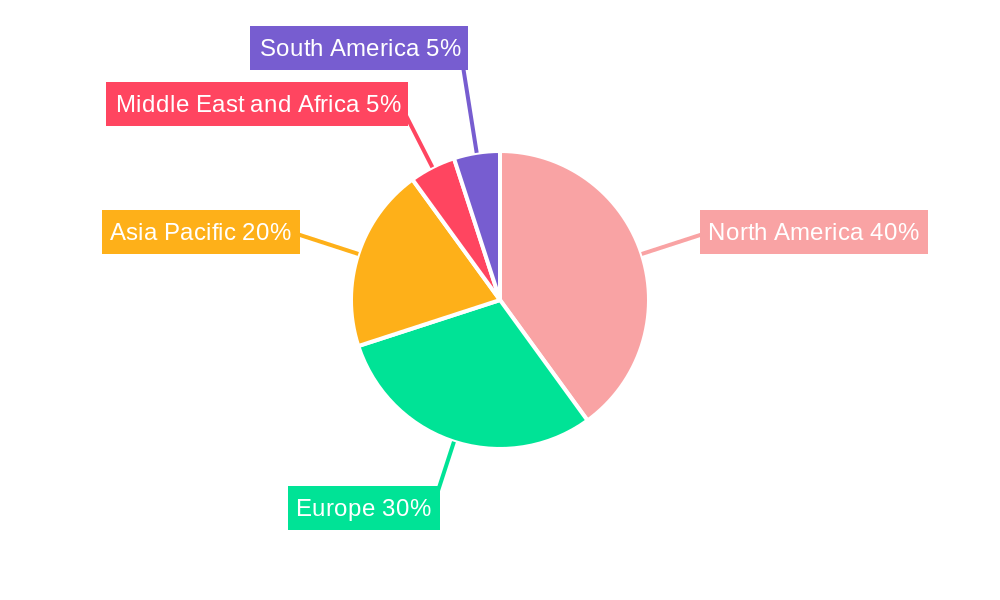
The market segmentation reveals cardiovascular disease applications currently hold the largest share, followed by obesity and cancer research. This is anticipated to continue, although other applications, such as personalized sports nutrition and digestive health management, are expected to witness significant growth in the coming years. Geographical analysis indicates that North America currently dominates the market due to high adoption rates, advanced healthcare infrastructure, and strong research initiatives. However, Asia-Pacific is poised for substantial growth, fueled by increasing healthcare expenditure and a rising middle class with greater access to personalized healthcare services. Europe and other regions are also showing consistent growth albeit at a potentially slower pace than the Asia-Pacific region, indicating a globally expanding market for nutrigenomics products and services. The market is characterized by a mix of established players and emerging biotech companies, leading to a dynamic and competitive landscape.
Nutrigenomics Industry Market Report: A Comprehensive Analysis (2019-2033)
This comprehensive report provides an in-depth analysis of the Nutrigenomics Industry, projecting a market valued at USD xx Million by 2033. This detailed study covers market dynamics, leading players, emerging trends, and future growth opportunities, offering invaluable insights for stakeholders across the industry. The report utilizes data from the historical period (2019-2024), base year (2025), and estimated year (2025), to forecast market trends until 2033.
Nutrigenomics Industry Market Dynamics & Concentration
The Nutrigenomics market is experiencing significant growth, driven by increasing consumer awareness of personalized nutrition and advancements in genomic technologies. Market concentration is currently moderate, with a few major players like Unilever Group, BASF SE, and DSM holding substantial market share, estimated at approximately xx% combined in 2025. However, numerous smaller companies and startups are also contributing to innovation. The industry is characterized by frequent mergers and acquisitions (M&A) activity, with an estimated xx M&A deals recorded between 2019 and 2024. Regulatory frameworks vary across geographies, impacting market access and product development. The industry faces competition from traditional dietary supplement and pharmaceutical companies, but the personalized approach of nutrigenomics offers a unique competitive advantage. End-user trends show a clear preference for personalized wellness solutions, fueling market growth.
- Market Share (2025): Unilever Group: xx%; BASF SE: xx%; DSM: xx%; Others: xx%
- M&A Deal Count (2019-2024): xx
Nutrigenomics Industry Industry Trends & Analysis
The Nutrigenomics industry is experiencing robust growth, with a projected Compound Annual Growth Rate (CAGR) of xx% during the forecast period (2025-2033). This growth is propelled by several key factors: increasing prevalence of chronic diseases like cardiovascular diseases and obesity, rising demand for personalized healthcare solutions, technological advancements in genomics and bioinformatics, and increased consumer spending on wellness products. Market penetration is currently at xx% in developed countries and is expected to increase significantly in emerging markets. Technological disruptions such as advancements in Next-Generation Sequencing (NGS) and artificial intelligence (AI) are driving the development of more accurate and efficient nutrigenomic tests and personalized interventions. Changing consumer preferences toward preventative healthcare and personalized nutrition are creating significant opportunities for the industry. However, competitive dynamics remain intense, requiring companies to constantly innovate and adapt.
Leading Markets & Segments in Nutrigenomics Industry
The North American region currently dominates the Nutrigenomics market, driven by factors such as strong research infrastructure, high healthcare expenditure, and early adoption of personalized medicine. Within applications, cardiovascular diseases and obesity represent the largest segments, primarily due to their high prevalence and significant healthcare burden. Cancer research is also a rapidly growing segment, fueled by the potential for targeted interventions.
- Key Drivers in North America: Strong R&D infrastructure, high healthcare expenditure, early adoption of personalized medicine.
- Dominant Application Segments: Cardiovascular Diseases, Obesity, Cancer research.
- Detailed Dominance Analysis: The prevalence of chronic diseases in North America, coupled with a robust healthcare system and high consumer awareness, has fueled significant growth in the nutrigenomics market. This early adoption has positioned the region as a leader and created a strong base for future expansion.
Nutrigenomics Industry Product Developments
Recent product innovations have focused on developing more accurate and personalized nutrigenomic tests, advanced analytical tools to interpret complex genomic data, and targeted nutraceutical formulations based on individual genetic profiles. These advancements are improving the effectiveness and efficiency of nutrigenomic interventions, expanding market applications, and offering a distinct competitive advantage to companies at the forefront of innovation. The emphasis is on creating user-friendly platforms, accessible testing procedures, and clear communication of results to improve patient compliance and market penetration.
Key Drivers of Nutrigenomics Industry Growth
Several factors are driving the expansion of the Nutrigenomics industry. Technological advancements in genomics and bioinformatics are reducing the cost and improving the accuracy of genetic testing. Rising prevalence of chronic diseases is creating a high demand for preventive and personalized healthcare solutions. Government initiatives promoting personalized medicine and supportive regulatory frameworks in some regions are also accelerating growth. Furthermore, increasing consumer awareness and willingness to adopt personalized nutrition strategies are fostering market expansion.
Challenges in the Nutrigenomics Industry Market
Despite significant growth potential, the Nutrigenomics industry faces various challenges. High costs associated with genetic testing and personalized interventions can limit market access. Regulatory uncertainties and varied regulatory landscapes across different countries pose significant hurdles to product development and market entry. Competition from established players in the pharmaceutical and food industries necessitates innovation and strategic partnerships. Supply chain disruptions and the complexities of managing personalized data privacy also pose operational challenges impacting profitability.
Emerging Opportunities in Nutrigenomics Industry
Several key opportunities promise long-term growth for the Nutrigenomics industry. Technological breakthroughs, such as advancements in CRISPR gene editing and AI-powered diagnostics, will further personalize healthcare solutions. Strategic partnerships between technology companies, healthcare providers, and food companies will drive innovation and widen market reach. Expansion into emerging markets with high unmet medical needs offers significant untapped potential. Development of standardized protocols and data sharing initiatives within the industry can further refine and enhance the accuracy and efficiency of nutrigenomic interventions.
Leading Players in the Nutrigenomics Industry Sector
- Unilever Group
- GX Sciences Inc
- Holistic Heal
- Nutrigenomix Inc
- BASF SE
- Metagenics Inc
- Xcode Life Sciences Private Limited
- DSM
- Danone
- Genova Diagnostics
- Cell-Logic
- GeneSmart
Key Milestones in Nutrigenomics Industry Industry
- September 2022: Pharmagreen Biotech Inc. developed its first formulated nutraceutical product, signifying a step towards wider market availability of nutrigenomic products.
- January 2022: Epigeneres Biotech secured USD 6 million in Series B funding, highlighting investor confidence in the nutrigenomics sector and its potential for growth.
Strategic Outlook for Nutrigenomics Industry Market
The Nutrigenomics market presents significant future potential, driven by continued technological advancements, increasing consumer demand, and expanding applications across diverse therapeutic areas. Strategic partnerships, focused R&D initiatives, and targeted market expansion strategies will be critical to capturing this growth. Addressing regulatory hurdles, streamlining supply chains, and building robust data security measures will be essential for long-term success within this rapidly evolving industry.
Nutrigenomics Industry Segmentation
-
1. Application
- 1.1. Cardiovascular Diseases
- 1.2. Obesity
- 1.3. Cancer Research
- 1.4. Other Applications
Nutrigenomics Industry Segmentation By Geography
-
1. North America
- 1.1. United States
- 1.2. Canada
- 1.3. Mexico
-
2. Europe
- 2.1. Germany
- 2.2. United Kingdom
- 2.3. France
- 2.4. Italy
- 2.5. Spain
- 2.6. Rest of Europe
-
3. Asia Pacific
- 3.1. China
- 3.2. Japan
- 3.3. India
- 3.4. Australia
- 3.5. South Korea
- 3.6. Rest of Asia Pacific
-
4. Middle East and Africa
- 4.1. GCC
- 4.2. South Africa
- 4.3. Rest of Middle East and Africa
-
5. South America
- 5.1. Brazil
- 5.2. Argentina
- 5.3. Rest of South America
Nutrigenomics Industry REPORT HIGHLIGHTS
| Aspects | Details |
|---|---|
| Study Period | 2019-2033 |
| Base Year | 2024 |
| Estimated Year | 2025 |
| Forecast Period | 2025-2033 |
| Historical Period | 2019-2024 |
| Growth Rate | CAGR of 15.50% from 2019-2033 |
| Segmentation |
|
Table of Contents
- 1. Introduction
- 1.1. Research Scope
- 1.2. Market Segmentation
- 1.3. Research Methodology
- 1.4. Definitions and Assumptions
- 2. Executive Summary
- 2.1. Introduction
- 3. Market Dynamics
- 3.1. Introduction
- 3.2. Market Drivers
- 3.2.1. Increasing Prevalence of Obesity; Increasing Popularity for Personalised Diet; Intense Research for Cancer Prevention and Cure
- 3.3. Market Restrains
- 3.3.1. Lack of Regulatory Approvals; Lack of Proven Results for Nutrigenomics Study Support
- 3.4. Market Trends
- 3.4.1. Obesity Segment is Anticipated to Witness Growth Over the Forecast Period
- 4. Market Factor Analysis
- 4.1. Porters Five Forces
- 4.2. Supply/Value Chain
- 4.3. PESTEL analysis
- 4.4. Market Entropy
- 4.5. Patent/Trademark Analysis
- 5. Global Nutrigenomics Industry Analysis, Insights and Forecast, 2019-2031
- 5.1. Market Analysis, Insights and Forecast - by Application
- 5.1.1. Cardiovascular Diseases
- 5.1.2. Obesity
- 5.1.3. Cancer Research
- 5.1.4. Other Applications
- 5.2. Market Analysis, Insights and Forecast - by Region
- 5.2.1. North America
- 5.2.2. Europe
- 5.2.3. Asia Pacific
- 5.2.4. Middle East and Africa
- 5.2.5. South America
- 5.1. Market Analysis, Insights and Forecast - by Application
- 6. North America Nutrigenomics Industry Analysis, Insights and Forecast, 2019-2031
- 6.1. Market Analysis, Insights and Forecast - by Application
- 6.1.1. Cardiovascular Diseases
- 6.1.2. Obesity
- 6.1.3. Cancer Research
- 6.1.4. Other Applications
- 6.1. Market Analysis, Insights and Forecast - by Application
- 7. Europe Nutrigenomics Industry Analysis, Insights and Forecast, 2019-2031
- 7.1. Market Analysis, Insights and Forecast - by Application
- 7.1.1. Cardiovascular Diseases
- 7.1.2. Obesity
- 7.1.3. Cancer Research
- 7.1.4. Other Applications
- 7.1. Market Analysis, Insights and Forecast - by Application
- 8. Asia Pacific Nutrigenomics Industry Analysis, Insights and Forecast, 2019-2031
- 8.1. Market Analysis, Insights and Forecast - by Application
- 8.1.1. Cardiovascular Diseases
- 8.1.2. Obesity
- 8.1.3. Cancer Research
- 8.1.4. Other Applications
- 8.1. Market Analysis, Insights and Forecast - by Application
- 9. Middle East and Africa Nutrigenomics Industry Analysis, Insights and Forecast, 2019-2031
- 9.1. Market Analysis, Insights and Forecast - by Application
- 9.1.1. Cardiovascular Diseases
- 9.1.2. Obesity
- 9.1.3. Cancer Research
- 9.1.4. Other Applications
- 9.1. Market Analysis, Insights and Forecast - by Application
- 10. South America Nutrigenomics Industry Analysis, Insights and Forecast, 2019-2031
- 10.1. Market Analysis, Insights and Forecast - by Application
- 10.1.1. Cardiovascular Diseases
- 10.1.2. Obesity
- 10.1.3. Cancer Research
- 10.1.4. Other Applications
- 10.1. Market Analysis, Insights and Forecast - by Application
- 11. North America Nutrigenomics Industry Analysis, Insights and Forecast, 2019-2031
- 11.1. Market Analysis, Insights and Forecast - By Country/Sub-region
- 11.1.1 United States
- 11.1.2 Canada
- 11.1.3 Mexico
- 12. Europe Nutrigenomics Industry Analysis, Insights and Forecast, 2019-2031
- 12.1. Market Analysis, Insights and Forecast - By Country/Sub-region
- 12.1.1 Germany
- 12.1.2 United Kingdom
- 12.1.3 France
- 12.1.4 Italy
- 12.1.5 Spain
- 12.1.6 Rest of Europe
- 13. Asia Pacific Nutrigenomics Industry Analysis, Insights and Forecast, 2019-2031
- 13.1. Market Analysis, Insights and Forecast - By Country/Sub-region
- 13.1.1 China
- 13.1.2 Japan
- 13.1.3 India
- 13.1.4 Australia
- 13.1.5 South Korea
- 13.1.6 Rest of Asia Pacific
- 14. Middle East and Africa Nutrigenomics Industry Analysis, Insights and Forecast, 2019-2031
- 14.1. Market Analysis, Insights and Forecast - By Country/Sub-region
- 14.1.1 GCC
- 14.1.2 South Africa
- 14.1.3 Rest of Middle East and Africa
- 15. South America Nutrigenomics Industry Analysis, Insights and Forecast, 2019-2031
- 15.1. Market Analysis, Insights and Forecast - By Country/Sub-region
- 15.1.1 Brazil
- 15.1.2 Argentina
- 15.1.3 Rest of South America
- 16. Competitive Analysis
- 16.1. Global Market Share Analysis 2024
- 16.2. Company Profiles
- 16.2.1 Unilever Group
- 16.2.1.1. Overview
- 16.2.1.2. Products
- 16.2.1.3. SWOT Analysis
- 16.2.1.4. Recent Developments
- 16.2.1.5. Financials (Based on Availability)
- 16.2.2 GX Sciences Inc
- 16.2.2.1. Overview
- 16.2.2.2. Products
- 16.2.2.3. SWOT Analysis
- 16.2.2.4. Recent Developments
- 16.2.2.5. Financials (Based on Availability)
- 16.2.3 Holistic Heal
- 16.2.3.1. Overview
- 16.2.3.2. Products
- 16.2.3.3. SWOT Analysis
- 16.2.3.4. Recent Developments
- 16.2.3.5. Financials (Based on Availability)
- 16.2.4 Nutrigenomix Inc
- 16.2.4.1. Overview
- 16.2.4.2. Products
- 16.2.4.3. SWOT Analysis
- 16.2.4.4. Recent Developments
- 16.2.4.5. Financials (Based on Availability)
- 16.2.5 BASF SE
- 16.2.5.1. Overview
- 16.2.5.2. Products
- 16.2.5.3. SWOT Analysis
- 16.2.5.4. Recent Developments
- 16.2.5.5. Financials (Based on Availability)
- 16.2.6 Metagenics Inc
- 16.2.6.1. Overview
- 16.2.6.2. Products
- 16.2.6.3. SWOT Analysis
- 16.2.6.4. Recent Developments
- 16.2.6.5. Financials (Based on Availability)
- 16.2.7 Xcode Life Sciences Private Limited
- 16.2.7.1. Overview
- 16.2.7.2. Products
- 16.2.7.3. SWOT Analysis
- 16.2.7.4. Recent Developments
- 16.2.7.5. Financials (Based on Availability)
- 16.2.8 DSM
- 16.2.8.1. Overview
- 16.2.8.2. Products
- 16.2.8.3. SWOT Analysis
- 16.2.8.4. Recent Developments
- 16.2.8.5. Financials (Based on Availability)
- 16.2.9 Danone
- 16.2.9.1. Overview
- 16.2.9.2. Products
- 16.2.9.3. SWOT Analysis
- 16.2.9.4. Recent Developments
- 16.2.9.5. Financials (Based on Availability)
- 16.2.10 Genova Diagnostics
- 16.2.10.1. Overview
- 16.2.10.2. Products
- 16.2.10.3. SWOT Analysis
- 16.2.10.4. Recent Developments
- 16.2.10.5. Financials (Based on Availability)
- 16.2.11 Cell-Logic
- 16.2.11.1. Overview
- 16.2.11.2. Products
- 16.2.11.3. SWOT Analysis
- 16.2.11.4. Recent Developments
- 16.2.11.5. Financials (Based on Availability)
- 16.2.12 GeneSmart
- 16.2.12.1. Overview
- 16.2.12.2. Products
- 16.2.12.3. SWOT Analysis
- 16.2.12.4. Recent Developments
- 16.2.12.5. Financials (Based on Availability)
- 16.2.1 Unilever Group
List of Figures
- Figure 1: Global Nutrigenomics Industry Revenue Breakdown (Million, %) by Region 2024 & 2032
- Figure 2: North America Nutrigenomics Industry Revenue (Million), by Country 2024 & 2032
- Figure 3: North America Nutrigenomics Industry Revenue Share (%), by Country 2024 & 2032
- Figure 4: Europe Nutrigenomics Industry Revenue (Million), by Country 2024 & 2032
- Figure 5: Europe Nutrigenomics Industry Revenue Share (%), by Country 2024 & 2032
- Figure 6: Asia Pacific Nutrigenomics Industry Revenue (Million), by Country 2024 & 2032
- Figure 7: Asia Pacific Nutrigenomics Industry Revenue Share (%), by Country 2024 & 2032
- Figure 8: Middle East and Africa Nutrigenomics Industry Revenue (Million), by Country 2024 & 2032
- Figure 9: Middle East and Africa Nutrigenomics Industry Revenue Share (%), by Country 2024 & 2032
- Figure 10: South America Nutrigenomics Industry Revenue (Million), by Country 2024 & 2032
- Figure 11: South America Nutrigenomics Industry Revenue Share (%), by Country 2024 & 2032
- Figure 12: North America Nutrigenomics Industry Revenue (Million), by Application 2024 & 2032
- Figure 13: North America Nutrigenomics Industry Revenue Share (%), by Application 2024 & 2032
- Figure 14: North America Nutrigenomics Industry Revenue (Million), by Country 2024 & 2032
- Figure 15: North America Nutrigenomics Industry Revenue Share (%), by Country 2024 & 2032
- Figure 16: Europe Nutrigenomics Industry Revenue (Million), by Application 2024 & 2032
- Figure 17: Europe Nutrigenomics Industry Revenue Share (%), by Application 2024 & 2032
- Figure 18: Europe Nutrigenomics Industry Revenue (Million), by Country 2024 & 2032
- Figure 19: Europe Nutrigenomics Industry Revenue Share (%), by Country 2024 & 2032
- Figure 20: Asia Pacific Nutrigenomics Industry Revenue (Million), by Application 2024 & 2032
- Figure 21: Asia Pacific Nutrigenomics Industry Revenue Share (%), by Application 2024 & 2032
- Figure 22: Asia Pacific Nutrigenomics Industry Revenue (Million), by Country 2024 & 2032
- Figure 23: Asia Pacific Nutrigenomics Industry Revenue Share (%), by Country 2024 & 2032
- Figure 24: Middle East and Africa Nutrigenomics Industry Revenue (Million), by Application 2024 & 2032
- Figure 25: Middle East and Africa Nutrigenomics Industry Revenue Share (%), by Application 2024 & 2032
- Figure 26: Middle East and Africa Nutrigenomics Industry Revenue (Million), by Country 2024 & 2032
- Figure 27: Middle East and Africa Nutrigenomics Industry Revenue Share (%), by Country 2024 & 2032
- Figure 28: South America Nutrigenomics Industry Revenue (Million), by Application 2024 & 2032
- Figure 29: South America Nutrigenomics Industry Revenue Share (%), by Application 2024 & 2032
- Figure 30: South America Nutrigenomics Industry Revenue (Million), by Country 2024 & 2032
- Figure 31: South America Nutrigenomics Industry Revenue Share (%), by Country 2024 & 2032
List of Tables
- Table 1: Global Nutrigenomics Industry Revenue Million Forecast, by Region 2019 & 2032
- Table 2: Global Nutrigenomics Industry Revenue Million Forecast, by Application 2019 & 2032
- Table 3: Global Nutrigenomics Industry Revenue Million Forecast, by Region 2019 & 2032
- Table 4: Global Nutrigenomics Industry Revenue Million Forecast, by Country 2019 & 2032
- Table 5: United States Nutrigenomics Industry Revenue (Million) Forecast, by Application 2019 & 2032
- Table 6: Canada Nutrigenomics Industry Revenue (Million) Forecast, by Application 2019 & 2032
- Table 7: Mexico Nutrigenomics Industry Revenue (Million) Forecast, by Application 2019 & 2032
- Table 8: Global Nutrigenomics Industry Revenue Million Forecast, by Country 2019 & 2032
- Table 9: Germany Nutrigenomics Industry Revenue (Million) Forecast, by Application 2019 & 2032
- Table 10: United Kingdom Nutrigenomics Industry Revenue (Million) Forecast, by Application 2019 & 2032
- Table 11: France Nutrigenomics Industry Revenue (Million) Forecast, by Application 2019 & 2032
- Table 12: Italy Nutrigenomics Industry Revenue (Million) Forecast, by Application 2019 & 2032
- Table 13: Spain Nutrigenomics Industry Revenue (Million) Forecast, by Application 2019 & 2032
- Table 14: Rest of Europe Nutrigenomics Industry Revenue (Million) Forecast, by Application 2019 & 2032
- Table 15: Global Nutrigenomics Industry Revenue Million Forecast, by Country 2019 & 2032
- Table 16: China Nutrigenomics Industry Revenue (Million) Forecast, by Application 2019 & 2032
- Table 17: Japan Nutrigenomics Industry Revenue (Million) Forecast, by Application 2019 & 2032
- Table 18: India Nutrigenomics Industry Revenue (Million) Forecast, by Application 2019 & 2032
- Table 19: Australia Nutrigenomics Industry Revenue (Million) Forecast, by Application 2019 & 2032
- Table 20: South Korea Nutrigenomics Industry Revenue (Million) Forecast, by Application 2019 & 2032
- Table 21: Rest of Asia Pacific Nutrigenomics Industry Revenue (Million) Forecast, by Application 2019 & 2032
- Table 22: Global Nutrigenomics Industry Revenue Million Forecast, by Country 2019 & 2032
- Table 23: GCC Nutrigenomics Industry Revenue (Million) Forecast, by Application 2019 & 2032
- Table 24: South Africa Nutrigenomics Industry Revenue (Million) Forecast, by Application 2019 & 2032
- Table 25: Rest of Middle East and Africa Nutrigenomics Industry Revenue (Million) Forecast, by Application 2019 & 2032
- Table 26: Global Nutrigenomics Industry Revenue Million Forecast, by Country 2019 & 2032
- Table 27: Brazil Nutrigenomics Industry Revenue (Million) Forecast, by Application 2019 & 2032
- Table 28: Argentina Nutrigenomics Industry Revenue (Million) Forecast, by Application 2019 & 2032
- Table 29: Rest of South America Nutrigenomics Industry Revenue (Million) Forecast, by Application 2019 & 2032
- Table 30: Global Nutrigenomics Industry Revenue Million Forecast, by Application 2019 & 2032
- Table 31: Global Nutrigenomics Industry Revenue Million Forecast, by Country 2019 & 2032
- Table 32: United States Nutrigenomics Industry Revenue (Million) Forecast, by Application 2019 & 2032
- Table 33: Canada Nutrigenomics Industry Revenue (Million) Forecast, by Application 2019 & 2032
- Table 34: Mexico Nutrigenomics Industry Revenue (Million) Forecast, by Application 2019 & 2032
- Table 35: Global Nutrigenomics Industry Revenue Million Forecast, by Application 2019 & 2032
- Table 36: Global Nutrigenomics Industry Revenue Million Forecast, by Country 2019 & 2032
- Table 37: Germany Nutrigenomics Industry Revenue (Million) Forecast, by Application 2019 & 2032
- Table 38: United Kingdom Nutrigenomics Industry Revenue (Million) Forecast, by Application 2019 & 2032
- Table 39: France Nutrigenomics Industry Revenue (Million) Forecast, by Application 2019 & 2032
- Table 40: Italy Nutrigenomics Industry Revenue (Million) Forecast, by Application 2019 & 2032
- Table 41: Spain Nutrigenomics Industry Revenue (Million) Forecast, by Application 2019 & 2032
- Table 42: Rest of Europe Nutrigenomics Industry Revenue (Million) Forecast, by Application 2019 & 2032
- Table 43: Global Nutrigenomics Industry Revenue Million Forecast, by Application 2019 & 2032
- Table 44: Global Nutrigenomics Industry Revenue Million Forecast, by Country 2019 & 2032
- Table 45: China Nutrigenomics Industry Revenue (Million) Forecast, by Application 2019 & 2032
- Table 46: Japan Nutrigenomics Industry Revenue (Million) Forecast, by Application 2019 & 2032
- Table 47: India Nutrigenomics Industry Revenue (Million) Forecast, by Application 2019 & 2032
- Table 48: Australia Nutrigenomics Industry Revenue (Million) Forecast, by Application 2019 & 2032
- Table 49: South Korea Nutrigenomics Industry Revenue (Million) Forecast, by Application 2019 & 2032
- Table 50: Rest of Asia Pacific Nutrigenomics Industry Revenue (Million) Forecast, by Application 2019 & 2032
- Table 51: Global Nutrigenomics Industry Revenue Million Forecast, by Application 2019 & 2032
- Table 52: Global Nutrigenomics Industry Revenue Million Forecast, by Country 2019 & 2032
- Table 53: GCC Nutrigenomics Industry Revenue (Million) Forecast, by Application 2019 & 2032
- Table 54: South Africa Nutrigenomics Industry Revenue (Million) Forecast, by Application 2019 & 2032
- Table 55: Rest of Middle East and Africa Nutrigenomics Industry Revenue (Million) Forecast, by Application 2019 & 2032
- Table 56: Global Nutrigenomics Industry Revenue Million Forecast, by Application 2019 & 2032
- Table 57: Global Nutrigenomics Industry Revenue Million Forecast, by Country 2019 & 2032
- Table 58: Brazil Nutrigenomics Industry Revenue (Million) Forecast, by Application 2019 & 2032
- Table 59: Argentina Nutrigenomics Industry Revenue (Million) Forecast, by Application 2019 & 2032
- Table 60: Rest of South America Nutrigenomics Industry Revenue (Million) Forecast, by Application 2019 & 2032
Frequently Asked Questions
1. What is the projected Compound Annual Growth Rate (CAGR) of the Nutrigenomics Industry?
The projected CAGR is approximately 15.50%.
2. Which companies are prominent players in the Nutrigenomics Industry?
Key companies in the market include Unilever Group, GX Sciences Inc, Holistic Heal, Nutrigenomix Inc, BASF SE, Metagenics Inc, Xcode Life Sciences Private Limited, DSM, Danone, Genova Diagnostics, Cell-Logic, GeneSmart.
3. What are the main segments of the Nutrigenomics Industry?
The market segments include Application.
4. Can you provide details about the market size?
The market size is estimated to be USD XX Million as of 2022.
5. What are some drivers contributing to market growth?
Increasing Prevalence of Obesity; Increasing Popularity for Personalised Diet; Intense Research for Cancer Prevention and Cure.
6. What are the notable trends driving market growth?
Obesity Segment is Anticipated to Witness Growth Over the Forecast Period.
7. Are there any restraints impacting market growth?
Lack of Regulatory Approvals; Lack of Proven Results for Nutrigenomics Study Support.
8. Can you provide examples of recent developments in the market?
September 2022: Pharmagreen Biotech Inc. has developed its first formulated nutraceutical product and is in the process of organizing the retail sales distribution channels for its new product. This nutraceutical product utilizes a combination of fifteen ingredients from medicinal plants and mushrooms.
9. What pricing options are available for accessing the report?
Pricing options include single-user, multi-user, and enterprise licenses priced at USD 4750, USD 5250, and USD 8750 respectively.
10. Is the market size provided in terms of value or volume?
The market size is provided in terms of value, measured in Million.
11. Are there any specific market keywords associated with the report?
Yes, the market keyword associated with the report is "Nutrigenomics Industry," which aids in identifying and referencing the specific market segment covered.
12. How do I determine which pricing option suits my needs best?
The pricing options vary based on user requirements and access needs. Individual users may opt for single-user licenses, while businesses requiring broader access may choose multi-user or enterprise licenses for cost-effective access to the report.
13. Are there any additional resources or data provided in the Nutrigenomics Industry report?
While the report offers comprehensive insights, it's advisable to review the specific contents or supplementary materials provided to ascertain if additional resources or data are available.
14. How can I stay updated on further developments or reports in the Nutrigenomics Industry?
To stay informed about further developments, trends, and reports in the Nutrigenomics Industry, consider subscribing to industry newsletters, following relevant companies and organizations, or regularly checking reputable industry news sources and publications.
Methodology
Step 1 - Identification of Relevant Samples Size from Population Database


Step 2 - Approaches for Defining Global Market Size (Value, Volume* & Price*)

Note*: In applicable scenarios
Step 3 - Data Sources
Primary Research
- Web Analytics
- Survey Reports
- Research Institute
- Latest Research Reports
- Opinion Leaders
Secondary Research
- Annual Reports
- White Paper
- Latest Press Release
- Industry Association
- Paid Database
- Investor Presentations

Step 4 - Data Triangulation
Involves using different sources of information in order to increase the validity of a study
These sources are likely to be stakeholders in a program - participants, other researchers, program staff, other community members, and so on.
Then we put all data in single framework & apply various statistical tools to find out the dynamic on the market.
During the analysis stage, feedback from the stakeholder groups would be compared to determine areas of agreement as well as areas of divergence
