

Key Insights
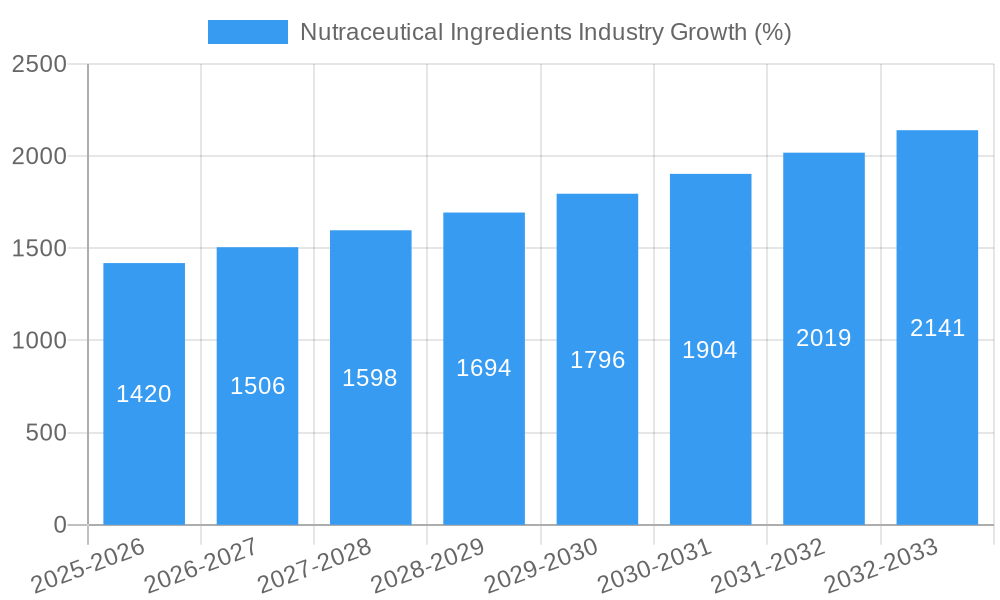
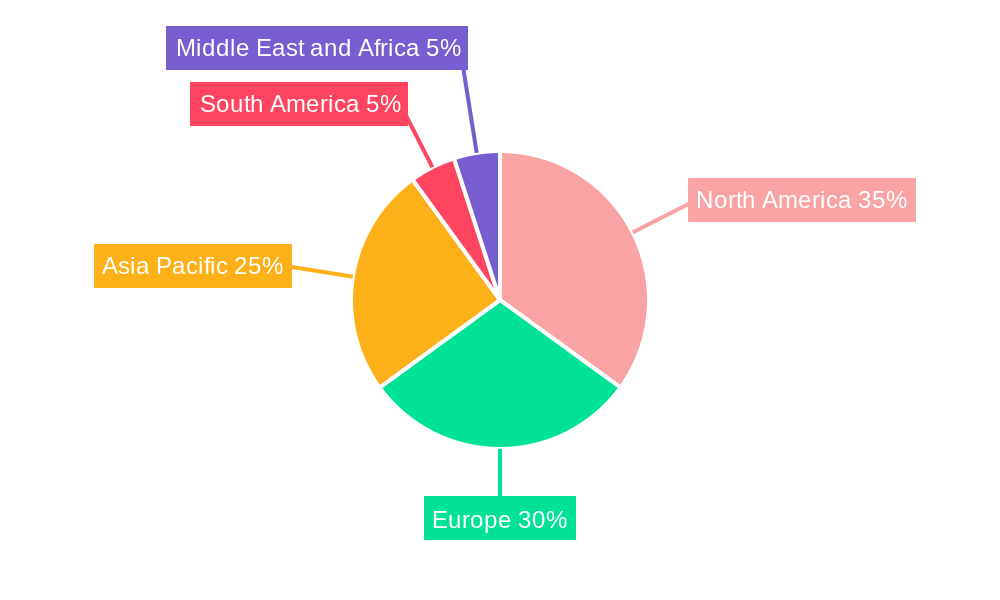
The nutraceutical ingredients market, valued at approximately $XX million in 2025, is projected to experience robust growth, driven by a rising global health-conscious population and increasing demand for functional foods and dietary supplements. A Compound Annual Growth Rate (CAGR) of 7.10% from 2025 to 2033 signifies a significant expansion, fueled by several key factors. The growing prevalence of chronic diseases like diabetes and heart disease is stimulating demand for preventative healthcare solutions, directly impacting the consumption of nutraceuticals. Furthermore, increasing consumer awareness of the benefits of proactive health management, coupled with rising disposable incomes, particularly in developing economies, contributes to the market's growth trajectory. The diverse range of applications, from functional foods and beverages to animal nutrition and cosmetics, further broadens the market's appeal. Probiotics, prebiotics, and omega-3 fatty acids are leading ingredient categories, benefiting from extensive research highlighting their health benefits and widespread adoption in various products. However, stringent regulations and the potential for inconsistent product quality pose challenges to sustained growth. The market's segmentation across various ingredient types and applications offers promising opportunities for targeted product development and strategic market penetration. Regional variations exist, with North America and Europe currently holding a substantial market share due to high consumer awareness and established regulatory frameworks. However, Asia-Pacific is poised for significant growth, driven by rising disposable incomes and changing consumer lifestyles.
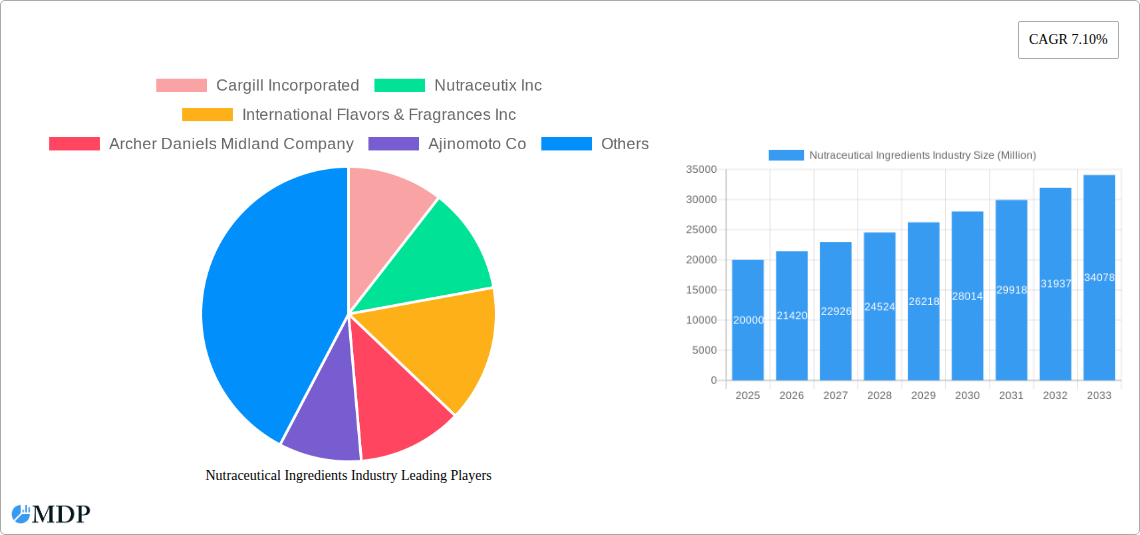
The competitive landscape is dominated by major players like Cargill, ADM, and BASF, who leverage their extensive research and development capabilities, along with global distribution networks, to maintain a strong market position. Smaller, specialized companies are also thriving by focusing on niche segments and providing innovative ingredient solutions. Future growth will depend on the continued development of novel nutraceutical ingredients, improvements in product formulations and delivery systems, and a consistent focus on quality control and regulatory compliance. The market will also see an increase in demand for personalized nutrition solutions and a focus on sustainability and ethical sourcing of raw materials. This will drive innovation and create opportunities for new market entrants and existing players alike.
Nutraceutical Ingredients Industry: A Comprehensive Market Report (2019-2033)
This comprehensive report provides an in-depth analysis of the global nutraceutical ingredients market, offering invaluable insights for stakeholders across the value chain. With a study period spanning 2019-2033, a base year of 2025, and a forecast period of 2025-2033, this report leverages extensive data and expert analysis to illuminate current market dynamics and future growth trajectories. The market is projected to reach xx Million by 2033, exhibiting a robust CAGR of xx% during the forecast period. Key players such as Cargill Incorporated, Nutraceutix Inc, International Flavors & Fragrances Inc, Archer Daniels Midland Company, Ajinomoto Co, BASF SE, Koninklijke DSM N V, Associated British Foods PLC, Ingredion Incorporated, and FMC Corporation are profiled, providing a granular understanding of their market positioning and strategies.
Nutraceutical Ingredients Industry Market Dynamics & Concentration
The nutraceutical ingredients market is characterized by a moderately concentrated landscape, with the top 10 players holding an estimated xx% market share in 2025. Market concentration is influenced by factors such as economies of scale in production, strong R&D capabilities, and established distribution networks. Innovation is a key driver, with companies continually developing novel ingredients to meet evolving consumer demands for health and wellness solutions. The regulatory framework, including FDA approvals for new ingredients, significantly impacts market growth. Product substitutes, such as traditional food sources, pose a competitive challenge, necessitating continuous innovation to maintain market share. End-user trends, including increasing health consciousness and a growing preference for functional foods and beverages, are major catalysts for market growth. M&A activity is prevalent, with an estimated xx M&A deals in the historical period (2019-2024), reflecting the industry's consolidation trend and strategic expansion efforts.
- Market Concentration: Top 10 players hold xx% market share (2025).
- Innovation Drivers: Development of novel ingredients, functional foods, and personalized nutrition solutions.
- Regulatory Framework: FDA approvals significantly influence market access and growth.
- Product Substitutes: Traditional food sources pose competitive challenges.
- End-User Trends: Rising health consciousness and demand for functional products.
- M&A Activity: xx M&A deals (2019-2024) indicating market consolidation.
Nutraceutical Ingredients Industry Industry Trends & Analysis
The nutraceutical ingredients market is experiencing significant growth driven by several converging trends. The rising prevalence of chronic diseases, coupled with increasing awareness of preventive healthcare, fuels demand for functional foods, dietary supplements, and other nutraceutical products. Technological advancements, such as precision fermentation and advanced extraction techniques, are enabling the development of more effective and sustainable ingredients. Consumer preferences are shifting towards natural, clean-label products with substantiated health benefits, which necessitates ingredient manufacturers to adapt their offerings. Competitive dynamics are intensifying, with companies focusing on product differentiation, innovation, and strategic partnerships to gain a competitive edge. The market’s expansion is further facilitated by favorable regulatory environments in key regions, and the increasing adoption of nutraceuticals in animal feed further fuels growth. The market exhibits a CAGR of xx% during the forecast period (2025-2033), indicating substantial growth potential. Market penetration in emerging economies is increasing significantly, driven by changing lifestyles and rising disposable incomes.
Leading Markets & Segments in Nutraceutical Ingredients Industry
The North American region dominates the nutraceutical ingredients market, driven by strong consumer demand, established regulatory frameworks, and a robust infrastructure. Within ingredient types, vitamins and minerals maintain a leading position due to their widespread use in dietary supplements and functional foods. The dietary supplements application segment demonstrates high growth due to the increasing adoption of supplements for health maintenance and disease prevention.
Key Drivers:
- North America: Strong consumer demand, established regulatory frameworks, and robust infrastructure.
- Vitamins & Minerals: Widespread use in dietary supplements and functional foods.
- Dietary Supplements: High growth driven by health consciousness and preventive healthcare trends.
Dominance Analysis:
North America's dominance is underpinned by high per capita consumption of nutraceuticals, coupled with well-established distribution channels and a strong regulatory environment that supports innovation. The high prevalence of chronic diseases and increased health consciousness within this region further stimulate demand for functional foods and dietary supplements enriched with essential vitamins, minerals and other nutraceutical ingredients.
Nutraceutical Ingredients Industry Product Developments
Recent product innovations focus on delivering targeted health benefits through specialized formulations. This includes advancements in prebiotic and probiotic technologies, the development of novel delivery systems for improved bioavailability, and the use of sustainable and ethically sourced ingredients. These innovations, coupled with expanding applications across functional foods, beverages, cosmetics, and animal nutrition, are driving market growth. Products with substantiated health claims and clean-label certifications are gaining traction.
Key Drivers of Nutraceutical Ingredients Industry Growth
Several factors propel the nutraceutical ingredients market's expansion. Technological advancements, such as precision fermentation and advanced extraction techniques, enable the production of higher-quality, sustainable ingredients. The economic factor is significant, given rising disposable incomes, particularly in emerging economies, increase purchasing power for health and wellness products. Favorable regulatory environments that support ingredient innovation are vital to growth.
Challenges in the Nutraceutical Ingredients Industry Market
The industry faces challenges including stringent regulatory approvals for new ingredients and fluctuating raw material prices impacting profitability. Supply chain disruptions due to geopolitical events or climate change can impede production and increase costs. Intense competition necessitates continuous product innovation and market differentiation. The market is susceptible to fluctuations in consumer demand based on health trends and economic conditions. These challenges reduce overall market stability and growth trajectory.
Emerging Opportunities in Nutraceutical Ingredients Industry
Long-term growth is fueled by scientific breakthroughs, leading to novel ingredients with demonstrably enhanced efficacy. Strategic partnerships between ingredient suppliers and food/beverage companies accelerate product development and market penetration. Expansion into new geographic markets, particularly emerging economies, provides significant growth potential.
Leading Players in the Nutraceutical Ingredients Industry Sector
- Cargill Incorporated
- Nutraceutix Inc
- International Flavors & Fragrances Inc
- Archer Daniels Midland Company
- Ajinomoto Co
- BASF SE
- Koninklijke DSM N V
- Associated British Foods PLC
- Ingredion Incorporated
- FMC Corporation
Key Milestones in Nutraceutical Ingredients Industry Industry
- 2020: Significant increase in R&D investments across major players.
- 2021-2022: Expansion of production facilities by several key players to meet surging demand.
- 2022-2023: Multiple strategic partnerships and acquisitions aimed at expanding product portfolios and market reach.
- 2023: Several FDA approvals for novel nutraceutical ingredients.
- Ongoing: Industry-wide adoption of sustainable sourcing practices and environmentally friendly processes.
Strategic Outlook for Nutraceutical Ingredients Industry Market
The nutraceutical ingredients market presents substantial growth potential, driven by technological innovation, rising consumer awareness of health and wellness, and expanding application areas. Strategic opportunities exist in developing customized ingredient solutions, expanding into emerging markets, and creating strong partnerships to leverage collective expertise and market reach. A focus on sustainable and ethical sourcing practices will enhance the market’s overall sustainability.
Nutraceutical Ingredients Industry Segmentation
-
1. Ingredient Type
- 1.1. Prebiotic
- 1.2. Probiotic
- 1.3. Vitamins
- 1.4. Minerals
- 1.5. Protein
- 1.6. OMEGA 3 Structured Lipids
- 1.7. Phytochemicals & Plant Extracts
- 1.8. Fibers and specialty Carbohydrates
- 1.9. Other Ingredient Types
-
2. Application
- 2.1. Functional Foods
- 2.2. Functional Beverages
- 2.3. Dietary Supplements
- 2.4. Animal Nutrition
- 2.5. Cosmetics
- 2.6. Other Applications
Nutraceutical Ingredients Industry Segmentation By Geography
-
1. North America
- 1.1. United States
- 1.2. Canada
- 1.3. Mexico
- 1.4. Rest of North America
-
2. Europe
- 2.1. United Kingdom
- 2.2. Germany
- 2.3. France
- 2.4. Russia
- 2.5. Italy
- 2.6. Spain
- 2.7. Rest of Europe
-
3. Asia Pacific
- 3.1. India
- 3.2. China
- 3.3. Japan
- 3.4. Australia
- 3.5. Rest of Asia Pacific
-
4. South America
- 4.1. Brazil
- 4.2. Argentina
- 4.3. Rest of South America
-
5. Middle East and Africa
- 5.1. South Africa
- 5.2. Saudi Arabia
- 5.3. Rest of Middle East and Africa
Nutraceutical Ingredients Industry REPORT HIGHLIGHTS
| Aspects | Details |
|---|---|
| Study Period | 2019-2033 |
| Base Year | 2024 |
| Estimated Year | 2025 |
| Forecast Period | 2025-2033 |
| Historical Period | 2019-2024 |
| Growth Rate | CAGR of 7.10% from 2019-2033 |
| Segmentation |
|
Table of Contents
- 1. Introduction
- 1.1. Research Scope
- 1.2. Market Segmentation
- 1.3. Research Methodology
- 1.4. Definitions and Assumptions
- 2. Executive Summary
- 2.1. Introduction
- 3. Market Dynamics
- 3.1. Introduction
- 3.2. Market Drivers
- 3.2.1. Wide Applications and Functionality; Demand For Gluten-Free Products
- 3.3. Market Restrains
- 3.3.1. Easy Availability of Economically Feasible Alternatives
- 3.4. Market Trends
- 3.4.1. Growing Consumption of Neutraceutical Products
- 4. Market Factor Analysis
- 4.1. Porters Five Forces
- 4.2. Supply/Value Chain
- 4.3. PESTEL analysis
- 4.4. Market Entropy
- 4.5. Patent/Trademark Analysis
- 5. Global Nutraceutical Ingredients Industry Analysis, Insights and Forecast, 2019-2031
- 5.1. Market Analysis, Insights and Forecast - by Ingredient Type
- 5.1.1. Prebiotic
- 5.1.2. Probiotic
- 5.1.3. Vitamins
- 5.1.4. Minerals
- 5.1.5. Protein
- 5.1.6. OMEGA 3 Structured Lipids
- 5.1.7. Phytochemicals & Plant Extracts
- 5.1.8. Fibers and specialty Carbohydrates
- 5.1.9. Other Ingredient Types
- 5.2. Market Analysis, Insights and Forecast - by Application
- 5.2.1. Functional Foods
- 5.2.2. Functional Beverages
- 5.2.3. Dietary Supplements
- 5.2.4. Animal Nutrition
- 5.2.5. Cosmetics
- 5.2.6. Other Applications
- 5.3. Market Analysis, Insights and Forecast - by Region
- 5.3.1. North America
- 5.3.2. Europe
- 5.3.3. Asia Pacific
- 5.3.4. South America
- 5.3.5. Middle East and Africa
- 5.1. Market Analysis, Insights and Forecast - by Ingredient Type
- 6. North America Nutraceutical Ingredients Industry Analysis, Insights and Forecast, 2019-2031
- 6.1. Market Analysis, Insights and Forecast - by Ingredient Type
- 6.1.1. Prebiotic
- 6.1.2. Probiotic
- 6.1.3. Vitamins
- 6.1.4. Minerals
- 6.1.5. Protein
- 6.1.6. OMEGA 3 Structured Lipids
- 6.1.7. Phytochemicals & Plant Extracts
- 6.1.8. Fibers and specialty Carbohydrates
- 6.1.9. Other Ingredient Types
- 6.2. Market Analysis, Insights and Forecast - by Application
- 6.2.1. Functional Foods
- 6.2.2. Functional Beverages
- 6.2.3. Dietary Supplements
- 6.2.4. Animal Nutrition
- 6.2.5. Cosmetics
- 6.2.6. Other Applications
- 6.1. Market Analysis, Insights and Forecast - by Ingredient Type
- 7. Europe Nutraceutical Ingredients Industry Analysis, Insights and Forecast, 2019-2031
- 7.1. Market Analysis, Insights and Forecast - by Ingredient Type
- 7.1.1. Prebiotic
- 7.1.2. Probiotic
- 7.1.3. Vitamins
- 7.1.4. Minerals
- 7.1.5. Protein
- 7.1.6. OMEGA 3 Structured Lipids
- 7.1.7. Phytochemicals & Plant Extracts
- 7.1.8. Fibers and specialty Carbohydrates
- 7.1.9. Other Ingredient Types
- 7.2. Market Analysis, Insights and Forecast - by Application
- 7.2.1. Functional Foods
- 7.2.2. Functional Beverages
- 7.2.3. Dietary Supplements
- 7.2.4. Animal Nutrition
- 7.2.5. Cosmetics
- 7.2.6. Other Applications
- 7.1. Market Analysis, Insights and Forecast - by Ingredient Type
- 8. Asia Pacific Nutraceutical Ingredients Industry Analysis, Insights and Forecast, 2019-2031
- 8.1. Market Analysis, Insights and Forecast - by Ingredient Type
- 8.1.1. Prebiotic
- 8.1.2. Probiotic
- 8.1.3. Vitamins
- 8.1.4. Minerals
- 8.1.5. Protein
- 8.1.6. OMEGA 3 Structured Lipids
- 8.1.7. Phytochemicals & Plant Extracts
- 8.1.8. Fibers and specialty Carbohydrates
- 8.1.9. Other Ingredient Types
- 8.2. Market Analysis, Insights and Forecast - by Application
- 8.2.1. Functional Foods
- 8.2.2. Functional Beverages
- 8.2.3. Dietary Supplements
- 8.2.4. Animal Nutrition
- 8.2.5. Cosmetics
- 8.2.6. Other Applications
- 8.1. Market Analysis, Insights and Forecast - by Ingredient Type
- 9. South America Nutraceutical Ingredients Industry Analysis, Insights and Forecast, 2019-2031
- 9.1. Market Analysis, Insights and Forecast - by Ingredient Type
- 9.1.1. Prebiotic
- 9.1.2. Probiotic
- 9.1.3. Vitamins
- 9.1.4. Minerals
- 9.1.5. Protein
- 9.1.6. OMEGA 3 Structured Lipids
- 9.1.7. Phytochemicals & Plant Extracts
- 9.1.8. Fibers and specialty Carbohydrates
- 9.1.9. Other Ingredient Types
- 9.2. Market Analysis, Insights and Forecast - by Application
- 9.2.1. Functional Foods
- 9.2.2. Functional Beverages
- 9.2.3. Dietary Supplements
- 9.2.4. Animal Nutrition
- 9.2.5. Cosmetics
- 9.2.6. Other Applications
- 9.1. Market Analysis, Insights and Forecast - by Ingredient Type
- 10. Middle East and Africa Nutraceutical Ingredients Industry Analysis, Insights and Forecast, 2019-2031
- 10.1. Market Analysis, Insights and Forecast - by Ingredient Type
- 10.1.1. Prebiotic
- 10.1.2. Probiotic
- 10.1.3. Vitamins
- 10.1.4. Minerals
- 10.1.5. Protein
- 10.1.6. OMEGA 3 Structured Lipids
- 10.1.7. Phytochemicals & Plant Extracts
- 10.1.8. Fibers and specialty Carbohydrates
- 10.1.9. Other Ingredient Types
- 10.2. Market Analysis, Insights and Forecast - by Application
- 10.2.1. Functional Foods
- 10.2.2. Functional Beverages
- 10.2.3. Dietary Supplements
- 10.2.4. Animal Nutrition
- 10.2.5. Cosmetics
- 10.2.6. Other Applications
- 10.1. Market Analysis, Insights and Forecast - by Ingredient Type
- 11. North America Nutraceutical Ingredients Industry Analysis, Insights and Forecast, 2019-2031
- 11.1. Market Analysis, Insights and Forecast - By Country/Sub-region
- 11.1.1 United States
- 11.1.2 Canada
- 11.1.3 Mexico
- 11.1.4 Rest of North America
- 12. Europe Nutraceutical Ingredients Industry Analysis, Insights and Forecast, 2019-2031
- 12.1. Market Analysis, Insights and Forecast - By Country/Sub-region
- 12.1.1 United Kingdom
- 12.1.2 Germany
- 12.1.3 France
- 12.1.4 Russia
- 12.1.5 Italy
- 12.1.6 Spain
- 12.1.7 Rest of Europe
- 13. Asia Pacific Nutraceutical Ingredients Industry Analysis, Insights and Forecast, 2019-2031
- 13.1. Market Analysis, Insights and Forecast - By Country/Sub-region
- 13.1.1 India
- 13.1.2 China
- 13.1.3 Japan
- 13.1.4 Australia
- 13.1.5 Rest of Asia Pacific
- 14. South America Nutraceutical Ingredients Industry Analysis, Insights and Forecast, 2019-2031
- 14.1. Market Analysis, Insights and Forecast - By Country/Sub-region
- 14.1.1 Brazil
- 14.1.2 Argentina
- 14.1.3 Rest of South America
- 15. Middle East and Africa Nutraceutical Ingredients Industry Analysis, Insights and Forecast, 2019-2031
- 15.1. Market Analysis, Insights and Forecast - By Country/Sub-region
- 15.1.1 South Africa
- 15.1.2 Saudi Arabia
- 15.1.3 Rest of Middle East and Africa
- 16. Competitive Analysis
- 16.1. Global Market Share Analysis 2024
- 16.2. Company Profiles
- 16.2.1 Cargill Incorporated
- 16.2.1.1. Overview
- 16.2.1.2. Products
- 16.2.1.3. SWOT Analysis
- 16.2.1.4. Recent Developments
- 16.2.1.5. Financials (Based on Availability)
- 16.2.2 Nutraceutix Inc
- 16.2.2.1. Overview
- 16.2.2.2. Products
- 16.2.2.3. SWOT Analysis
- 16.2.2.4. Recent Developments
- 16.2.2.5. Financials (Based on Availability)
- 16.2.3 International Flavors & Fragrances Inc
- 16.2.3.1. Overview
- 16.2.3.2. Products
- 16.2.3.3. SWOT Analysis
- 16.2.3.4. Recent Developments
- 16.2.3.5. Financials (Based on Availability)
- 16.2.4 Archer Daniels Midland Company
- 16.2.4.1. Overview
- 16.2.4.2. Products
- 16.2.4.3. SWOT Analysis
- 16.2.4.4. Recent Developments
- 16.2.4.5. Financials (Based on Availability)
- 16.2.5 Ajinomoto Co
- 16.2.5.1. Overview
- 16.2.5.2. Products
- 16.2.5.3. SWOT Analysis
- 16.2.5.4. Recent Developments
- 16.2.5.5. Financials (Based on Availability)
- 16.2.6 BASF SE
- 16.2.6.1. Overview
- 16.2.6.2. Products
- 16.2.6.3. SWOT Analysis
- 16.2.6.4. Recent Developments
- 16.2.6.5. Financials (Based on Availability)
- 16.2.7 Koninklijke DSM N V
- 16.2.7.1. Overview
- 16.2.7.2. Products
- 16.2.7.3. SWOT Analysis
- 16.2.7.4. Recent Developments
- 16.2.7.5. Financials (Based on Availability)
- 16.2.8 Associated British Foods PLC
- 16.2.8.1. Overview
- 16.2.8.2. Products
- 16.2.8.3. SWOT Analysis
- 16.2.8.4. Recent Developments
- 16.2.8.5. Financials (Based on Availability)
- 16.2.9 Ingredion Incorporated
- 16.2.9.1. Overview
- 16.2.9.2. Products
- 16.2.9.3. SWOT Analysis
- 16.2.9.4. Recent Developments
- 16.2.9.5. Financials (Based on Availability)
- 16.2.10 FMC Corporation
- 16.2.10.1. Overview
- 16.2.10.2. Products
- 16.2.10.3. SWOT Analysis
- 16.2.10.4. Recent Developments
- 16.2.10.5. Financials (Based on Availability)
- 16.2.1 Cargill Incorporated
List of Figures
- Figure 1: Global Nutraceutical Ingredients Industry Revenue Breakdown (Million, %) by Region 2024 & 2032
- Figure 2: North America Nutraceutical Ingredients Industry Revenue (Million), by Country 2024 & 2032
- Figure 3: North America Nutraceutical Ingredients Industry Revenue Share (%), by Country 2024 & 2032
- Figure 4: Europe Nutraceutical Ingredients Industry Revenue (Million), by Country 2024 & 2032
- Figure 5: Europe Nutraceutical Ingredients Industry Revenue Share (%), by Country 2024 & 2032
- Figure 6: Asia Pacific Nutraceutical Ingredients Industry Revenue (Million), by Country 2024 & 2032
- Figure 7: Asia Pacific Nutraceutical Ingredients Industry Revenue Share (%), by Country 2024 & 2032
- Figure 8: South America Nutraceutical Ingredients Industry Revenue (Million), by Country 2024 & 2032
- Figure 9: South America Nutraceutical Ingredients Industry Revenue Share (%), by Country 2024 & 2032
- Figure 10: Middle East and Africa Nutraceutical Ingredients Industry Revenue (Million), by Country 2024 & 2032
- Figure 11: Middle East and Africa Nutraceutical Ingredients Industry Revenue Share (%), by Country 2024 & 2032
- Figure 12: North America Nutraceutical Ingredients Industry Revenue (Million), by Ingredient Type 2024 & 2032
- Figure 13: North America Nutraceutical Ingredients Industry Revenue Share (%), by Ingredient Type 2024 & 2032
- Figure 14: North America Nutraceutical Ingredients Industry Revenue (Million), by Application 2024 & 2032
- Figure 15: North America Nutraceutical Ingredients Industry Revenue Share (%), by Application 2024 & 2032
- Figure 16: North America Nutraceutical Ingredients Industry Revenue (Million), by Country 2024 & 2032
- Figure 17: North America Nutraceutical Ingredients Industry Revenue Share (%), by Country 2024 & 2032
- Figure 18: Europe Nutraceutical Ingredients Industry Revenue (Million), by Ingredient Type 2024 & 2032
- Figure 19: Europe Nutraceutical Ingredients Industry Revenue Share (%), by Ingredient Type 2024 & 2032
- Figure 20: Europe Nutraceutical Ingredients Industry Revenue (Million), by Application 2024 & 2032
- Figure 21: Europe Nutraceutical Ingredients Industry Revenue Share (%), by Application 2024 & 2032
- Figure 22: Europe Nutraceutical Ingredients Industry Revenue (Million), by Country 2024 & 2032
- Figure 23: Europe Nutraceutical Ingredients Industry Revenue Share (%), by Country 2024 & 2032
- Figure 24: Asia Pacific Nutraceutical Ingredients Industry Revenue (Million), by Ingredient Type 2024 & 2032
- Figure 25: Asia Pacific Nutraceutical Ingredients Industry Revenue Share (%), by Ingredient Type 2024 & 2032
- Figure 26: Asia Pacific Nutraceutical Ingredients Industry Revenue (Million), by Application 2024 & 2032
- Figure 27: Asia Pacific Nutraceutical Ingredients Industry Revenue Share (%), by Application 2024 & 2032
- Figure 28: Asia Pacific Nutraceutical Ingredients Industry Revenue (Million), by Country 2024 & 2032
- Figure 29: Asia Pacific Nutraceutical Ingredients Industry Revenue Share (%), by Country 2024 & 2032
- Figure 30: South America Nutraceutical Ingredients Industry Revenue (Million), by Ingredient Type 2024 & 2032
- Figure 31: South America Nutraceutical Ingredients Industry Revenue Share (%), by Ingredient Type 2024 & 2032
- Figure 32: South America Nutraceutical Ingredients Industry Revenue (Million), by Application 2024 & 2032
- Figure 33: South America Nutraceutical Ingredients Industry Revenue Share (%), by Application 2024 & 2032
- Figure 34: South America Nutraceutical Ingredients Industry Revenue (Million), by Country 2024 & 2032
- Figure 35: South America Nutraceutical Ingredients Industry Revenue Share (%), by Country 2024 & 2032
- Figure 36: Middle East and Africa Nutraceutical Ingredients Industry Revenue (Million), by Ingredient Type 2024 & 2032
- Figure 37: Middle East and Africa Nutraceutical Ingredients Industry Revenue Share (%), by Ingredient Type 2024 & 2032
- Figure 38: Middle East and Africa Nutraceutical Ingredients Industry Revenue (Million), by Application 2024 & 2032
- Figure 39: Middle East and Africa Nutraceutical Ingredients Industry Revenue Share (%), by Application 2024 & 2032
- Figure 40: Middle East and Africa Nutraceutical Ingredients Industry Revenue (Million), by Country 2024 & 2032
- Figure 41: Middle East and Africa Nutraceutical Ingredients Industry Revenue Share (%), by Country 2024 & 2032
List of Tables
- Table 1: Global Nutraceutical Ingredients Industry Revenue Million Forecast, by Region 2019 & 2032
- Table 2: Global Nutraceutical Ingredients Industry Revenue Million Forecast, by Ingredient Type 2019 & 2032
- Table 3: Global Nutraceutical Ingredients Industry Revenue Million Forecast, by Application 2019 & 2032
- Table 4: Global Nutraceutical Ingredients Industry Revenue Million Forecast, by Region 2019 & 2032
- Table 5: Global Nutraceutical Ingredients Industry Revenue Million Forecast, by Country 2019 & 2032
- Table 6: United States Nutraceutical Ingredients Industry Revenue (Million) Forecast, by Application 2019 & 2032
- Table 7: Canada Nutraceutical Ingredients Industry Revenue (Million) Forecast, by Application 2019 & 2032
- Table 8: Mexico Nutraceutical Ingredients Industry Revenue (Million) Forecast, by Application 2019 & 2032
- Table 9: Rest of North America Nutraceutical Ingredients Industry Revenue (Million) Forecast, by Application 2019 & 2032
- Table 10: Global Nutraceutical Ingredients Industry Revenue Million Forecast, by Country 2019 & 2032
- Table 11: United Kingdom Nutraceutical Ingredients Industry Revenue (Million) Forecast, by Application 2019 & 2032
- Table 12: Germany Nutraceutical Ingredients Industry Revenue (Million) Forecast, by Application 2019 & 2032
- Table 13: France Nutraceutical Ingredients Industry Revenue (Million) Forecast, by Application 2019 & 2032
- Table 14: Russia Nutraceutical Ingredients Industry Revenue (Million) Forecast, by Application 2019 & 2032
- Table 15: Italy Nutraceutical Ingredients Industry Revenue (Million) Forecast, by Application 2019 & 2032
- Table 16: Spain Nutraceutical Ingredients Industry Revenue (Million) Forecast, by Application 2019 & 2032
- Table 17: Rest of Europe Nutraceutical Ingredients Industry Revenue (Million) Forecast, by Application 2019 & 2032
- Table 18: Global Nutraceutical Ingredients Industry Revenue Million Forecast, by Country 2019 & 2032
- Table 19: India Nutraceutical Ingredients Industry Revenue (Million) Forecast, by Application 2019 & 2032
- Table 20: China Nutraceutical Ingredients Industry Revenue (Million) Forecast, by Application 2019 & 2032
- Table 21: Japan Nutraceutical Ingredients Industry Revenue (Million) Forecast, by Application 2019 & 2032
- Table 22: Australia Nutraceutical Ingredients Industry Revenue (Million) Forecast, by Application 2019 & 2032
- Table 23: Rest of Asia Pacific Nutraceutical Ingredients Industry Revenue (Million) Forecast, by Application 2019 & 2032
- Table 24: Global Nutraceutical Ingredients Industry Revenue Million Forecast, by Country 2019 & 2032
- Table 25: Brazil Nutraceutical Ingredients Industry Revenue (Million) Forecast, by Application 2019 & 2032
- Table 26: Argentina Nutraceutical Ingredients Industry Revenue (Million) Forecast, by Application 2019 & 2032
- Table 27: Rest of South America Nutraceutical Ingredients Industry Revenue (Million) Forecast, by Application 2019 & 2032
- Table 28: Global Nutraceutical Ingredients Industry Revenue Million Forecast, by Country 2019 & 2032
- Table 29: South Africa Nutraceutical Ingredients Industry Revenue (Million) Forecast, by Application 2019 & 2032
- Table 30: Saudi Arabia Nutraceutical Ingredients Industry Revenue (Million) Forecast, by Application 2019 & 2032
- Table 31: Rest of Middle East and Africa Nutraceutical Ingredients Industry Revenue (Million) Forecast, by Application 2019 & 2032
- Table 32: Global Nutraceutical Ingredients Industry Revenue Million Forecast, by Ingredient Type 2019 & 2032
- Table 33: Global Nutraceutical Ingredients Industry Revenue Million Forecast, by Application 2019 & 2032
- Table 34: Global Nutraceutical Ingredients Industry Revenue Million Forecast, by Country 2019 & 2032
- Table 35: United States Nutraceutical Ingredients Industry Revenue (Million) Forecast, by Application 2019 & 2032
- Table 36: Canada Nutraceutical Ingredients Industry Revenue (Million) Forecast, by Application 2019 & 2032
- Table 37: Mexico Nutraceutical Ingredients Industry Revenue (Million) Forecast, by Application 2019 & 2032
- Table 38: Rest of North America Nutraceutical Ingredients Industry Revenue (Million) Forecast, by Application 2019 & 2032
- Table 39: Global Nutraceutical Ingredients Industry Revenue Million Forecast, by Ingredient Type 2019 & 2032
- Table 40: Global Nutraceutical Ingredients Industry Revenue Million Forecast, by Application 2019 & 2032
- Table 41: Global Nutraceutical Ingredients Industry Revenue Million Forecast, by Country 2019 & 2032
- Table 42: United Kingdom Nutraceutical Ingredients Industry Revenue (Million) Forecast, by Application 2019 & 2032
- Table 43: Germany Nutraceutical Ingredients Industry Revenue (Million) Forecast, by Application 2019 & 2032
- Table 44: France Nutraceutical Ingredients Industry Revenue (Million) Forecast, by Application 2019 & 2032
- Table 45: Russia Nutraceutical Ingredients Industry Revenue (Million) Forecast, by Application 2019 & 2032
- Table 46: Italy Nutraceutical Ingredients Industry Revenue (Million) Forecast, by Application 2019 & 2032
- Table 47: Spain Nutraceutical Ingredients Industry Revenue (Million) Forecast, by Application 2019 & 2032
- Table 48: Rest of Europe Nutraceutical Ingredients Industry Revenue (Million) Forecast, by Application 2019 & 2032
- Table 49: Global Nutraceutical Ingredients Industry Revenue Million Forecast, by Ingredient Type 2019 & 2032
- Table 50: Global Nutraceutical Ingredients Industry Revenue Million Forecast, by Application 2019 & 2032
- Table 51: Global Nutraceutical Ingredients Industry Revenue Million Forecast, by Country 2019 & 2032
- Table 52: India Nutraceutical Ingredients Industry Revenue (Million) Forecast, by Application 2019 & 2032
- Table 53: China Nutraceutical Ingredients Industry Revenue (Million) Forecast, by Application 2019 & 2032
- Table 54: Japan Nutraceutical Ingredients Industry Revenue (Million) Forecast, by Application 2019 & 2032
- Table 55: Australia Nutraceutical Ingredients Industry Revenue (Million) Forecast, by Application 2019 & 2032
- Table 56: Rest of Asia Pacific Nutraceutical Ingredients Industry Revenue (Million) Forecast, by Application 2019 & 2032
- Table 57: Global Nutraceutical Ingredients Industry Revenue Million Forecast, by Ingredient Type 2019 & 2032
- Table 58: Global Nutraceutical Ingredients Industry Revenue Million Forecast, by Application 2019 & 2032
- Table 59: Global Nutraceutical Ingredients Industry Revenue Million Forecast, by Country 2019 & 2032
- Table 60: Brazil Nutraceutical Ingredients Industry Revenue (Million) Forecast, by Application 2019 & 2032
- Table 61: Argentina Nutraceutical Ingredients Industry Revenue (Million) Forecast, by Application 2019 & 2032
- Table 62: Rest of South America Nutraceutical Ingredients Industry Revenue (Million) Forecast, by Application 2019 & 2032
- Table 63: Global Nutraceutical Ingredients Industry Revenue Million Forecast, by Ingredient Type 2019 & 2032
- Table 64: Global Nutraceutical Ingredients Industry Revenue Million Forecast, by Application 2019 & 2032
- Table 65: Global Nutraceutical Ingredients Industry Revenue Million Forecast, by Country 2019 & 2032
- Table 66: South Africa Nutraceutical Ingredients Industry Revenue (Million) Forecast, by Application 2019 & 2032
- Table 67: Saudi Arabia Nutraceutical Ingredients Industry Revenue (Million) Forecast, by Application 2019 & 2032
- Table 68: Rest of Middle East and Africa Nutraceutical Ingredients Industry Revenue (Million) Forecast, by Application 2019 & 2032
Frequently Asked Questions
1. What is the projected Compound Annual Growth Rate (CAGR) of the Nutraceutical Ingredients Industry?
The projected CAGR is approximately 7.10%.
2. Which companies are prominent players in the Nutraceutical Ingredients Industry?
Key companies in the market include Cargill Incorporated, Nutraceutix Inc, International Flavors & Fragrances Inc, Archer Daniels Midland Company, Ajinomoto Co, BASF SE, Koninklijke DSM N V, Associated British Foods PLC, Ingredion Incorporated, FMC Corporation.
3. What are the main segments of the Nutraceutical Ingredients Industry?
The market segments include Ingredient Type, Application.
4. Can you provide details about the market size?
The market size is estimated to be USD XX Million as of 2022.
5. What are some drivers contributing to market growth?
Wide Applications and Functionality; Demand For Gluten-Free Products.
6. What are the notable trends driving market growth?
Growing Consumption of Neutraceutical Products.
7. Are there any restraints impacting market growth?
Easy Availability of Economically Feasible Alternatives.
8. Can you provide examples of recent developments in the market?
1. Rising Investments in Research and Development: Companies are investing heavily in R&D to develop innovative ingredients and technologies. 2. Expansion of Production Facilities: Leading players are expanding their manufacturing capabilities to meet growing demand. 3. Strategic Partnerships and Acquisitions: Collaborations and acquisitions aim to enhance product portfolios and gain market share. 4. Regulatory Approvals for Novel Ingredients: New FDA approvals for nutraceutical ingredients open up growth opportunities. 5. Sustainability Initiatives: Industry players are focusing on sustainable sourcing and environmentally friendly processes.
9. What pricing options are available for accessing the report?
Pricing options include single-user, multi-user, and enterprise licenses priced at USD 4750, USD 5250, and USD 8750 respectively.
10. Is the market size provided in terms of value or volume?
The market size is provided in terms of value, measured in Million.
11. Are there any specific market keywords associated with the report?
Yes, the market keyword associated with the report is "Nutraceutical Ingredients Industry," which aids in identifying and referencing the specific market segment covered.
12. How do I determine which pricing option suits my needs best?
The pricing options vary based on user requirements and access needs. Individual users may opt for single-user licenses, while businesses requiring broader access may choose multi-user or enterprise licenses for cost-effective access to the report.
13. Are there any additional resources or data provided in the Nutraceutical Ingredients Industry report?
While the report offers comprehensive insights, it's advisable to review the specific contents or supplementary materials provided to ascertain if additional resources or data are available.
14. How can I stay updated on further developments or reports in the Nutraceutical Ingredients Industry?
To stay informed about further developments, trends, and reports in the Nutraceutical Ingredients Industry, consider subscribing to industry newsletters, following relevant companies and organizations, or regularly checking reputable industry news sources and publications.
Methodology
Step 1 - Identification of Relevant Samples Size from Population Database


Step 2 - Approaches for Defining Global Market Size (Value, Volume* & Price*)

Note*: In applicable scenarios
Step 3 - Data Sources
Primary Research
- Web Analytics
- Survey Reports
- Research Institute
- Latest Research Reports
- Opinion Leaders
Secondary Research
- Annual Reports
- White Paper
- Latest Press Release
- Industry Association
- Paid Database
- Investor Presentations

Step 4 - Data Triangulation
Involves using different sources of information in order to increase the validity of a study
These sources are likely to be stakeholders in a program - participants, other researchers, program staff, other community members, and so on.
Then we put all data in single framework & apply various statistical tools to find out the dynamic on the market.
During the analysis stage, feedback from the stakeholder groups would be compared to determine areas of agreement as well as areas of divergence
