

Key Insights
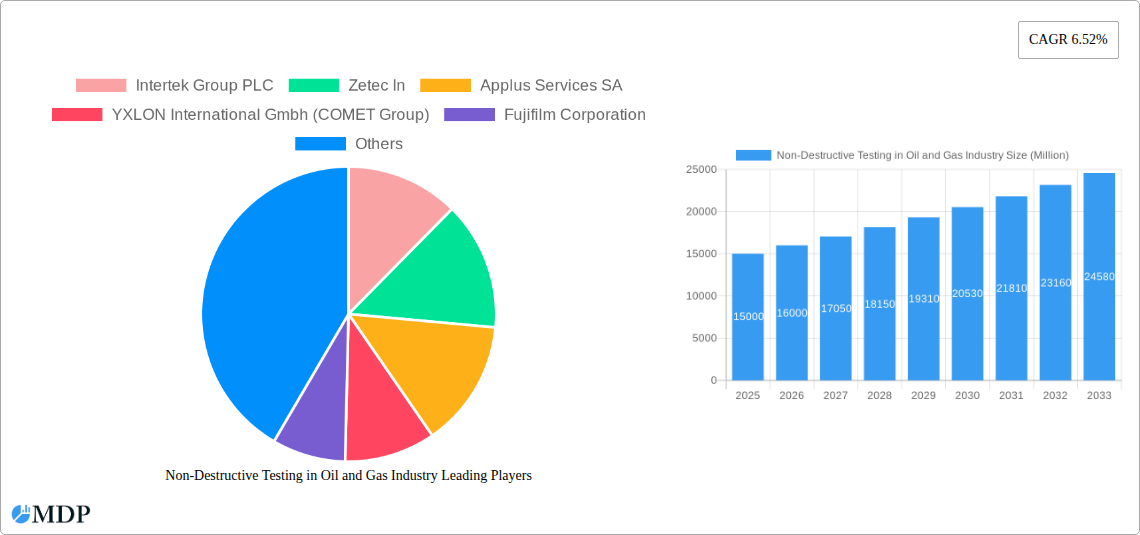
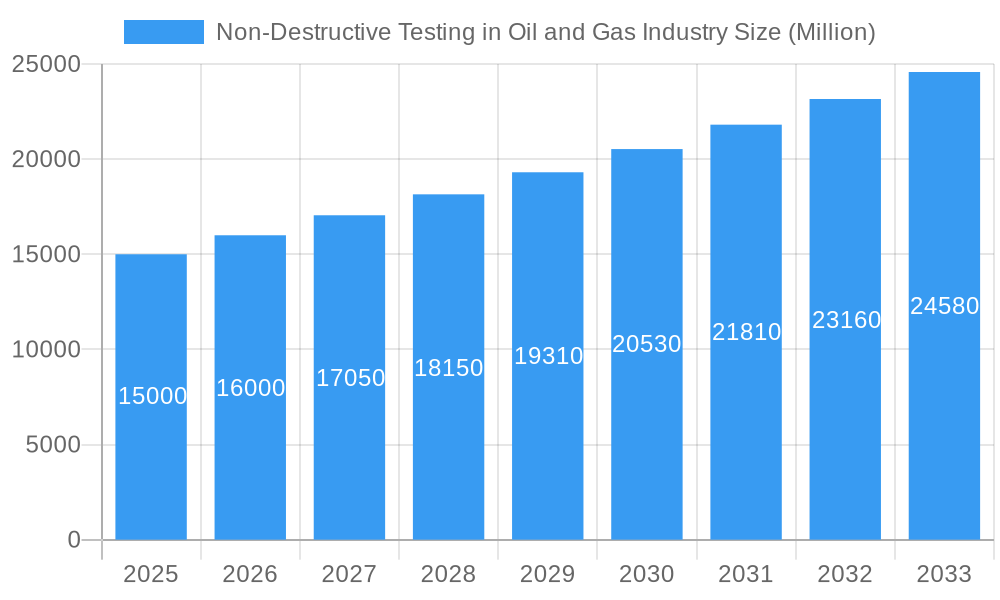
The Non-Destructive Testing (NDT) market within the oil and gas industry is experiencing robust growth, projected to maintain a Compound Annual Growth Rate (CAGR) of 6.52% from 2025 to 2033. This expansion is driven by several key factors. Firstly, stringent safety regulations and increasing emphasis on asset integrity management are compelling oil and gas operators to adopt NDT techniques for proactive maintenance and risk mitigation. Secondly, the exploration and production of oil and gas in challenging environments, such as deepwater and harsh climates, necessitates advanced NDT methods to ensure the structural soundness of equipment and pipelines. Technological advancements in NDT techniques, such as improved ultrasonic and radiographic systems, also contribute to the market's growth, enabling more accurate and efficient inspections. Finally, the rising demand for pipeline integrity management programs globally, fuelled by incidents of pipeline failures and environmental concerns, fuels demand for NDT services.
Non-Destructive Testing in Oil and Gas Industry Market Size (In Billion)
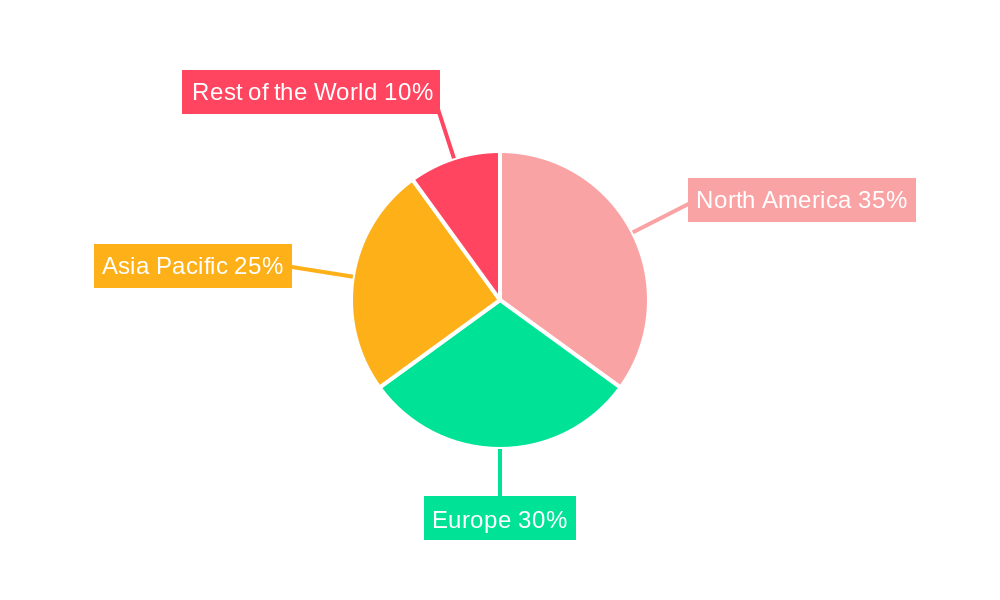
The market is segmented by type (equipment, services, upstream, midstream, downstream) and technique (ultrasonic, radiography, visual inspection, liquid penetrant, others – magnetic particle & eddy current). While the equipment segment holds a significant share currently, the services segment is poised for strong growth due to the increasing outsourcing of NDT activities by oil and gas companies to specialized service providers. Geographically, North America and Europe currently dominate the market, but the Asia-Pacific region is expected to witness significant growth due to increasing investments in oil and gas infrastructure and exploration activities. Key players like Intertek, Zetec, Applus, and Fujifilm are driving innovation and expanding their service portfolios to capitalize on this growth potential. While increasing initial investment costs for advanced NDT equipment might act as a restraint, the long-term benefits of improved safety, reduced downtime, and enhanced operational efficiency are expected to outweigh these costs, ensuring the continued expansion of the NDT market in the oil and gas sector.
Non-Destructive Testing in Oil and Gas Industry Company Market Share
Non-Destructive Testing (NDT) in the Oil & Gas Industry: A Comprehensive Market Report (2019-2033)
This comprehensive report provides an in-depth analysis of the Non-Destructive Testing (NDT) market within the oil and gas industry, offering invaluable insights for stakeholders, investors, and industry professionals. The study period covers 2019-2033, with a base year of 2025 and a forecast period of 2025-2033. The report delves into market dynamics, leading players, technological advancements, and future growth opportunities, leveraging a detailed analysis across various segments and geographic regions. Projected market value surpasses $xx Million by 2033.
Non-Destructive Testing in Oil and Gas Industry Market Dynamics & Concentration
The NDT market in the oil and gas sector is characterized by moderate concentration, with several major players holding significant market share. The market is driven by stringent safety regulations, increasing demand for enhanced asset integrity management, and the need for efficient and reliable inspection techniques. Innovation is a key driver, with continuous advancements in NDT technologies leading to improved accuracy, speed, and cost-effectiveness. Mergers and acquisitions (M&A) activity is another significant influence, shaping market consolidation and technological integration. For instance, xx M&A deals were recorded between 2019 and 2024, contributing to a market share of xx% for the top 5 players. The presence of substitute technologies, such as advanced materials, also influences market dynamics. End-user trends favor automation and remote inspection methods to improve efficiency and safety.
- Market Concentration: Moderately concentrated, with top 5 players holding xx% market share in 2024.
- Innovation Drivers: Advancements in ultrasonic testing, radiography, and other NDT techniques.
- Regulatory Frameworks: Stringent safety and environmental regulations driving adoption of NDT.
- Product Substitutes: Advanced materials with enhanced durability competing with some NDT applications.
- End-User Trends: Increasing demand for automation, remote inspection, and data analytics.
- M&A Activities: xx M&A deals recorded between 2019 and 2024.
Non-Destructive Testing in Oil and Gas Industry Industry Trends & Analysis
The NDT market in the oil and gas industry exhibits robust growth, driven by a multitude of factors. The increasing complexity of oil and gas infrastructure, coupled with a growing focus on safety and asset integrity, fuels demand for advanced NDT technologies. Technological disruptions, such as the integration of artificial intelligence (AI) and machine learning (ML) into NDT systems, are transforming inspection processes, enhancing accuracy and efficiency. The market’s competitive dynamics are characterized by ongoing innovation, strategic partnerships, and a drive toward providing comprehensive NDT solutions. Consumer preferences lean towards solutions that offer greater speed, accuracy, and data analysis capabilities. The global NDT market in the oil and gas industry is expected to register a CAGR of xx% during the forecast period (2025-2033), with market penetration projected to reach xx% by 2033.
Leading Markets & Segments in Non-Destructive Testing in Oil and Gas Industry
The Upstream segment currently dominates the oil and gas NDT market due to the high complexity and criticality of offshore platforms and pipelines. Within techniques, Ultrasonic testing holds the largest share owing to its versatility and reliability. Geographically, North America and Europe maintain leading positions, driven by established oil and gas infrastructure and stringent regulatory frameworks.
- By Type:
- Equipment: High demand driven by technological advancements and replacement cycles.
- Services: Significant share due to specialized expertise required for complex inspections.
- Upstream: Dominant segment due to the high-risk nature of offshore operations.
- Midstream: Steady growth driven by pipeline integrity management.
- Downstream: Growing adoption as refineries prioritize safety and maintenance.
- By Technique:
- Ultrasonic: Largest market share due to versatility and reliability.
- Radiography: Strong demand for inspecting welds and complex structures.
- Visual Inspection: Essential for initial assessments and overall condition monitoring.
- Liquid Penetrant: Widely used for detecting surface cracks and flaws.
- Others (Magnetic Particle & Eddy Current): Growing adoption due to specific application capabilities.
- Key Drivers: Stringent safety regulations, increasing asset complexity, and the need for improved operational efficiency.
Non-Destructive Testing in Oil and Gas Industry Product Developments
Recent years have witnessed significant advancements in NDT technologies, including the development of more portable and user-friendly equipment, improved data analysis capabilities, and the integration of AI and ML. These innovations enhance inspection speed, accuracy, and overall efficiency. The development of handheld X-ray imagers, such as Videray Technologies' PX Ultra, exemplifies the trend toward improved portability and capabilities. The integration of robotic systems for remote inspections is also gaining traction, reducing the need for human intervention in hazardous environments. This focus on improving efficiency and safety is driving market growth.
Key Drivers of Non-Destructive Testing in Oil and Gas Industry Growth
Several factors fuel the growth of the NDT market in the oil and gas industry. Stringent safety regulations mandate regular inspections, while the increasing complexity of infrastructure necessitates advanced NDT technologies. The demand for improved asset integrity management, coupled with the need for reduced downtime and enhanced operational efficiency, drives adoption of sophisticated NDT solutions. Technological advancements, such as AI and ML integration, are further boosting market growth. Finally, economic factors like rising oil and gas prices influence capital expenditure in NDT solutions.
Challenges in the Non-Destructive Testing in Oil and Gas Industry Market
The NDT market faces challenges, including high initial investment costs for advanced equipment, the need for skilled personnel, and the complexity of integrating different NDT techniques. Supply chain disruptions can impact availability and costs, while competitive pressures from alternative technologies create pressure on pricing. Regulatory hurdles and evolving standards necessitate ongoing adaptation. These challenges represent quantifiable impacts on market growth, with an estimated xx% reduction in projected growth due to these factors.
Emerging Opportunities in Non-Destructive Testing in Oil and Gas Industry
Long-term growth hinges on the integration of advanced technologies such as AI and ML, offering enhanced data analysis and automation. Strategic partnerships between NDT providers and oil and gas companies can foster innovation and tailor solutions to specific needs. Expanding into emerging markets with growing oil and gas infrastructure presents substantial growth opportunities. Moreover, the development of environmentally friendly NDT solutions will be increasingly important, responding to growing concerns about sustainability.
Leading Players in the Non-Destructive Testing in Oil and Gas Industry Sector
- Intertek Group PLC
- Zetec Inc
- Applus Services SA
- YXLON International GmbH (COMET Group)
- Fujifilm Corporation
- GE Measurement and Control (Baker Hughes)
- Karl Storz NDT GmbH
- Bureau Veritas SA
- Olympus Corporation
- Magnaflux Corp
- Magnetic Analysis Corporation
Key Milestones in Non-Destructive Testing in Oil and Gas Industry Industry
- September 2022: Waygate Technologies introduced the Ruby|plate 240 calibration phantom for industrial computed tomography (CT), enhancing accuracy and efficiency in CT inspections.
- October 2022: Videray Technologies Inc. launched PX Ultra, a handheld backscatter X-ray imager, improving portability and access for NDT applications. This launch broadened the range of applications for backscatter X-ray technology, increasing the potential market size.
Strategic Outlook for Non-Destructive Testing in Oil and Gas Industry Market
The future of the NDT market in the oil and gas industry looks promising. Continued technological advancements, coupled with a growing focus on safety and asset integrity, will drive demand for advanced NDT solutions. Strategic partnerships and the adoption of innovative business models will further shape market growth. The focus on data analytics and digitalization, combined with the adoption of sustainable NDT practices, will create considerable opportunities for players in the coming years. The market is poised for substantial expansion, with significant growth potential across various segments and geographical regions.
Non-Destructive Testing in Oil and Gas Industry Segmentation
-
1. Type
- 1.1. Equipment
- 1.2. Services
-
2. Type
- 2.1. Upstream
- 2.2. Midstream
- 2.3. Downstream
-
3. Technique
- 3.1. Ultrasonic
- 3.2. Radiography
- 3.3. Visual Inspection
- 3.4. Liquid Penetrant
- 3.5. Others (Magnetic Particle & Eddy Current)
Non-Destructive Testing in Oil and Gas Industry Segmentation By Geography
- 1. North America
- 2. Europe
- 3. Asia Pacific
- 4. Rest of the World
Non-Destructive Testing in Oil and Gas Industry Regional Market Share
Geographic Coverage of Non-Destructive Testing in Oil and Gas Industry
Non-Destructive Testing in Oil and Gas Industry REPORT HIGHLIGHTS
| Aspects | Details |
|---|---|
| Study Period | 2020-2034 |
| Base Year | 2025 |
| Estimated Year | 2026 |
| Forecast Period | 2026-2034 |
| Historical Period | 2020-2025 |
| Growth Rate | CAGR of 8.8% from 2020-2034 |
| Segmentation |
|
Table of Contents
- 1. Introduction
- 1.1. Research Scope
- 1.2. Market Segmentation
- 1.3. Research Objective
- 1.4. Definitions and Assumptions
- 2. Executive Summary
- 2.1. Market Snapshot
- 3. Market Dynamics
- 3.1. Market Drivers
- 3.2. Market Restrains
- 3.3. Market Trends
- 3.4. Market Opportunities
- 4. Market Factor Analysis
- 4.1. Porters Five Forces
- 4.1.1. Bargaining Power of Suppliers
- 4.1.2. Bargaining Power of Buyers
- 4.1.3. Threat of New Entrants
- 4.1.4. Threat of Substitutes
- 4.1.5. Competitive Rivalry
- 4.2. PESTEL analysis
- 4.3. BCG Analysis
- 4.3.1. Stars (High Growth, High Market Share)
- 4.3.2. Cash Cows (Low Growth, High Market Share)
- 4.3.3. Question Mark (High Growth, Low Market Share)
- 4.3.4. Dogs (Low Growth, Low Market Share)
- 4.4. Ansoff Matrix Analysis
- 4.5. Supply Chain Analysis
- 4.6. Regulatory Landscape
- 4.7. Current Market Potential and Opportunity Assessment (TAM–SAM–SOM Framework)
- 4.8. MDP Analyst Note
- 4.1. Porters Five Forces
- 5. Market Analysis, Insights and Forecast 2021-2033
- 5.1. Market Analysis, Insights and Forecast - by Type
- 5.1.1. Equipment
- 5.1.2. Services
- 5.2. Market Analysis, Insights and Forecast - by Type
- 5.2.1. Upstream
- 5.2.2. Midstream
- 5.2.3. Downstream
- 5.3. Market Analysis, Insights and Forecast - by Technique
- 5.3.1. Ultrasonic
- 5.3.2. Radiography
- 5.3.3. Visual Inspection
- 5.3.4. Liquid Penetrant
- 5.3.5. Others (Magnetic Particle & Eddy Current)
- 5.4. Market Analysis, Insights and Forecast - by Region
- 5.4.1. North America
- 5.4.2. Europe
- 5.4.3. Asia Pacific
- 5.4.4. Rest of the World
- 5.1. Market Analysis, Insights and Forecast - by Type
- 6. Global Non-Destructive Testing in Oil and Gas Industry Analysis, Insights and Forecast, 2021-2033
- 6.1. Market Analysis, Insights and Forecast - by Type
- 6.1.1. Equipment
- 6.1.2. Services
- 6.2. Market Analysis, Insights and Forecast - by Type
- 6.2.1. Upstream
- 6.2.2. Midstream
- 6.2.3. Downstream
- 6.3. Market Analysis, Insights and Forecast - by Technique
- 6.3.1. Ultrasonic
- 6.3.2. Radiography
- 6.3.3. Visual Inspection
- 6.3.4. Liquid Penetrant
- 6.3.5. Others (Magnetic Particle & Eddy Current)
- 6.1. Market Analysis, Insights and Forecast - by Type
- 7. North America Non-Destructive Testing in Oil and Gas Industry Analysis, Insights and Forecast, 2020-2032
- 7.1. Market Analysis, Insights and Forecast - by Type
- 7.1.1. Equipment
- 7.1.2. Services
- 7.2. Market Analysis, Insights and Forecast - by Type
- 7.2.1. Upstream
- 7.2.2. Midstream
- 7.2.3. Downstream
- 7.3. Market Analysis, Insights and Forecast - by Technique
- 7.3.1. Ultrasonic
- 7.3.2. Radiography
- 7.3.3. Visual Inspection
- 7.3.4. Liquid Penetrant
- 7.3.5. Others (Magnetic Particle & Eddy Current)
- 7.1. Market Analysis, Insights and Forecast - by Type
- 8. Europe Non-Destructive Testing in Oil and Gas Industry Analysis, Insights and Forecast, 2020-2032
- 8.1. Market Analysis, Insights and Forecast - by Type
- 8.1.1. Equipment
- 8.1.2. Services
- 8.2. Market Analysis, Insights and Forecast - by Type
- 8.2.1. Upstream
- 8.2.2. Midstream
- 8.2.3. Downstream
- 8.3. Market Analysis, Insights and Forecast - by Technique
- 8.3.1. Ultrasonic
- 8.3.2. Radiography
- 8.3.3. Visual Inspection
- 8.3.4. Liquid Penetrant
- 8.3.5. Others (Magnetic Particle & Eddy Current)
- 8.1. Market Analysis, Insights and Forecast - by Type
- 9. Asia Pacific Non-Destructive Testing in Oil and Gas Industry Analysis, Insights and Forecast, 2020-2032
- 9.1. Market Analysis, Insights and Forecast - by Type
- 9.1.1. Equipment
- 9.1.2. Services
- 9.2. Market Analysis, Insights and Forecast - by Type
- 9.2.1. Upstream
- 9.2.2. Midstream
- 9.2.3. Downstream
- 9.3. Market Analysis, Insights and Forecast - by Technique
- 9.3.1. Ultrasonic
- 9.3.2. Radiography
- 9.3.3. Visual Inspection
- 9.3.4. Liquid Penetrant
- 9.3.5. Others (Magnetic Particle & Eddy Current)
- 9.1. Market Analysis, Insights and Forecast - by Type
- 10. Rest of the World Non-Destructive Testing in Oil and Gas Industry Analysis, Insights and Forecast, 2020-2032
- 10.1. Market Analysis, Insights and Forecast - by Type
- 10.1.1. Equipment
- 10.1.2. Services
- 10.2. Market Analysis, Insights and Forecast - by Type
- 10.2.1. Upstream
- 10.2.2. Midstream
- 10.2.3. Downstream
- 10.3. Market Analysis, Insights and Forecast - by Technique
- 10.3.1. Ultrasonic
- 10.3.2. Radiography
- 10.3.3. Visual Inspection
- 10.3.4. Liquid Penetrant
- 10.3.5. Others (Magnetic Particle & Eddy Current)
- 10.1. Market Analysis, Insights and Forecast - by Type
- 11. Competitive Analysis
- 11.1. Company Profiles
- 11.1.1 Intertek Group PLC
- 11.1.1.1. Company Overview
- 11.1.1.2. Products
- 11.1.1.3. Company Financials
- 11.1.1.4. SWOT Analysis
- 11.1.2 Zetec In
- 11.1.2.1. Company Overview
- 11.1.2.2. Products
- 11.1.2.3. Company Financials
- 11.1.2.4. SWOT Analysis
- 11.1.3 Applus Services SA
- 11.1.3.1. Company Overview
- 11.1.3.2. Products
- 11.1.3.3. Company Financials
- 11.1.3.4. SWOT Analysis
- 11.1.4 YXLON International Gmbh (COMET Group)
- 11.1.4.1. Company Overview
- 11.1.4.2. Products
- 11.1.4.3. Company Financials
- 11.1.4.4. SWOT Analysis
- 11.1.5 Fujifilm Corporation
- 11.1.5.1. Company Overview
- 11.1.5.2. Products
- 11.1.5.3. Company Financials
- 11.1.5.4. SWOT Analysis
- 11.1.6 GE Measurement and Control (Baker Hughes)
- 11.1.6.1. Company Overview
- 11.1.6.2. Products
- 11.1.6.3. Company Financials
- 11.1.6.4. SWOT Analysis
- 11.1.7 Karl Storz Ndtec Gmbh
- 11.1.7.1. Company Overview
- 11.1.7.2. Products
- 11.1.7.3. Company Financials
- 11.1.7.4. SWOT Analysis
- 11.1.8 Bureau Veritas SA
- 11.1.8.1. Company Overview
- 11.1.8.2. Products
- 11.1.8.3. Company Financials
- 11.1.8.4. SWOT Analysis
- 11.1.9 Olympus Corporation
- 11.1.9.1. Company Overview
- 11.1.9.2. Products
- 11.1.9.3. Company Financials
- 11.1.9.4. SWOT Analysis
- 11.1.10 Magnaflux Corp
- 11.1.10.1. Company Overview
- 11.1.10.2. Products
- 11.1.10.3. Company Financials
- 11.1.10.4. SWOT Analysis
- 11.1.11 Magnetic Analysis Corporation
- 11.1.11.1. Company Overview
- 11.1.11.2. Products
- 11.1.11.3. Company Financials
- 11.1.11.4. SWOT Analysis
- 11.1.1 Intertek Group PLC
- 11.2. Market Entropy
- 11.2.1 Company's Key Areas Served
- 11.2.2 Recent Developments
- 11.3. Company Market Share Analysis 2025
- 11.3.1 Top 5 Companies Market Share Analysis
- 11.3.2 Top 3 Companies Market Share Analysis
- 11.4. List of Potential Customers
- 12. Research Methodology
List of Figures
- Figure 1: Global Non-Destructive Testing in Oil and Gas Industry Revenue Breakdown (billion, %) by Region 2025 & 2033
- Figure 2: North America Non-Destructive Testing in Oil and Gas Industry Revenue (billion), by Type 2025 & 2033
- Figure 3: North America Non-Destructive Testing in Oil and Gas Industry Revenue Share (%), by Type 2025 & 2033
- Figure 4: North America Non-Destructive Testing in Oil and Gas Industry Revenue (billion), by Type 2025 & 2033
- Figure 5: North America Non-Destructive Testing in Oil and Gas Industry Revenue Share (%), by Type 2025 & 2033
- Figure 6: North America Non-Destructive Testing in Oil and Gas Industry Revenue (billion), by Technique 2025 & 2033
- Figure 7: North America Non-Destructive Testing in Oil and Gas Industry Revenue Share (%), by Technique 2025 & 2033
- Figure 8: North America Non-Destructive Testing in Oil and Gas Industry Revenue (billion), by Country 2025 & 2033
- Figure 9: North America Non-Destructive Testing in Oil and Gas Industry Revenue Share (%), by Country 2025 & 2033
- Figure 10: Europe Non-Destructive Testing in Oil and Gas Industry Revenue (billion), by Type 2025 & 2033
- Figure 11: Europe Non-Destructive Testing in Oil and Gas Industry Revenue Share (%), by Type 2025 & 2033
- Figure 12: Europe Non-Destructive Testing in Oil and Gas Industry Revenue (billion), by Type 2025 & 2033
- Figure 13: Europe Non-Destructive Testing in Oil and Gas Industry Revenue Share (%), by Type 2025 & 2033
- Figure 14: Europe Non-Destructive Testing in Oil and Gas Industry Revenue (billion), by Technique 2025 & 2033
- Figure 15: Europe Non-Destructive Testing in Oil and Gas Industry Revenue Share (%), by Technique 2025 & 2033
- Figure 16: Europe Non-Destructive Testing in Oil and Gas Industry Revenue (billion), by Country 2025 & 2033
- Figure 17: Europe Non-Destructive Testing in Oil and Gas Industry Revenue Share (%), by Country 2025 & 2033
- Figure 18: Asia Pacific Non-Destructive Testing in Oil and Gas Industry Revenue (billion), by Type 2025 & 2033
- Figure 19: Asia Pacific Non-Destructive Testing in Oil and Gas Industry Revenue Share (%), by Type 2025 & 2033
- Figure 20: Asia Pacific Non-Destructive Testing in Oil and Gas Industry Revenue (billion), by Type 2025 & 2033
- Figure 21: Asia Pacific Non-Destructive Testing in Oil and Gas Industry Revenue Share (%), by Type 2025 & 2033
- Figure 22: Asia Pacific Non-Destructive Testing in Oil and Gas Industry Revenue (billion), by Technique 2025 & 2033
- Figure 23: Asia Pacific Non-Destructive Testing in Oil and Gas Industry Revenue Share (%), by Technique 2025 & 2033
- Figure 24: Asia Pacific Non-Destructive Testing in Oil and Gas Industry Revenue (billion), by Country 2025 & 2033
- Figure 25: Asia Pacific Non-Destructive Testing in Oil and Gas Industry Revenue Share (%), by Country 2025 & 2033
- Figure 26: Rest of the World Non-Destructive Testing in Oil and Gas Industry Revenue (billion), by Type 2025 & 2033
- Figure 27: Rest of the World Non-Destructive Testing in Oil and Gas Industry Revenue Share (%), by Type 2025 & 2033
- Figure 28: Rest of the World Non-Destructive Testing in Oil and Gas Industry Revenue (billion), by Type 2025 & 2033
- Figure 29: Rest of the World Non-Destructive Testing in Oil and Gas Industry Revenue Share (%), by Type 2025 & 2033
- Figure 30: Rest of the World Non-Destructive Testing in Oil and Gas Industry Revenue (billion), by Technique 2025 & 2033
- Figure 31: Rest of the World Non-Destructive Testing in Oil and Gas Industry Revenue Share (%), by Technique 2025 & 2033
- Figure 32: Rest of the World Non-Destructive Testing in Oil and Gas Industry Revenue (billion), by Country 2025 & 2033
- Figure 33: Rest of the World Non-Destructive Testing in Oil and Gas Industry Revenue Share (%), by Country 2025 & 2033
List of Tables
- Table 1: Global Non-Destructive Testing in Oil and Gas Industry Revenue billion Forecast, by Type 2020 & 2033
- Table 2: Global Non-Destructive Testing in Oil and Gas Industry Revenue billion Forecast, by Type 2020 & 2033
- Table 3: Global Non-Destructive Testing in Oil and Gas Industry Revenue billion Forecast, by Technique 2020 & 2033
- Table 4: Global Non-Destructive Testing in Oil and Gas Industry Revenue billion Forecast, by Region 2020 & 2033
- Table 5: Global Non-Destructive Testing in Oil and Gas Industry Revenue billion Forecast, by Type 2020 & 2033
- Table 6: Global Non-Destructive Testing in Oil and Gas Industry Revenue billion Forecast, by Type 2020 & 2033
- Table 7: Global Non-Destructive Testing in Oil and Gas Industry Revenue billion Forecast, by Technique 2020 & 2033
- Table 8: Global Non-Destructive Testing in Oil and Gas Industry Revenue billion Forecast, by Country 2020 & 2033
- Table 9: Global Non-Destructive Testing in Oil and Gas Industry Revenue billion Forecast, by Type 2020 & 2033
- Table 10: Global Non-Destructive Testing in Oil and Gas Industry Revenue billion Forecast, by Type 2020 & 2033
- Table 11: Global Non-Destructive Testing in Oil and Gas Industry Revenue billion Forecast, by Technique 2020 & 2033
- Table 12: Global Non-Destructive Testing in Oil and Gas Industry Revenue billion Forecast, by Country 2020 & 2033
- Table 13: Global Non-Destructive Testing in Oil and Gas Industry Revenue billion Forecast, by Type 2020 & 2033
- Table 14: Global Non-Destructive Testing in Oil and Gas Industry Revenue billion Forecast, by Type 2020 & 2033
- Table 15: Global Non-Destructive Testing in Oil and Gas Industry Revenue billion Forecast, by Technique 2020 & 2033
- Table 16: Global Non-Destructive Testing in Oil and Gas Industry Revenue billion Forecast, by Country 2020 & 2033
- Table 17: Global Non-Destructive Testing in Oil and Gas Industry Revenue billion Forecast, by Type 2020 & 2033
- Table 18: Global Non-Destructive Testing in Oil and Gas Industry Revenue billion Forecast, by Type 2020 & 2033
- Table 19: Global Non-Destructive Testing in Oil and Gas Industry Revenue billion Forecast, by Technique 2020 & 2033
- Table 20: Global Non-Destructive Testing in Oil and Gas Industry Revenue billion Forecast, by Country 2020 & 2033
Frequently Asked Questions
1. What is the projected Compound Annual Growth Rate (CAGR) of the Non-Destructive Testing in Oil and Gas Industry?
The projected CAGR is approximately 8.8%.
2. Which companies are prominent players in the Non-Destructive Testing in Oil and Gas Industry?
Key companies in the market include Intertek Group PLC, Zetec In, Applus Services SA, YXLON International Gmbh (COMET Group), Fujifilm Corporation, GE Measurement and Control (Baker Hughes), Karl Storz Ndtec Gmbh, Bureau Veritas SA, Olympus Corporation, Magnaflux Corp, Magnetic Analysis Corporation.
3. What are the main segments of the Non-Destructive Testing in Oil and Gas Industry?
The market segments include Type, Type, Technique.
4. Can you provide details about the market size?
The market size is estimated to be USD 4.06 billion as of 2022.
5. What are some drivers contributing to market growth?
Rising need to run refinery assets at full cap; Upstream sector expected to gain momentum in key markets.
6. What are the notable trends driving market growth?
The Rising Usage of Drones in the Market.
7. Are there any restraints impacting market growth?
; High Initial Cost During First Time Setup is Challenging the Market Growth.
8. Can you provide examples of recent developments in the market?
September 2022 : Waygate Technologies introduced the Ruby|plate 240 calibration phantom for industrial computed tomography (CT). Features high-resolution insights and captures extremely accurate and effective calibration bodies to determine the exact voxel size and allows operators to detect any deviation quickly and non-destructively in geometry.
9. What pricing options are available for accessing the report?
Pricing options include single-user, multi-user, and enterprise licenses priced at USD 4750, USD 5250, and USD 8750 respectively.
10. Is the market size provided in terms of value or volume?
The market size is provided in terms of value, measured in billion.
11. Are there any specific market keywords associated with the report?
Yes, the market keyword associated with the report is "Non-Destructive Testing in Oil and Gas Industry," which aids in identifying and referencing the specific market segment covered.
12. How do I determine which pricing option suits my needs best?
The pricing options vary based on user requirements and access needs. Individual users may opt for single-user licenses, while businesses requiring broader access may choose multi-user or enterprise licenses for cost-effective access to the report.
13. Are there any additional resources or data provided in the Non-Destructive Testing in Oil and Gas Industry report?
While the report offers comprehensive insights, it's advisable to review the specific contents or supplementary materials provided to ascertain if additional resources or data are available.
14. How can I stay updated on further developments or reports in the Non-Destructive Testing in Oil and Gas Industry?
To stay informed about further developments, trends, and reports in the Non-Destructive Testing in Oil and Gas Industry, consider subscribing to industry newsletters, following relevant companies and organizations, or regularly checking reputable industry news sources and publications.
Methodology
Step 1 - Identification of Relevant Samples Size from Population Database


Step 2 - Approaches for Defining Global Market Size (Value, Volume* & Price*)

Note*: In applicable scenarios
Step 3 - Data Sources
Primary Research
- Web Analytics
- Survey Reports
- Research Institute
- Latest Research Reports
- Opinion Leaders
Secondary Research
- Annual Reports
- White Paper
- Latest Press Release
- Industry Association
- Paid Database
- Investor Presentations

Step 4 - Data Triangulation
Involves using different sources of information in order to increase the validity of a study
These sources are likely to be stakeholders in a program - participants, other researchers, program staff, other community members, and so on.
Then we put all data in single framework & apply various statistical tools to find out the dynamic on the market.
During the analysis stage, feedback from the stakeholder groups would be compared to determine areas of agreement as well as areas of divergence