

Key Insights
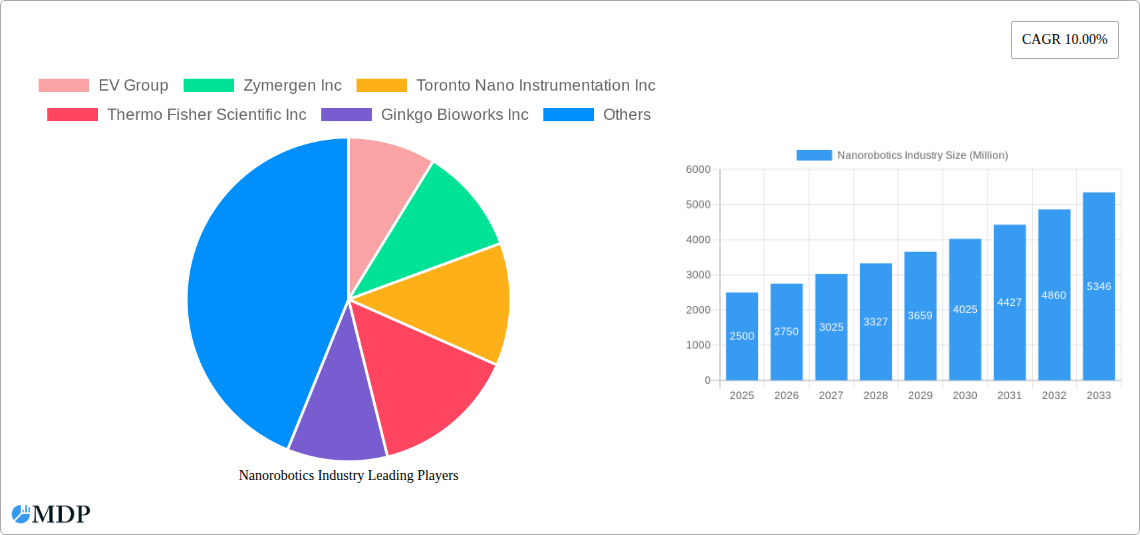
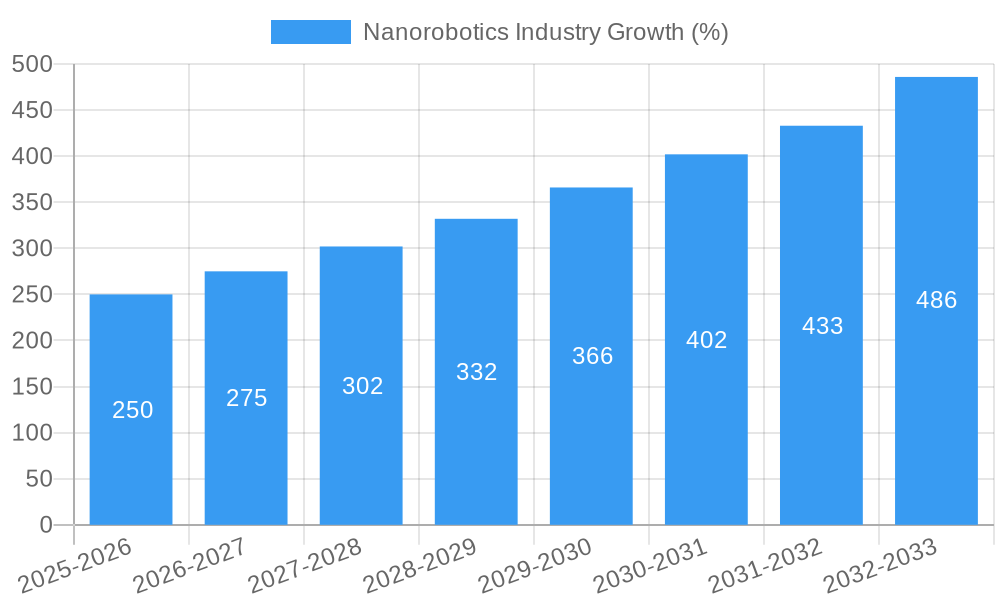
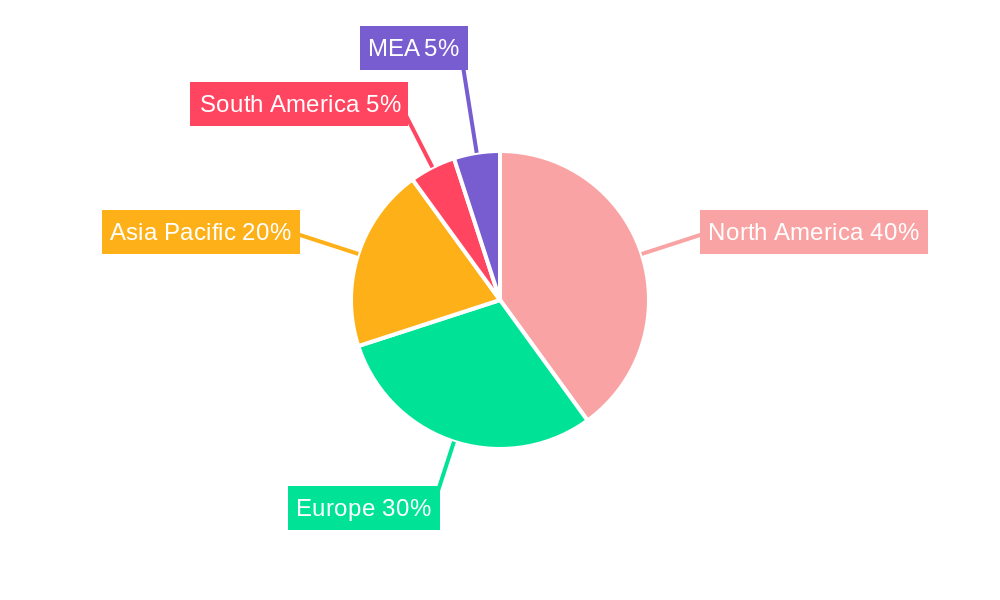
The nanorobotics market is experiencing robust growth, projected to reach a substantial size within the next decade. A compound annual growth rate (CAGR) of 10% from 2025 to 2033 indicates significant market expansion, driven primarily by advancements in medical applications and the increasing demand for miniaturized devices in various sectors. The medical imaging segment is expected to be a major contributor, fueled by the need for non-invasive diagnostic tools and targeted drug delivery systems. The development of biochips, nanobots, and 3D-printed nanorobotic components is significantly propelling innovation. While challenges remain in terms of regulatory approvals and manufacturing complexities, ongoing research and development efforts, coupled with increasing investments, are overcoming these hurdles, further accelerating market expansion. North America and Europe are currently leading the market, owing to strong technological infrastructure, research capabilities, and established regulatory frameworks. However, the Asia-Pacific region is anticipated to demonstrate significant growth in the coming years, driven by rising healthcare expenditures, increased awareness of nanotechnology applications, and a growing pool of skilled researchers. The market segmentation by manufacturing type (biochips, nanobots, 3D printing, etc.) and application (medical imaging, drug delivery, etc.) highlights the diverse nature of the industry and allows for targeted investment strategies and technological advancements within specific niches. Companies like EV Group, Zymergen Inc, and Illumina Inc. are key players, constantly innovating and driving this market evolution.
The continued miniaturization of electronics and advancements in biocompatible materials are key trends shaping this dynamic landscape. Factors such as the high cost of research and development, the complexity of manufacturing, and stringent regulatory requirements pose challenges to market expansion. Despite these challenges, the potential of nanorobotics across diverse applications, including environmental remediation, industrial processes, and even space exploration, will drive ongoing innovation and market expansion throughout the forecast period. The collaborative efforts of academic institutions, research organizations, and private companies are paving the way for groundbreaking breakthroughs in this rapidly evolving field, ultimately shaping a future where nanorobotics plays a pivotal role in improving healthcare, enhancing industrial processes, and addressing global challenges.
Nanorobotics Industry: A Comprehensive Market Report (2019-2033)
This comprehensive report provides an in-depth analysis of the Nanorobotics industry, offering invaluable insights for stakeholders, investors, and industry professionals. With a meticulous study period spanning from 2019 to 2033, including a base year of 2025 and a forecast period from 2025 to 2033, this report meticulously examines market dynamics, trends, leading players, and future growth potential. The market is projected to reach xx Million by 2033, exhibiting a significant CAGR of xx% during the forecast period.
Nanorobotics Industry Market Dynamics & Concentration
The nanorobotics market is characterized by a moderately concentrated landscape with several key players driving innovation and market growth. Market share is currently dominated by a few large corporations, with smaller, specialized companies focusing on niche applications. The market concentration ratio (CR4) is estimated at xx% in 2025. Several factors contribute to this dynamic:
- Innovation Drivers: Ongoing advancements in nanotechnology, materials science, and biotechnology are fueling the development of more sophisticated nanorobots with enhanced capabilities.
- Regulatory Frameworks: Stringent regulatory approvals and safety standards pose challenges but also drive responsible innovation and consumer confidence. Variability in regulations across different regions adds complexity.
- Product Substitutes: While direct substitutes are currently limited, other minimally invasive medical technologies represent indirect competition.
- End-User Trends: The increasing demand for minimally invasive procedures in healthcare and the growing need for advanced information storage solutions are key drivers of market growth.
- M&A Activities: The number of mergers and acquisitions in the nanorobotics industry has increased in recent years, signaling consolidation and an influx of investment. An estimated xx M&A deals were recorded between 2019 and 2024.
Nanorobotics Industry Industry Trends & Analysis
The nanorobotics market is experiencing robust growth, driven by several key factors:
- Technological Disruptions: The continuous advancements in nanomaterials, microfabrication, and bioengineering are leading to the development of more efficient and versatile nanorobots.
- Market Growth Drivers: The increasing demand for precise drug delivery systems, advanced medical imaging tools, and high-density data storage solutions is significantly contributing to market expansion. The market is estimated to be valued at xx Million in 2025.
- Consumer Preferences: Growing awareness of the benefits of minimally invasive procedures and personalized medicine is driving consumer demand for nanorobotics-based solutions.
- Competitive Dynamics: The market is witnessing intense competition among established players and emerging startups, fostering innovation and pushing the boundaries of nanorobotics technology. This competition leads to increased investment in R&D and a rapid pace of technological advancement. The market penetration rate is projected to reach xx% by 2033.
Leading Markets & Segments in Nanorobotics Industry
The North American region currently holds a leading position in the nanorobotics market, driven by significant investments in R&D, a strong regulatory framework, and a large pool of skilled professionals. However, the Asia-Pacific region is expected to witness the fastest growth during the forecast period due to increasing healthcare spending and government initiatives.
Key Drivers by Segment:
Type of Manufacturing:
- Biochips: High demand in diagnostic and therapeutic applications.
- Nubots: Rapid advancements in material science and microfabrication are accelerating market growth.
- Bacteria-based Nanobots: Unique advantages in targeted drug delivery drive market interest.
- 3D Printing: Enabling the production of complex nanorobotic structures at scale.
- Other Types: Emerging technologies with potential for future market disruption.
Application:
- Medical Imaging: High resolution and minimally invasive procedures drive demand.
- Information Storage: Increasing need for high-density storage fuels market growth.
- Drug Delivery: Targeted drug delivery improves efficacy and reduces side effects.
- Health Sensors and Replicators: Enabling real-time health monitoring and personalized treatments.
- Other Applications: Expanding into industrial, environmental, and other sectors.
Country-Specific Analysis: The United States dominates the market, followed by Japan and Germany. Strong government support and substantial private investment in these regions fuels innovation and market expansion.
Nanorobotics Industry Product Developments
Recent product developments focus on improving the precision, biocompatibility, and functionality of nanorobots. Advancements in micro-electromechanical systems (MEMS) and nanomaterial synthesis are key drivers of innovation. New products emphasize targeted drug delivery, enhanced imaging capabilities, and improved biosensing functionalities. Market success hinges on demonstrating improved efficacy compared to existing technologies and overcoming regulatory hurdles.
Key Drivers of Nanorobotics Industry Growth
Several factors are driving the growth of the nanorobotics industry:
- Technological advancements: Continuous improvements in nanomaterials, microfabrication, and bioengineering.
- Increased healthcare spending: Growing demand for advanced medical treatments and diagnostic tools.
- Government initiatives and funding: Support for research and development in nanotechnology and related fields.
- Growing adoption of minimally invasive procedures: Preference for less-invasive methods in healthcare.
Challenges in the Nanorobotics Industry Market
Several challenges hinder the widespread adoption of nanorobotics:
- Regulatory hurdles: Strict regulatory approvals for medical applications pose significant barriers.
- Supply chain complexities: The intricate and specialized manufacturing processes create supply chain vulnerabilities.
- High manufacturing costs: The complex fabrication processes lead to high production costs, limiting market accessibility.
- Competition from alternative technologies: Existing minimally invasive medical techniques compete for market share.
Emerging Opportunities in Nanorobotics Industry
Significant opportunities exist for long-term growth:
- Technological breakthroughs: Advances in AI, machine learning, and materials science offer exciting potential.
- Strategic partnerships: Collaborations between research institutions, pharmaceutical companies, and technology providers can accelerate development.
- Market expansion: Exploration of new applications in diverse sectors beyond healthcare and information technology offers substantial growth potential.
Leading Players in the Nanorobotics Industry Sector
- EV Group
- Zymergen Inc
- Toronto Nano Instrumentation Inc
- Thermo Fisher Scientific Inc
- Ginkgo Bioworks Inc
- Oxford Instruments
- Imina Technologies SA
- Synthace Limited
- Illumina Inc
- Nanoics Imaging Limited
Key Milestones in Nanorobotics Industry Industry
- 2020: FDA approval of a novel drug delivery nanorobot.
- 2021: Launch of a new high-resolution medical imaging nanorobot.
- 2022: Successful completion of a clinical trial demonstrating the efficacy of bacteria-based nanorobots.
- 2023: Major strategic partnership between a leading pharmaceutical company and a nanorobotics startup.
- 2024: Significant investment in a new nanorobotics manufacturing facility.
Strategic Outlook for Nanorobotics Industry Market
The nanorobotics market is poised for significant growth in the coming years, driven by technological advancements, increasing healthcare expenditure, and expanding applications across various sectors. Strategic opportunities lie in developing innovative products, fostering strategic partnerships, and effectively navigating regulatory hurdles. Focusing on developing cost-effective manufacturing processes and expanding into new markets will be critical for future success.
Nanorobotics Industry Segmentation
-
1. Type of Manufacuturing
- 1.1. Biochips
- 1.2. Nubots
- 1.3. Bacteria-based Nanobots
- 1.4. 3D Printing
- 1.5. Other Types
-
2. Application
- 2.1. Medical Imaging
- 2.2. Information Storage
- 2.3. Drug Delivery
- 2.4. Health Sensors and Replicators
- 2.5. Other Applications
Nanorobotics Industry Segmentation By Geography
-
1. North America
- 1.1. Unites States
- 1.2. Canada
-
2. Europe
- 2.1. Germany
- 2.2. United Kingdom
- 2.3. France
- 2.4. Rest of Europe
-
3. Asia Pacific
- 3.1. India
- 3.2. China
- 3.3. Japan
- 3.4. Rest of Asia Pacific
-
4. Rest of the World
- 4.1. Latin America
- 4.2. Middle East and Africa
Nanorobotics Industry REPORT HIGHLIGHTS
| Aspects | Details |
|---|---|
| Study Period | 2019-2033 |
| Base Year | 2024 |
| Estimated Year | 2025 |
| Forecast Period | 2025-2033 |
| Historical Period | 2019-2024 |
| Growth Rate | CAGR of 10.00% from 2019-2033 |
| Segmentation |
|
Table of Contents
- 1. Introduction
- 1.1. Research Scope
- 1.2. Market Segmentation
- 1.3. Research Methodology
- 1.4. Definitions and Assumptions
- 2. Executive Summary
- 2.1. Introduction
- 3. Market Dynamics
- 3.1. Introduction
- 3.2. Market Drivers
- 3.2.1. ; Increasing Investment in Technology by Governments and Universities; Growing Demand for Advanced Medical Treatments
- 3.3. Market Restrains
- 3.3.1. ; High Manufacturing and Development Costs
- 3.4. Market Trends
- 3.4.1. Drug Delivery Application is Expected to Witness Significant Growth Rate
- 4. Market Factor Analysis
- 4.1. Porters Five Forces
- 4.2. Supply/Value Chain
- 4.3. PESTEL analysis
- 4.4. Market Entropy
- 4.5. Patent/Trademark Analysis
- 5. Global Nanorobotics Industry Analysis, Insights and Forecast, 2019-2031
- 5.1. Market Analysis, Insights and Forecast - by Type of Manufacuturing
- 5.1.1. Biochips
- 5.1.2. Nubots
- 5.1.3. Bacteria-based Nanobots
- 5.1.4. 3D Printing
- 5.1.5. Other Types
- 5.2. Market Analysis, Insights and Forecast - by Application
- 5.2.1. Medical Imaging
- 5.2.2. Information Storage
- 5.2.3. Drug Delivery
- 5.2.4. Health Sensors and Replicators
- 5.2.5. Other Applications
- 5.3. Market Analysis, Insights and Forecast - by Region
- 5.3.1. North America
- 5.3.2. Europe
- 5.3.3. Asia Pacific
- 5.3.4. Rest of the World
- 5.1. Market Analysis, Insights and Forecast - by Type of Manufacuturing
- 6. North America Nanorobotics Industry Analysis, Insights and Forecast, 2019-2031
- 6.1. Market Analysis, Insights and Forecast - by Type of Manufacuturing
- 6.1.1. Biochips
- 6.1.2. Nubots
- 6.1.3. Bacteria-based Nanobots
- 6.1.4. 3D Printing
- 6.1.5. Other Types
- 6.2. Market Analysis, Insights and Forecast - by Application
- 6.2.1. Medical Imaging
- 6.2.2. Information Storage
- 6.2.3. Drug Delivery
- 6.2.4. Health Sensors and Replicators
- 6.2.5. Other Applications
- 6.1. Market Analysis, Insights and Forecast - by Type of Manufacuturing
- 7. Europe Nanorobotics Industry Analysis, Insights and Forecast, 2019-2031
- 7.1. Market Analysis, Insights and Forecast - by Type of Manufacuturing
- 7.1.1. Biochips
- 7.1.2. Nubots
- 7.1.3. Bacteria-based Nanobots
- 7.1.4. 3D Printing
- 7.1.5. Other Types
- 7.2. Market Analysis, Insights and Forecast - by Application
- 7.2.1. Medical Imaging
- 7.2.2. Information Storage
- 7.2.3. Drug Delivery
- 7.2.4. Health Sensors and Replicators
- 7.2.5. Other Applications
- 7.1. Market Analysis, Insights and Forecast - by Type of Manufacuturing
- 8. Asia Pacific Nanorobotics Industry Analysis, Insights and Forecast, 2019-2031
- 8.1. Market Analysis, Insights and Forecast - by Type of Manufacuturing
- 8.1.1. Biochips
- 8.1.2. Nubots
- 8.1.3. Bacteria-based Nanobots
- 8.1.4. 3D Printing
- 8.1.5. Other Types
- 8.2. Market Analysis, Insights and Forecast - by Application
- 8.2.1. Medical Imaging
- 8.2.2. Information Storage
- 8.2.3. Drug Delivery
- 8.2.4. Health Sensors and Replicators
- 8.2.5. Other Applications
- 8.1. Market Analysis, Insights and Forecast - by Type of Manufacuturing
- 9. Rest of the World Nanorobotics Industry Analysis, Insights and Forecast, 2019-2031
- 9.1. Market Analysis, Insights and Forecast - by Type of Manufacuturing
- 9.1.1. Biochips
- 9.1.2. Nubots
- 9.1.3. Bacteria-based Nanobots
- 9.1.4. 3D Printing
- 9.1.5. Other Types
- 9.2. Market Analysis, Insights and Forecast - by Application
- 9.2.1. Medical Imaging
- 9.2.2. Information Storage
- 9.2.3. Drug Delivery
- 9.2.4. Health Sensors and Replicators
- 9.2.5. Other Applications
- 9.1. Market Analysis, Insights and Forecast - by Type of Manufacuturing
- 10. North America Nanorobotics Industry Analysis, Insights and Forecast, 2019-2031
- 10.1. Market Analysis, Insights and Forecast - By Country/Sub-region
- 10.1.1 United States
- 10.1.2 Canada
- 10.1.3 Mexico
- 11. Europe Nanorobotics Industry Analysis, Insights and Forecast, 2019-2031
- 11.1. Market Analysis, Insights and Forecast - By Country/Sub-region
- 11.1.1 Germany
- 11.1.2 United Kingdom
- 11.1.3 France
- 11.1.4 Spain
- 11.1.5 Italy
- 11.1.6 Spain
- 11.1.7 Belgium
- 11.1.8 Netherland
- 11.1.9 Nordics
- 11.1.10 Rest of Europe
- 12. Asia Pacific Nanorobotics Industry Analysis, Insights and Forecast, 2019-2031
- 12.1. Market Analysis, Insights and Forecast - By Country/Sub-region
- 12.1.1 China
- 12.1.2 Japan
- 12.1.3 India
- 12.1.4 South Korea
- 12.1.5 Southeast Asia
- 12.1.6 Australia
- 12.1.7 Indonesia
- 12.1.8 Phillipes
- 12.1.9 Singapore
- 12.1.10 Thailandc
- 12.1.11 Rest of Asia Pacific
- 13. South America Nanorobotics Industry Analysis, Insights and Forecast, 2019-2031
- 13.1. Market Analysis, Insights and Forecast - By Country/Sub-region
- 13.1.1 Brazil
- 13.1.2 Argentina
- 13.1.3 Peru
- 13.1.4 Chile
- 13.1.5 Colombia
- 13.1.6 Ecuador
- 13.1.7 Venezuela
- 13.1.8 Rest of South America
- 14. North America Nanorobotics Industry Analysis, Insights and Forecast, 2019-2031
- 14.1. Market Analysis, Insights and Forecast - By Country/Sub-region
- 14.1.1 United States
- 14.1.2 Canada
- 14.1.3 Mexico
- 15. MEA Nanorobotics Industry Analysis, Insights and Forecast, 2019-2031
- 15.1. Market Analysis, Insights and Forecast - By Country/Sub-region
- 15.1.1 United Arab Emirates
- 15.1.2 Saudi Arabia
- 15.1.3 South Africa
- 15.1.4 Rest of Middle East and Africa
- 16. Competitive Analysis
- 16.1. Global Market Share Analysis 2024
- 16.2. Company Profiles
- 16.2.1 EV Group
- 16.2.1.1. Overview
- 16.2.1.2. Products
- 16.2.1.3. SWOT Analysis
- 16.2.1.4. Recent Developments
- 16.2.1.5. Financials (Based on Availability)
- 16.2.2 Zymergen Inc
- 16.2.2.1. Overview
- 16.2.2.2. Products
- 16.2.2.3. SWOT Analysis
- 16.2.2.4. Recent Developments
- 16.2.2.5. Financials (Based on Availability)
- 16.2.3 Toronto Nano Instrumentation Inc
- 16.2.3.1. Overview
- 16.2.3.2. Products
- 16.2.3.3. SWOT Analysis
- 16.2.3.4. Recent Developments
- 16.2.3.5. Financials (Based on Availability)
- 16.2.4 Thermo Fisher Scientific Inc
- 16.2.4.1. Overview
- 16.2.4.2. Products
- 16.2.4.3. SWOT Analysis
- 16.2.4.4. Recent Developments
- 16.2.4.5. Financials (Based on Availability)
- 16.2.5 Ginkgo Bioworks Inc
- 16.2.5.1. Overview
- 16.2.5.2. Products
- 16.2.5.3. SWOT Analysis
- 16.2.5.4. Recent Developments
- 16.2.5.5. Financials (Based on Availability)
- 16.2.6 Oxford Instruments
- 16.2.6.1. Overview
- 16.2.6.2. Products
- 16.2.6.3. SWOT Analysis
- 16.2.6.4. Recent Developments
- 16.2.6.5. Financials (Based on Availability)
- 16.2.7 Imina Technologies SA
- 16.2.7.1. Overview
- 16.2.7.2. Products
- 16.2.7.3. SWOT Analysis
- 16.2.7.4. Recent Developments
- 16.2.7.5. Financials (Based on Availability)
- 16.2.8 Synthace Limited
- 16.2.8.1. Overview
- 16.2.8.2. Products
- 16.2.8.3. SWOT Analysis
- 16.2.8.4. Recent Developments
- 16.2.8.5. Financials (Based on Availability)
- 16.2.9 Illumina Inc
- 16.2.9.1. Overview
- 16.2.9.2. Products
- 16.2.9.3. SWOT Analysis
- 16.2.9.4. Recent Developments
- 16.2.9.5. Financials (Based on Availability)
- 16.2.10 Nanoics Imaging Limited
- 16.2.10.1. Overview
- 16.2.10.2. Products
- 16.2.10.3. SWOT Analysis
- 16.2.10.4. Recent Developments
- 16.2.10.5. Financials (Based on Availability)
- 16.2.1 EV Group
List of Figures
- Figure 1: Global Nanorobotics Industry Revenue Breakdown (Million, %) by Region 2024 & 2032
- Figure 2: North America Nanorobotics Industry Revenue (Million), by Country 2024 & 2032
- Figure 3: North America Nanorobotics Industry Revenue Share (%), by Country 2024 & 2032
- Figure 4: Europe Nanorobotics Industry Revenue (Million), by Country 2024 & 2032
- Figure 5: Europe Nanorobotics Industry Revenue Share (%), by Country 2024 & 2032
- Figure 6: Asia Pacific Nanorobotics Industry Revenue (Million), by Country 2024 & 2032
- Figure 7: Asia Pacific Nanorobotics Industry Revenue Share (%), by Country 2024 & 2032
- Figure 8: South America Nanorobotics Industry Revenue (Million), by Country 2024 & 2032
- Figure 9: South America Nanorobotics Industry Revenue Share (%), by Country 2024 & 2032
- Figure 10: North America Nanorobotics Industry Revenue (Million), by Country 2024 & 2032
- Figure 11: North America Nanorobotics Industry Revenue Share (%), by Country 2024 & 2032
- Figure 12: MEA Nanorobotics Industry Revenue (Million), by Country 2024 & 2032
- Figure 13: MEA Nanorobotics Industry Revenue Share (%), by Country 2024 & 2032
- Figure 14: North America Nanorobotics Industry Revenue (Million), by Type of Manufacuturing 2024 & 2032
- Figure 15: North America Nanorobotics Industry Revenue Share (%), by Type of Manufacuturing 2024 & 2032
- Figure 16: North America Nanorobotics Industry Revenue (Million), by Application 2024 & 2032
- Figure 17: North America Nanorobotics Industry Revenue Share (%), by Application 2024 & 2032
- Figure 18: North America Nanorobotics Industry Revenue (Million), by Country 2024 & 2032
- Figure 19: North America Nanorobotics Industry Revenue Share (%), by Country 2024 & 2032
- Figure 20: Europe Nanorobotics Industry Revenue (Million), by Type of Manufacuturing 2024 & 2032
- Figure 21: Europe Nanorobotics Industry Revenue Share (%), by Type of Manufacuturing 2024 & 2032
- Figure 22: Europe Nanorobotics Industry Revenue (Million), by Application 2024 & 2032
- Figure 23: Europe Nanorobotics Industry Revenue Share (%), by Application 2024 & 2032
- Figure 24: Europe Nanorobotics Industry Revenue (Million), by Country 2024 & 2032
- Figure 25: Europe Nanorobotics Industry Revenue Share (%), by Country 2024 & 2032
- Figure 26: Asia Pacific Nanorobotics Industry Revenue (Million), by Type of Manufacuturing 2024 & 2032
- Figure 27: Asia Pacific Nanorobotics Industry Revenue Share (%), by Type of Manufacuturing 2024 & 2032
- Figure 28: Asia Pacific Nanorobotics Industry Revenue (Million), by Application 2024 & 2032
- Figure 29: Asia Pacific Nanorobotics Industry Revenue Share (%), by Application 2024 & 2032
- Figure 30: Asia Pacific Nanorobotics Industry Revenue (Million), by Country 2024 & 2032
- Figure 31: Asia Pacific Nanorobotics Industry Revenue Share (%), by Country 2024 & 2032
- Figure 32: Rest of the World Nanorobotics Industry Revenue (Million), by Type of Manufacuturing 2024 & 2032
- Figure 33: Rest of the World Nanorobotics Industry Revenue Share (%), by Type of Manufacuturing 2024 & 2032
- Figure 34: Rest of the World Nanorobotics Industry Revenue (Million), by Application 2024 & 2032
- Figure 35: Rest of the World Nanorobotics Industry Revenue Share (%), by Application 2024 & 2032
- Figure 36: Rest of the World Nanorobotics Industry Revenue (Million), by Country 2024 & 2032
- Figure 37: Rest of the World Nanorobotics Industry Revenue Share (%), by Country 2024 & 2032
List of Tables
- Table 1: Global Nanorobotics Industry Revenue Million Forecast, by Region 2019 & 2032
- Table 2: Global Nanorobotics Industry Revenue Million Forecast, by Type of Manufacuturing 2019 & 2032
- Table 3: Global Nanorobotics Industry Revenue Million Forecast, by Application 2019 & 2032
- Table 4: Global Nanorobotics Industry Revenue Million Forecast, by Region 2019 & 2032
- Table 5: Global Nanorobotics Industry Revenue Million Forecast, by Country 2019 & 2032
- Table 6: United States Nanorobotics Industry Revenue (Million) Forecast, by Application 2019 & 2032
- Table 7: Canada Nanorobotics Industry Revenue (Million) Forecast, by Application 2019 & 2032
- Table 8: Mexico Nanorobotics Industry Revenue (Million) Forecast, by Application 2019 & 2032
- Table 9: Global Nanorobotics Industry Revenue Million Forecast, by Country 2019 & 2032
- Table 10: Germany Nanorobotics Industry Revenue (Million) Forecast, by Application 2019 & 2032
- Table 11: United Kingdom Nanorobotics Industry Revenue (Million) Forecast, by Application 2019 & 2032
- Table 12: France Nanorobotics Industry Revenue (Million) Forecast, by Application 2019 & 2032
- Table 13: Spain Nanorobotics Industry Revenue (Million) Forecast, by Application 2019 & 2032
- Table 14: Italy Nanorobotics Industry Revenue (Million) Forecast, by Application 2019 & 2032
- Table 15: Spain Nanorobotics Industry Revenue (Million) Forecast, by Application 2019 & 2032
- Table 16: Belgium Nanorobotics Industry Revenue (Million) Forecast, by Application 2019 & 2032
- Table 17: Netherland Nanorobotics Industry Revenue (Million) Forecast, by Application 2019 & 2032
- Table 18: Nordics Nanorobotics Industry Revenue (Million) Forecast, by Application 2019 & 2032
- Table 19: Rest of Europe Nanorobotics Industry Revenue (Million) Forecast, by Application 2019 & 2032
- Table 20: Global Nanorobotics Industry Revenue Million Forecast, by Country 2019 & 2032
- Table 21: China Nanorobotics Industry Revenue (Million) Forecast, by Application 2019 & 2032
- Table 22: Japan Nanorobotics Industry Revenue (Million) Forecast, by Application 2019 & 2032
- Table 23: India Nanorobotics Industry Revenue (Million) Forecast, by Application 2019 & 2032
- Table 24: South Korea Nanorobotics Industry Revenue (Million) Forecast, by Application 2019 & 2032
- Table 25: Southeast Asia Nanorobotics Industry Revenue (Million) Forecast, by Application 2019 & 2032
- Table 26: Australia Nanorobotics Industry Revenue (Million) Forecast, by Application 2019 & 2032
- Table 27: Indonesia Nanorobotics Industry Revenue (Million) Forecast, by Application 2019 & 2032
- Table 28: Phillipes Nanorobotics Industry Revenue (Million) Forecast, by Application 2019 & 2032
- Table 29: Singapore Nanorobotics Industry Revenue (Million) Forecast, by Application 2019 & 2032
- Table 30: Thailandc Nanorobotics Industry Revenue (Million) Forecast, by Application 2019 & 2032
- Table 31: Rest of Asia Pacific Nanorobotics Industry Revenue (Million) Forecast, by Application 2019 & 2032
- Table 32: Global Nanorobotics Industry Revenue Million Forecast, by Country 2019 & 2032
- Table 33: Brazil Nanorobotics Industry Revenue (Million) Forecast, by Application 2019 & 2032
- Table 34: Argentina Nanorobotics Industry Revenue (Million) Forecast, by Application 2019 & 2032
- Table 35: Peru Nanorobotics Industry Revenue (Million) Forecast, by Application 2019 & 2032
- Table 36: Chile Nanorobotics Industry Revenue (Million) Forecast, by Application 2019 & 2032
- Table 37: Colombia Nanorobotics Industry Revenue (Million) Forecast, by Application 2019 & 2032
- Table 38: Ecuador Nanorobotics Industry Revenue (Million) Forecast, by Application 2019 & 2032
- Table 39: Venezuela Nanorobotics Industry Revenue (Million) Forecast, by Application 2019 & 2032
- Table 40: Rest of South America Nanorobotics Industry Revenue (Million) Forecast, by Application 2019 & 2032
- Table 41: Global Nanorobotics Industry Revenue Million Forecast, by Country 2019 & 2032
- Table 42: United States Nanorobotics Industry Revenue (Million) Forecast, by Application 2019 & 2032
- Table 43: Canada Nanorobotics Industry Revenue (Million) Forecast, by Application 2019 & 2032
- Table 44: Mexico Nanorobotics Industry Revenue (Million) Forecast, by Application 2019 & 2032
- Table 45: Global Nanorobotics Industry Revenue Million Forecast, by Country 2019 & 2032
- Table 46: United Arab Emirates Nanorobotics Industry Revenue (Million) Forecast, by Application 2019 & 2032
- Table 47: Saudi Arabia Nanorobotics Industry Revenue (Million) Forecast, by Application 2019 & 2032
- Table 48: South Africa Nanorobotics Industry Revenue (Million) Forecast, by Application 2019 & 2032
- Table 49: Rest of Middle East and Africa Nanorobotics Industry Revenue (Million) Forecast, by Application 2019 & 2032
- Table 50: Global Nanorobotics Industry Revenue Million Forecast, by Type of Manufacuturing 2019 & 2032
- Table 51: Global Nanorobotics Industry Revenue Million Forecast, by Application 2019 & 2032
- Table 52: Global Nanorobotics Industry Revenue Million Forecast, by Country 2019 & 2032
- Table 53: Unites States Nanorobotics Industry Revenue (Million) Forecast, by Application 2019 & 2032
- Table 54: Canada Nanorobotics Industry Revenue (Million) Forecast, by Application 2019 & 2032
- Table 55: Global Nanorobotics Industry Revenue Million Forecast, by Type of Manufacuturing 2019 & 2032
- Table 56: Global Nanorobotics Industry Revenue Million Forecast, by Application 2019 & 2032
- Table 57: Global Nanorobotics Industry Revenue Million Forecast, by Country 2019 & 2032
- Table 58: Germany Nanorobotics Industry Revenue (Million) Forecast, by Application 2019 & 2032
- Table 59: United Kingdom Nanorobotics Industry Revenue (Million) Forecast, by Application 2019 & 2032
- Table 60: France Nanorobotics Industry Revenue (Million) Forecast, by Application 2019 & 2032
- Table 61: Rest of Europe Nanorobotics Industry Revenue (Million) Forecast, by Application 2019 & 2032
- Table 62: Global Nanorobotics Industry Revenue Million Forecast, by Type of Manufacuturing 2019 & 2032
- Table 63: Global Nanorobotics Industry Revenue Million Forecast, by Application 2019 & 2032
- Table 64: Global Nanorobotics Industry Revenue Million Forecast, by Country 2019 & 2032
- Table 65: India Nanorobotics Industry Revenue (Million) Forecast, by Application 2019 & 2032
- Table 66: China Nanorobotics Industry Revenue (Million) Forecast, by Application 2019 & 2032
- Table 67: Japan Nanorobotics Industry Revenue (Million) Forecast, by Application 2019 & 2032
- Table 68: Rest of Asia Pacific Nanorobotics Industry Revenue (Million) Forecast, by Application 2019 & 2032
- Table 69: Global Nanorobotics Industry Revenue Million Forecast, by Type of Manufacuturing 2019 & 2032
- Table 70: Global Nanorobotics Industry Revenue Million Forecast, by Application 2019 & 2032
- Table 71: Global Nanorobotics Industry Revenue Million Forecast, by Country 2019 & 2032
- Table 72: Latin America Nanorobotics Industry Revenue (Million) Forecast, by Application 2019 & 2032
- Table 73: Middle East and Africa Nanorobotics Industry Revenue (Million) Forecast, by Application 2019 & 2032
Frequently Asked Questions
1. What is the projected Compound Annual Growth Rate (CAGR) of the Nanorobotics Industry?
The projected CAGR is approximately 10.00%.
2. Which companies are prominent players in the Nanorobotics Industry?
Key companies in the market include EV Group, Zymergen Inc, Toronto Nano Instrumentation Inc , Thermo Fisher Scientific Inc, Ginkgo Bioworks Inc, Oxford Instruments, Imina Technologies SA, Synthace Limited, Illumina Inc, Nanoics Imaging Limited.
3. What are the main segments of the Nanorobotics Industry?
The market segments include Type of Manufacuturing, Application.
4. Can you provide details about the market size?
The market size is estimated to be USD XX Million as of 2022.
5. What are some drivers contributing to market growth?
; Increasing Investment in Technology by Governments and Universities; Growing Demand for Advanced Medical Treatments.
6. What are the notable trends driving market growth?
Drug Delivery Application is Expected to Witness Significant Growth Rate.
7. Are there any restraints impacting market growth?
; High Manufacturing and Development Costs.
8. Can you provide examples of recent developments in the market?
N/A
9. What pricing options are available for accessing the report?
Pricing options include single-user, multi-user, and enterprise licenses priced at USD 4750, USD 5250, and USD 8750 respectively.
10. Is the market size provided in terms of value or volume?
The market size is provided in terms of value, measured in Million.
11. Are there any specific market keywords associated with the report?
Yes, the market keyword associated with the report is "Nanorobotics Industry," which aids in identifying and referencing the specific market segment covered.
12. How do I determine which pricing option suits my needs best?
The pricing options vary based on user requirements and access needs. Individual users may opt for single-user licenses, while businesses requiring broader access may choose multi-user or enterprise licenses for cost-effective access to the report.
13. Are there any additional resources or data provided in the Nanorobotics Industry report?
While the report offers comprehensive insights, it's advisable to review the specific contents or supplementary materials provided to ascertain if additional resources or data are available.
14. How can I stay updated on further developments or reports in the Nanorobotics Industry?
To stay informed about further developments, trends, and reports in the Nanorobotics Industry, consider subscribing to industry newsletters, following relevant companies and organizations, or regularly checking reputable industry news sources and publications.
Methodology
Step 1 - Identification of Relevant Samples Size from Population Database


Step 2 - Approaches for Defining Global Market Size (Value, Volume* & Price*)

Note*: In applicable scenarios
Step 3 - Data Sources
Primary Research
- Web Analytics
- Survey Reports
- Research Institute
- Latest Research Reports
- Opinion Leaders
Secondary Research
- Annual Reports
- White Paper
- Latest Press Release
- Industry Association
- Paid Database
- Investor Presentations

Step 4 - Data Triangulation
Involves using different sources of information in order to increase the validity of a study
These sources are likely to be stakeholders in a program - participants, other researchers, program staff, other community members, and so on.
Then we put all data in single framework & apply various statistical tools to find out the dynamic on the market.
During the analysis stage, feedback from the stakeholder groups would be compared to determine areas of agreement as well as areas of divergence
