

Key Insights
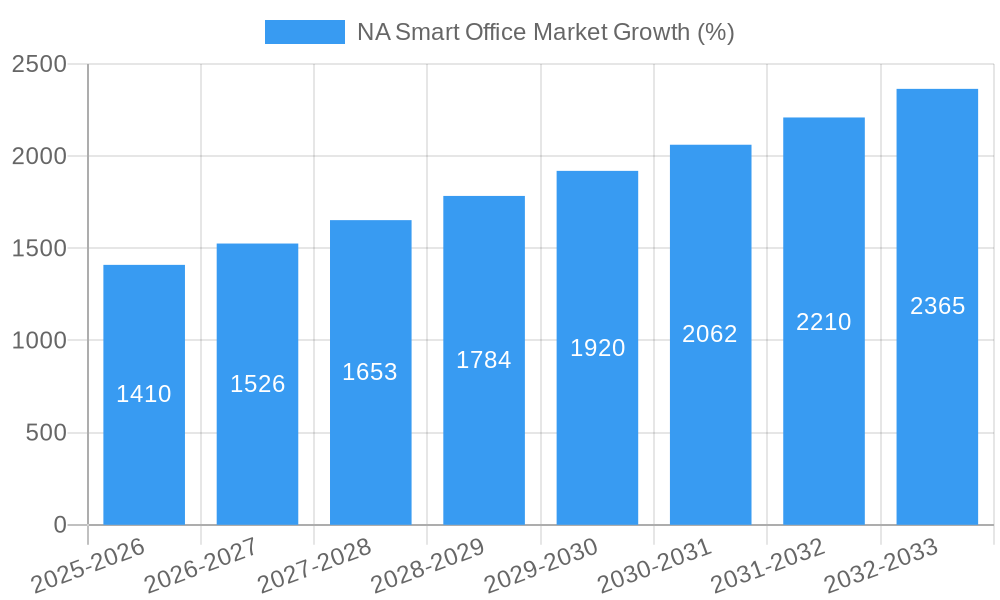
The North American smart office market is experiencing robust growth, driven by the increasing adoption of smart technologies to enhance building efficiency, security, and occupant experience. The market's expansion is fueled by several key factors. Firstly, the rising demand for energy-efficient solutions is pushing businesses to adopt smart energy management systems and smart HVAC controls, leading to significant cost savings in the long run. Secondly, heightened security concerns are driving the adoption of advanced security and access control systems, which offer greater control and protection against unauthorized access. Thirdly, the increasing popularity of hybrid and remote work models is bolstering the need for seamless audio-video conferencing systems, ensuring effective communication and collaboration. Finally, the expanding retrofit market presents significant growth opportunities, as older buildings are upgraded with smart technologies to improve functionality and sustainability.
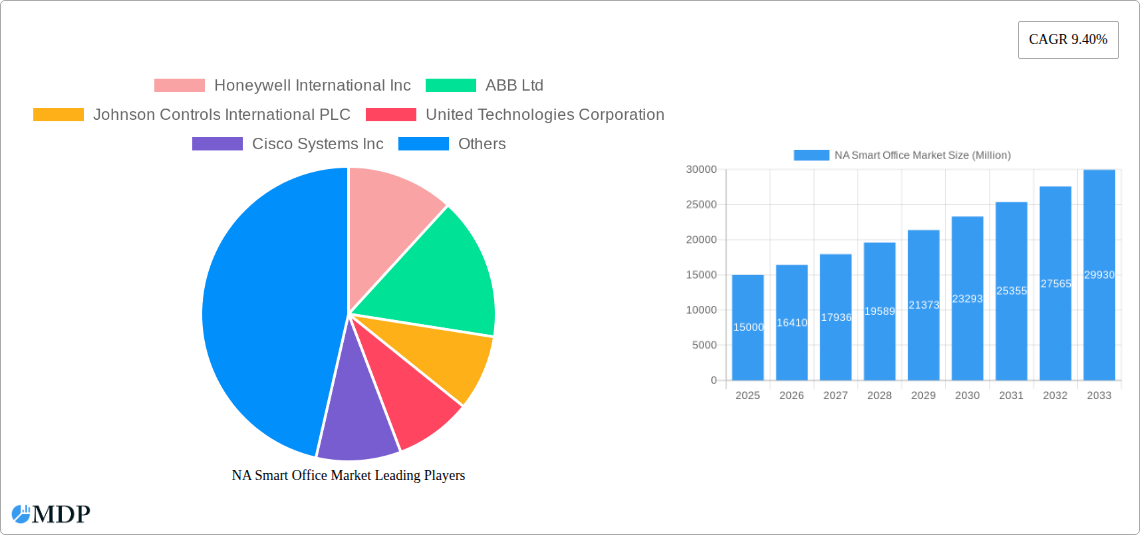
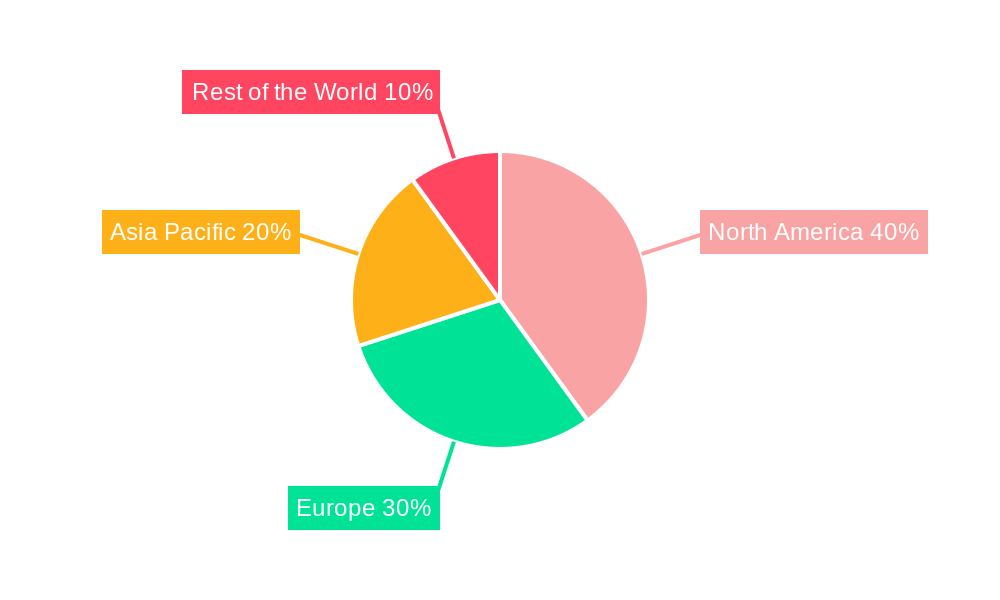
While the market faces challenges like high initial investment costs and concerns regarding data security and privacy, the long-term benefits of enhanced efficiency, security, and employee productivity are outweighing these concerns. The market is segmented by product type (smart office lighting, security systems, energy management, HVAC, audio-video conferencing, fire safety), building type (retrofits, new construction), and geography (United States, Canada). Major players, including Honeywell, Johnson Controls, Siemens, and others, are actively investing in R&D and strategic partnerships to expand their market share and capitalize on this growth trajectory. The North American market, with its advanced infrastructure and technology adoption rate, is expected to remain a key driver of global growth in the smart office sector throughout the forecast period (2025-2033). Considering the provided CAGR of 9.40%, and a logical assumption that North America holds a significant share of the global market (estimated at 40% for illustrative purposes), substantial growth is anticipated, with significant contributions from both new construction and retrofit projects.
North America Smart Office Market Report: 2019-2033
This comprehensive report provides an in-depth analysis of the North America (NA) smart office market, offering invaluable insights for industry stakeholders, investors, and strategic decision-makers. With a study period spanning 2019-2033, a base year of 2025, and a forecast period of 2025-2033, this report delivers a complete picture of market dynamics, trends, and future potential. The market is projected to reach xx Million by 2033, exhibiting a CAGR of xx% during the forecast period. Key players analyzed include Honeywell International Inc, ABB Ltd, Johnson Controls International PLC, United Technologies Corporation, Cisco Systems Inc, Lutron Electronics Co Inc, Siemens AG, Schneider Electric SE, Koninklijke Philips NV, Enlighted Inc, Crestron Electronics Inc, and FogHorn Systems Inc. This is not an exhaustive list.
NA Smart Office Market Market Dynamics & Concentration
The NA smart office market is characterized by moderate concentration, with several major players holding significant market share. However, the market also exhibits a vibrant competitive landscape with numerous smaller companies vying for market position. Innovation is a key driver, with continuous advancements in areas such as AI-powered building management systems, IoT integration, and advanced security solutions. Regulatory frameworks, including energy efficiency standards and data privacy regulations, significantly influence market growth. Product substitutes, such as traditional office equipment, pose a challenge, particularly in cost-sensitive segments. End-user trends, including a growing emphasis on sustainability and employee well-being, are driving demand for smart office solutions.
- Market Concentration: The top 5 players hold approximately xx% of the market share in 2025.
- M&A Activity: A total of xx M&A deals were recorded between 2019 and 2024. The acquisition of Cylon Controls by ABB in March 2020 exemplifies the strategic consolidation within the sector.
- Innovation Drivers: AI, IoT, and cloud computing are key technological drivers.
- Regulatory Impact: Energy efficiency regulations and data privacy laws are shaping market dynamics.
- End-User Trends: Sustainability and employee well-being are driving adoption of smart office technologies.
NA Smart Office Market Industry Trends & Analysis
The NA smart office market is experiencing robust growth, driven by several factors. Increased awareness of energy efficiency and sustainability is pushing organizations to adopt smart building technologies. Technological advancements, such as the Internet of Things (IoT) and artificial intelligence (AI), are enabling more sophisticated and integrated solutions. Consumer preferences are shifting towards workplaces that enhance productivity, comfort, and safety. The competitive landscape is dynamic, with ongoing innovation and strategic alliances shaping market dynamics. The market penetration of smart office solutions is expected to reach xx% by 2033, fueled by a robust growth trajectory.
The market is witnessing increased adoption of smart office solutions across various sectors. The rising need for enhanced security and improved energy efficiency, along with the increasing awareness of sustainability and the integration of smart technologies in workplaces, are driving market growth. Technological advancements such as cloud-based solutions and artificial intelligence (AI) are enabling more sophisticated and integrated systems that enhance the efficiency, productivity, and user experience of smart offices. The competitive landscape is expected to become more intensified over the forecast period.
Leading Markets & Segments in NA Smart Office Market
The United States dominates the NA smart office market, driven by a robust economy, advanced technological infrastructure, and a higher adoption rate of smart technologies. Within the product type segment, Smart Office Lighting and Energy Management Systems hold the largest market shares, reflecting the strong focus on sustainability and cost optimization. The retrofit segment exhibits higher growth potential compared to new buildings, driven by existing infrastructure upgrades.
- Dominant Region: United States
- Dominant Product Type: Smart Office Lighting and Energy Management Systems
- Dominant Building Type: Retrofits
- Key Drivers (US): Strong economy, advanced technological infrastructure, favorable government policies.
- Key Drivers (Canada): Government initiatives promoting sustainable building practices, growing adoption of smart technologies in commercial buildings.
NA Smart Office Market Product Developments
Recent product innovations emphasize integration, interoperability, and user-friendly interfaces. Smart building platforms that combine multiple systems into a single, unified solution are gaining popularity. The focus is shifting towards AI-powered solutions that optimize energy consumption, enhance security, and improve occupant experience. These developments are improving the market fit by addressing cost-effectiveness, ease of installation and management, and long-term efficiency gains.
Key Drivers of NA Smart Office Market Growth
Technological advancements, particularly in IoT, AI, and cloud computing, are significantly driving market growth. Government initiatives promoting energy efficiency and sustainable building practices are providing further impetus. The increasing adoption of smart office solutions by large corporations and enterprises is further accelerating market expansion. For instance, the rising adoption of IoT devices in commercial buildings is boosting the demand for smart office solutions.
Challenges in the NA Smart Office Market Market
High initial investment costs associated with implementing smart office solutions can be a significant barrier to entry for smaller businesses. Concerns surrounding data security and privacy pose another challenge. The complexity of integrating diverse systems and the lack of skilled labor can also impede market growth. The competitive landscape with established players and numerous new entrants poses a challenge for market penetration. The estimated impact of these challenges is a reduction in overall market growth by approximately xx% by 2033.
Emerging Opportunities in NA Smart Office Market
The integration of 5G technology, advancements in AI-powered analytics, and the emergence of edge computing present significant growth opportunities. Strategic partnerships between technology providers and building management companies can unlock new market segments. Expanding into underserved markets and developing customized solutions for specific industries will further propel market growth. The increasing focus on remote work solutions is also driving significant growth in this market.
Leading Players in the NA Smart Office Market Sector
- Honeywell International Inc
- ABB Ltd
- Johnson Controls International PLC
- United Technologies Corporation
- Cisco Systems Inc
- Lutron Electronics Co Inc
- Siemens AG
- Schneider Electric SE
- Koninklijke Philips NV
- Enlighted Inc
- Crestron Electronics Inc
- FogHorn Systems Inc
Key Milestones in NA Smart Office Market Industry
- March 2020: ABB acquired Cylon Controls, expanding its smart building portfolio and strengthening its position in the market.
Strategic Outlook for NA Smart Office Market Market
The NA smart office market holds significant long-term growth potential, driven by technological advancements, increasing demand for sustainable and efficient workplaces, and favorable government policies. Strategic investments in R&D, strategic partnerships, and expansion into new markets will be crucial for companies to capitalize on this growth opportunity. The market’s future potential is significant, with continued growth expected as technological advancements become more integrated and accessible.
NA Smart Office Market Segmentation
-
1. Product Type
- 1.1. Smart Office Lighting
- 1.2. Security and Access Control System
- 1.3. Energy Management System
- 1.4. Smart HVAC Control System
- 1.5. Audio-video Conferencing System
- 1.6. Fire and Safety Control System
-
2. Building Type
- 2.1. Retrofits
- 2.2. New Buildings
NA Smart Office Market Segmentation By Geography
-
1. North America
- 1.1. United States
- 1.2. Canada
- 1.3. Mexico
-
2. South America
- 2.1. Brazil
- 2.2. Argentina
- 2.3. Rest of South America
-
3. Europe
- 3.1. United Kingdom
- 3.2. Germany
- 3.3. France
- 3.4. Italy
- 3.5. Spain
- 3.6. Russia
- 3.7. Benelux
- 3.8. Nordics
- 3.9. Rest of Europe
-
4. Middle East & Africa
- 4.1. Turkey
- 4.2. Israel
- 4.3. GCC
- 4.4. North Africa
- 4.5. South Africa
- 4.6. Rest of Middle East & Africa
-
5. Asia Pacific
- 5.1. China
- 5.2. India
- 5.3. Japan
- 5.4. South Korea
- 5.5. ASEAN
- 5.6. Oceania
- 5.7. Rest of Asia Pacific
NA Smart Office Market REPORT HIGHLIGHTS
| Aspects | Details |
|---|---|
| Study Period | 2019-2033 |
| Base Year | 2024 |
| Estimated Year | 2025 |
| Forecast Period | 2025-2033 |
| Historical Period | 2019-2024 |
| Growth Rate | CAGR of 9.40% from 2019-2033 |
| Segmentation |
|
Table of Contents
- 1. Introduction
- 1.1. Research Scope
- 1.2. Market Segmentation
- 1.3. Research Methodology
- 1.4. Definitions and Assumptions
- 2. Executive Summary
- 2.1. Introduction
- 3. Market Dynamics
- 3.1. Introduction
- 3.2. Market Drivers
- 3.2.1. Increasing Demand for Energy Efficient Solutions; Growing Need for Automation of Security Systems
- 3.3. Market Restrains
- 3.3.1. High Cost of Connected Systems
- 3.4. Market Trends
- 3.4.1. Security and Access Control to Witness Significant Growth
- 4. Market Factor Analysis
- 4.1. Porters Five Forces
- 4.2. Supply/Value Chain
- 4.3. PESTEL analysis
- 4.4. Market Entropy
- 4.5. Patent/Trademark Analysis
- 5. Global NA Smart Office Market Analysis, Insights and Forecast, 2019-2031
- 5.1. Market Analysis, Insights and Forecast - by Product Type
- 5.1.1. Smart Office Lighting
- 5.1.2. Security and Access Control System
- 5.1.3. Energy Management System
- 5.1.4. Smart HVAC Control System
- 5.1.5. Audio-video Conferencing System
- 5.1.6. Fire and Safety Control System
- 5.2. Market Analysis, Insights and Forecast - by Building Type
- 5.2.1. Retrofits
- 5.2.2. New Buildings
- 5.3. Market Analysis, Insights and Forecast - by Region
- 5.3.1. North America
- 5.3.2. South America
- 5.3.3. Europe
- 5.3.4. Middle East & Africa
- 5.3.5. Asia Pacific
- 5.1. Market Analysis, Insights and Forecast - by Product Type
- 6. North America NA Smart Office Market Analysis, Insights and Forecast, 2019-2031
- 6.1. Market Analysis, Insights and Forecast - by Product Type
- 6.1.1. Smart Office Lighting
- 6.1.2. Security and Access Control System
- 6.1.3. Energy Management System
- 6.1.4. Smart HVAC Control System
- 6.1.5. Audio-video Conferencing System
- 6.1.6. Fire and Safety Control System
- 6.2. Market Analysis, Insights and Forecast - by Building Type
- 6.2.1. Retrofits
- 6.2.2. New Buildings
- 6.1. Market Analysis, Insights and Forecast - by Product Type
- 7. South America NA Smart Office Market Analysis, Insights and Forecast, 2019-2031
- 7.1. Market Analysis, Insights and Forecast - by Product Type
- 7.1.1. Smart Office Lighting
- 7.1.2. Security and Access Control System
- 7.1.3. Energy Management System
- 7.1.4. Smart HVAC Control System
- 7.1.5. Audio-video Conferencing System
- 7.1.6. Fire and Safety Control System
- 7.2. Market Analysis, Insights and Forecast - by Building Type
- 7.2.1. Retrofits
- 7.2.2. New Buildings
- 7.1. Market Analysis, Insights and Forecast - by Product Type
- 8. Europe NA Smart Office Market Analysis, Insights and Forecast, 2019-2031
- 8.1. Market Analysis, Insights and Forecast - by Product Type
- 8.1.1. Smart Office Lighting
- 8.1.2. Security and Access Control System
- 8.1.3. Energy Management System
- 8.1.4. Smart HVAC Control System
- 8.1.5. Audio-video Conferencing System
- 8.1.6. Fire and Safety Control System
- 8.2. Market Analysis, Insights and Forecast - by Building Type
- 8.2.1. Retrofits
- 8.2.2. New Buildings
- 8.1. Market Analysis, Insights and Forecast - by Product Type
- 9. Middle East & Africa NA Smart Office Market Analysis, Insights and Forecast, 2019-2031
- 9.1. Market Analysis, Insights and Forecast - by Product Type
- 9.1.1. Smart Office Lighting
- 9.1.2. Security and Access Control System
- 9.1.3. Energy Management System
- 9.1.4. Smart HVAC Control System
- 9.1.5. Audio-video Conferencing System
- 9.1.6. Fire and Safety Control System
- 9.2. Market Analysis, Insights and Forecast - by Building Type
- 9.2.1. Retrofits
- 9.2.2. New Buildings
- 9.1. Market Analysis, Insights and Forecast - by Product Type
- 10. Asia Pacific NA Smart Office Market Analysis, Insights and Forecast, 2019-2031
- 10.1. Market Analysis, Insights and Forecast - by Product Type
- 10.1.1. Smart Office Lighting
- 10.1.2. Security and Access Control System
- 10.1.3. Energy Management System
- 10.1.4. Smart HVAC Control System
- 10.1.5. Audio-video Conferencing System
- 10.1.6. Fire and Safety Control System
- 10.2. Market Analysis, Insights and Forecast - by Building Type
- 10.2.1. Retrofits
- 10.2.2. New Buildings
- 10.1. Market Analysis, Insights and Forecast - by Product Type
- 11. North America NA Smart Office Market Analysis, Insights and Forecast, 2019-2031
- 11.1. Market Analysis, Insights and Forecast - By Country/Sub-region
- 11.1.1.
- 12. Europe NA Smart Office Market Analysis, Insights and Forecast, 2019-2031
- 12.1. Market Analysis, Insights and Forecast - By Country/Sub-region
- 12.1.1.
- 13. Asia Pacific NA Smart Office Market Analysis, Insights and Forecast, 2019-2031
- 13.1. Market Analysis, Insights and Forecast - By Country/Sub-region
- 13.1.1.
- 14. Rest of the World NA Smart Office Market Analysis, Insights and Forecast, 2019-2031
- 14.1. Market Analysis, Insights and Forecast - By Country/Sub-region
- 14.1.1.
- 15. Competitive Analysis
- 15.1. Global Market Share Analysis 2024
- 15.2. Company Profiles
- 15.2.1 Honeywell International Inc
- 15.2.1.1. Overview
- 15.2.1.2. Products
- 15.2.1.3. SWOT Analysis
- 15.2.1.4. Recent Developments
- 15.2.1.5. Financials (Based on Availability)
- 15.2.2 ABB Ltd
- 15.2.2.1. Overview
- 15.2.2.2. Products
- 15.2.2.3. SWOT Analysis
- 15.2.2.4. Recent Developments
- 15.2.2.5. Financials (Based on Availability)
- 15.2.3 Johnson Controls International PLC
- 15.2.3.1. Overview
- 15.2.3.2. Products
- 15.2.3.3. SWOT Analysis
- 15.2.3.4. Recent Developments
- 15.2.3.5. Financials (Based on Availability)
- 15.2.4 United Technologies Corporation
- 15.2.4.1. Overview
- 15.2.4.2. Products
- 15.2.4.3. SWOT Analysis
- 15.2.4.4. Recent Developments
- 15.2.4.5. Financials (Based on Availability)
- 15.2.5 Cisco Systems Inc
- 15.2.5.1. Overview
- 15.2.5.2. Products
- 15.2.5.3. SWOT Analysis
- 15.2.5.4. Recent Developments
- 15.2.5.5. Financials (Based on Availability)
- 15.2.6 Lutron Electronics Co Inc
- 15.2.6.1. Overview
- 15.2.6.2. Products
- 15.2.6.3. SWOT Analysis
- 15.2.6.4. Recent Developments
- 15.2.6.5. Financials (Based on Availability)
- 15.2.7 Siemens AG
- 15.2.7.1. Overview
- 15.2.7.2. Products
- 15.2.7.3. SWOT Analysis
- 15.2.7.4. Recent Developments
- 15.2.7.5. Financials (Based on Availability)
- 15.2.8 Schneider Electric SE
- 15.2.8.1. Overview
- 15.2.8.2. Products
- 15.2.8.3. SWOT Analysis
- 15.2.8.4. Recent Developments
- 15.2.8.5. Financials (Based on Availability)
- 15.2.9 Koninklijke Philips NV
- 15.2.9.1. Overview
- 15.2.9.2. Products
- 15.2.9.3. SWOT Analysis
- 15.2.9.4. Recent Developments
- 15.2.9.5. Financials (Based on Availability)
- 15.2.10 Enlighted Inc *List Not Exhaustive
- 15.2.10.1. Overview
- 15.2.10.2. Products
- 15.2.10.3. SWOT Analysis
- 15.2.10.4. Recent Developments
- 15.2.10.5. Financials (Based on Availability)
- 15.2.11 Crestron Electronics Inc
- 15.2.11.1. Overview
- 15.2.11.2. Products
- 15.2.11.3. SWOT Analysis
- 15.2.11.4. Recent Developments
- 15.2.11.5. Financials (Based on Availability)
- 15.2.12 FogHorn Systems Inc
- 15.2.12.1. Overview
- 15.2.12.2. Products
- 15.2.12.3. SWOT Analysis
- 15.2.12.4. Recent Developments
- 15.2.12.5. Financials (Based on Availability)
- 15.2.1 Honeywell International Inc
List of Figures
- Figure 1: Global NA Smart Office Market Revenue Breakdown (Million, %) by Region 2024 & 2032
- Figure 2: North America NA Smart Office Market Revenue (Million), by Country 2024 & 2032
- Figure 3: North America NA Smart Office Market Revenue Share (%), by Country 2024 & 2032
- Figure 4: Europe NA Smart Office Market Revenue (Million), by Country 2024 & 2032
- Figure 5: Europe NA Smart Office Market Revenue Share (%), by Country 2024 & 2032
- Figure 6: Asia Pacific NA Smart Office Market Revenue (Million), by Country 2024 & 2032
- Figure 7: Asia Pacific NA Smart Office Market Revenue Share (%), by Country 2024 & 2032
- Figure 8: Rest of the World NA Smart Office Market Revenue (Million), by Country 2024 & 2032
- Figure 9: Rest of the World NA Smart Office Market Revenue Share (%), by Country 2024 & 2032
- Figure 10: North America NA Smart Office Market Revenue (Million), by Product Type 2024 & 2032
- Figure 11: North America NA Smart Office Market Revenue Share (%), by Product Type 2024 & 2032
- Figure 12: North America NA Smart Office Market Revenue (Million), by Building Type 2024 & 2032
- Figure 13: North America NA Smart Office Market Revenue Share (%), by Building Type 2024 & 2032
- Figure 14: North America NA Smart Office Market Revenue (Million), by Country 2024 & 2032
- Figure 15: North America NA Smart Office Market Revenue Share (%), by Country 2024 & 2032
- Figure 16: South America NA Smart Office Market Revenue (Million), by Product Type 2024 & 2032
- Figure 17: South America NA Smart Office Market Revenue Share (%), by Product Type 2024 & 2032
- Figure 18: South America NA Smart Office Market Revenue (Million), by Building Type 2024 & 2032
- Figure 19: South America NA Smart Office Market Revenue Share (%), by Building Type 2024 & 2032
- Figure 20: South America NA Smart Office Market Revenue (Million), by Country 2024 & 2032
- Figure 21: South America NA Smart Office Market Revenue Share (%), by Country 2024 & 2032
- Figure 22: Europe NA Smart Office Market Revenue (Million), by Product Type 2024 & 2032
- Figure 23: Europe NA Smart Office Market Revenue Share (%), by Product Type 2024 & 2032
- Figure 24: Europe NA Smart Office Market Revenue (Million), by Building Type 2024 & 2032
- Figure 25: Europe NA Smart Office Market Revenue Share (%), by Building Type 2024 & 2032
- Figure 26: Europe NA Smart Office Market Revenue (Million), by Country 2024 & 2032
- Figure 27: Europe NA Smart Office Market Revenue Share (%), by Country 2024 & 2032
- Figure 28: Middle East & Africa NA Smart Office Market Revenue (Million), by Product Type 2024 & 2032
- Figure 29: Middle East & Africa NA Smart Office Market Revenue Share (%), by Product Type 2024 & 2032
- Figure 30: Middle East & Africa NA Smart Office Market Revenue (Million), by Building Type 2024 & 2032
- Figure 31: Middle East & Africa NA Smart Office Market Revenue Share (%), by Building Type 2024 & 2032
- Figure 32: Middle East & Africa NA Smart Office Market Revenue (Million), by Country 2024 & 2032
- Figure 33: Middle East & Africa NA Smart Office Market Revenue Share (%), by Country 2024 & 2032
- Figure 34: Asia Pacific NA Smart Office Market Revenue (Million), by Product Type 2024 & 2032
- Figure 35: Asia Pacific NA Smart Office Market Revenue Share (%), by Product Type 2024 & 2032
- Figure 36: Asia Pacific NA Smart Office Market Revenue (Million), by Building Type 2024 & 2032
- Figure 37: Asia Pacific NA Smart Office Market Revenue Share (%), by Building Type 2024 & 2032
- Figure 38: Asia Pacific NA Smart Office Market Revenue (Million), by Country 2024 & 2032
- Figure 39: Asia Pacific NA Smart Office Market Revenue Share (%), by Country 2024 & 2032
List of Tables
- Table 1: Global NA Smart Office Market Revenue Million Forecast, by Region 2019 & 2032
- Table 2: Global NA Smart Office Market Revenue Million Forecast, by Product Type 2019 & 2032
- Table 3: Global NA Smart Office Market Revenue Million Forecast, by Building Type 2019 & 2032
- Table 4: Global NA Smart Office Market Revenue Million Forecast, by Region 2019 & 2032
- Table 5: Global NA Smart Office Market Revenue Million Forecast, by Country 2019 & 2032
- Table 6: NA Smart Office Market Revenue (Million) Forecast, by Application 2019 & 2032
- Table 7: Global NA Smart Office Market Revenue Million Forecast, by Country 2019 & 2032
- Table 8: NA Smart Office Market Revenue (Million) Forecast, by Application 2019 & 2032
- Table 9: Global NA Smart Office Market Revenue Million Forecast, by Country 2019 & 2032
- Table 10: NA Smart Office Market Revenue (Million) Forecast, by Application 2019 & 2032
- Table 11: Global NA Smart Office Market Revenue Million Forecast, by Country 2019 & 2032
- Table 12: NA Smart Office Market Revenue (Million) Forecast, by Application 2019 & 2032
- Table 13: Global NA Smart Office Market Revenue Million Forecast, by Product Type 2019 & 2032
- Table 14: Global NA Smart Office Market Revenue Million Forecast, by Building Type 2019 & 2032
- Table 15: Global NA Smart Office Market Revenue Million Forecast, by Country 2019 & 2032
- Table 16: United States NA Smart Office Market Revenue (Million) Forecast, by Application 2019 & 2032
- Table 17: Canada NA Smart Office Market Revenue (Million) Forecast, by Application 2019 & 2032
- Table 18: Mexico NA Smart Office Market Revenue (Million) Forecast, by Application 2019 & 2032
- Table 19: Global NA Smart Office Market Revenue Million Forecast, by Product Type 2019 & 2032
- Table 20: Global NA Smart Office Market Revenue Million Forecast, by Building Type 2019 & 2032
- Table 21: Global NA Smart Office Market Revenue Million Forecast, by Country 2019 & 2032
- Table 22: Brazil NA Smart Office Market Revenue (Million) Forecast, by Application 2019 & 2032
- Table 23: Argentina NA Smart Office Market Revenue (Million) Forecast, by Application 2019 & 2032
- Table 24: Rest of South America NA Smart Office Market Revenue (Million) Forecast, by Application 2019 & 2032
- Table 25: Global NA Smart Office Market Revenue Million Forecast, by Product Type 2019 & 2032
- Table 26: Global NA Smart Office Market Revenue Million Forecast, by Building Type 2019 & 2032
- Table 27: Global NA Smart Office Market Revenue Million Forecast, by Country 2019 & 2032
- Table 28: United Kingdom NA Smart Office Market Revenue (Million) Forecast, by Application 2019 & 2032
- Table 29: Germany NA Smart Office Market Revenue (Million) Forecast, by Application 2019 & 2032
- Table 30: France NA Smart Office Market Revenue (Million) Forecast, by Application 2019 & 2032
- Table 31: Italy NA Smart Office Market Revenue (Million) Forecast, by Application 2019 & 2032
- Table 32: Spain NA Smart Office Market Revenue (Million) Forecast, by Application 2019 & 2032
- Table 33: Russia NA Smart Office Market Revenue (Million) Forecast, by Application 2019 & 2032
- Table 34: Benelux NA Smart Office Market Revenue (Million) Forecast, by Application 2019 & 2032
- Table 35: Nordics NA Smart Office Market Revenue (Million) Forecast, by Application 2019 & 2032
- Table 36: Rest of Europe NA Smart Office Market Revenue (Million) Forecast, by Application 2019 & 2032
- Table 37: Global NA Smart Office Market Revenue Million Forecast, by Product Type 2019 & 2032
- Table 38: Global NA Smart Office Market Revenue Million Forecast, by Building Type 2019 & 2032
- Table 39: Global NA Smart Office Market Revenue Million Forecast, by Country 2019 & 2032
- Table 40: Turkey NA Smart Office Market Revenue (Million) Forecast, by Application 2019 & 2032
- Table 41: Israel NA Smart Office Market Revenue (Million) Forecast, by Application 2019 & 2032
- Table 42: GCC NA Smart Office Market Revenue (Million) Forecast, by Application 2019 & 2032
- Table 43: North Africa NA Smart Office Market Revenue (Million) Forecast, by Application 2019 & 2032
- Table 44: South Africa NA Smart Office Market Revenue (Million) Forecast, by Application 2019 & 2032
- Table 45: Rest of Middle East & Africa NA Smart Office Market Revenue (Million) Forecast, by Application 2019 & 2032
- Table 46: Global NA Smart Office Market Revenue Million Forecast, by Product Type 2019 & 2032
- Table 47: Global NA Smart Office Market Revenue Million Forecast, by Building Type 2019 & 2032
- Table 48: Global NA Smart Office Market Revenue Million Forecast, by Country 2019 & 2032
- Table 49: China NA Smart Office Market Revenue (Million) Forecast, by Application 2019 & 2032
- Table 50: India NA Smart Office Market Revenue (Million) Forecast, by Application 2019 & 2032
- Table 51: Japan NA Smart Office Market Revenue (Million) Forecast, by Application 2019 & 2032
- Table 52: South Korea NA Smart Office Market Revenue (Million) Forecast, by Application 2019 & 2032
- Table 53: ASEAN NA Smart Office Market Revenue (Million) Forecast, by Application 2019 & 2032
- Table 54: Oceania NA Smart Office Market Revenue (Million) Forecast, by Application 2019 & 2032
- Table 55: Rest of Asia Pacific NA Smart Office Market Revenue (Million) Forecast, by Application 2019 & 2032
Frequently Asked Questions
1. What is the projected Compound Annual Growth Rate (CAGR) of the NA Smart Office Market?
The projected CAGR is approximately 9.40%.
2. Which companies are prominent players in the NA Smart Office Market?
Key companies in the market include Honeywell International Inc, ABB Ltd, Johnson Controls International PLC, United Technologies Corporation, Cisco Systems Inc, Lutron Electronics Co Inc, Siemens AG, Schneider Electric SE, Koninklijke Philips NV, Enlighted Inc *List Not Exhaustive, Crestron Electronics Inc, FogHorn Systems Inc.
3. What are the main segments of the NA Smart Office Market?
The market segments include Product Type, Building Type.
4. Can you provide details about the market size?
The market size is estimated to be USD XX Million as of 2022.
5. What are some drivers contributing to market growth?
Increasing Demand for Energy Efficient Solutions; Growing Need for Automation of Security Systems.
6. What are the notable trends driving market growth?
Security and Access Control to Witness Significant Growth.
7. Are there any restraints impacting market growth?
High Cost of Connected Systems.
8. Can you provide examples of recent developments in the market?
March 2020 - ABB acquired the Irish company Cylon Controls to expand its presence in the smart building segment. The acquisition will expand the portfolio of commercial building solutions, emphasizing delivering innovations in energy optimization and comfort.
9. What pricing options are available for accessing the report?
Pricing options include single-user, multi-user, and enterprise licenses priced at USD 4750, USD 4950, and USD 6800 respectively.
10. Is the market size provided in terms of value or volume?
The market size is provided in terms of value, measured in Million.
11. Are there any specific market keywords associated with the report?
Yes, the market keyword associated with the report is "NA Smart Office Market," which aids in identifying and referencing the specific market segment covered.
12. How do I determine which pricing option suits my needs best?
The pricing options vary based on user requirements and access needs. Individual users may opt for single-user licenses, while businesses requiring broader access may choose multi-user or enterprise licenses for cost-effective access to the report.
13. Are there any additional resources or data provided in the NA Smart Office Market report?
While the report offers comprehensive insights, it's advisable to review the specific contents or supplementary materials provided to ascertain if additional resources or data are available.
14. How can I stay updated on further developments or reports in the NA Smart Office Market?
To stay informed about further developments, trends, and reports in the NA Smart Office Market, consider subscribing to industry newsletters, following relevant companies and organizations, or regularly checking reputable industry news sources and publications.
Methodology
Step 1 - Identification of Relevant Samples Size from Population Database


Step 2 - Approaches for Defining Global Market Size (Value, Volume* & Price*)

Note*: In applicable scenarios
Step 3 - Data Sources
Primary Research
- Web Analytics
- Survey Reports
- Research Institute
- Latest Research Reports
- Opinion Leaders
Secondary Research
- Annual Reports
- White Paper
- Latest Press Release
- Industry Association
- Paid Database
- Investor Presentations

Step 4 - Data Triangulation
Involves using different sources of information in order to increase the validity of a study
These sources are likely to be stakeholders in a program - participants, other researchers, program staff, other community members, and so on.
Then we put all data in single framework & apply various statistical tools to find out the dynamic on the market.
During the analysis stage, feedback from the stakeholder groups would be compared to determine areas of agreement as well as areas of divergence
