

Key Insights
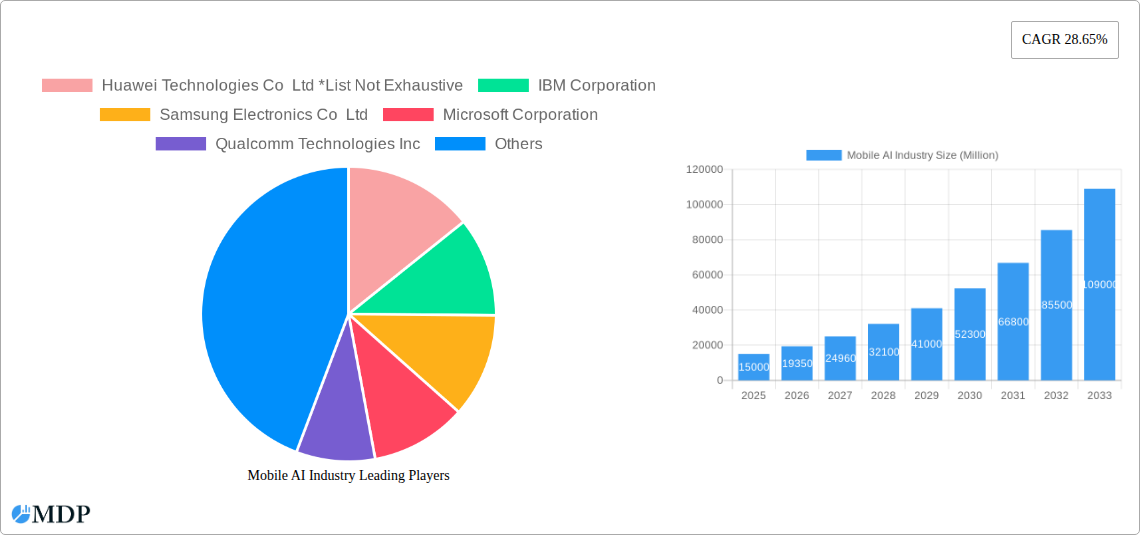
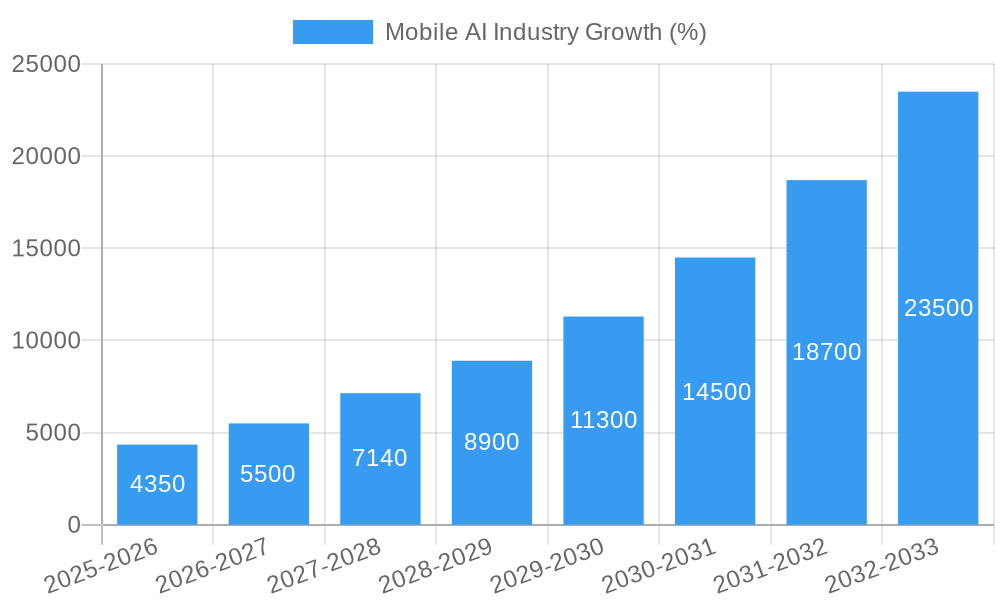
The Mobile AI market is experiencing explosive growth, projected to reach a substantial size driven by the increasing integration of artificial intelligence into smartphones, cameras, and other mobile devices. The 28.65% Compound Annual Growth Rate (CAGR) from 2019 to 2033 signifies a robust market expansion, fueled by several key drivers. Advancements in mobile processing power, coupled with the availability of large datasets for training AI algorithms, are significantly contributing to the development of sophisticated mobile AI applications. The proliferation of smartphones globally, particularly in emerging economies, creates a massive addressable market. Furthermore, increasing demand for enhanced user experiences, personalized services, and improved security features is driving adoption. The segmentation by application reveals a diverse landscape, with smartphones leading the charge, followed by significant growth in the camera, drone, robotics, and automotive sectors. Companies like Apple, Google, Huawei, Samsung, and Qualcomm are at the forefront of innovation, competing fiercely to develop superior AI capabilities integrated into their respective products. The market faces challenges including concerns about data privacy and security, the need for efficient power management in mobile devices, and the high cost of developing and implementing advanced AI algorithms. However, ongoing technological breakthroughs and increasing consumer acceptance are mitigating these challenges.
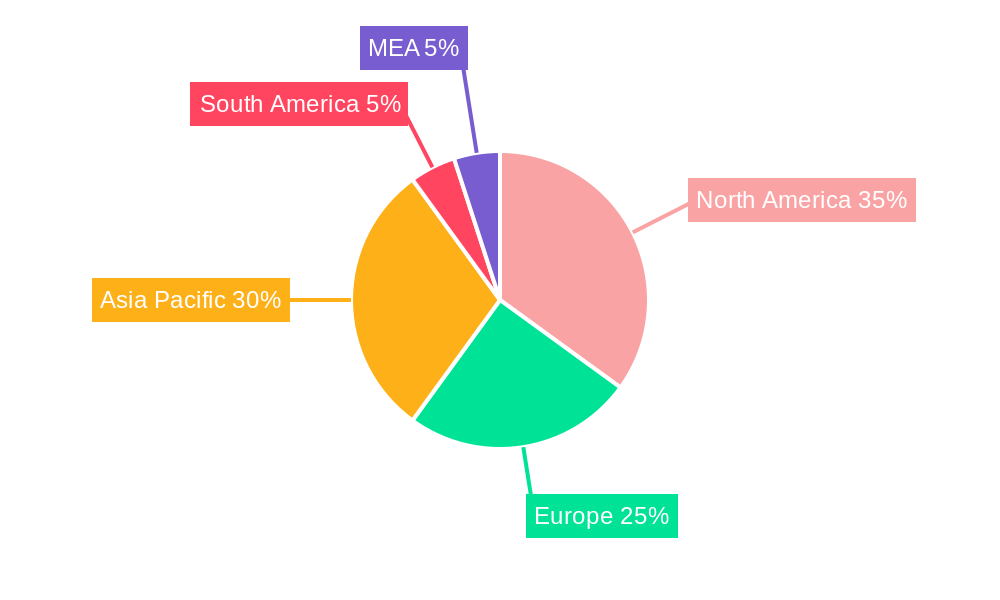
The geographical distribution of the Mobile AI market reflects varying levels of technological advancement and market maturity. North America and Asia Pacific are currently leading the market, benefiting from strong technological capabilities and large consumer bases. However, other regions such as Europe, South America, and the Middle East and Africa are experiencing substantial growth, indicating a global shift toward AI-powered mobile devices and applications. The forecast period of 2025-2033 anticipates sustained growth driven by continued technological progress, the expansion of 5G networks, and the emergence of new applications for mobile AI. The increasing focus on edge computing and the development of more efficient AI models will further enhance the potential of the Mobile AI market. Long-term prospects are highly promising, with continued innovation and expansion into new sectors expected to drive market value significantly beyond 2033.
Mobile AI Industry Market Report: 2019-2033
This comprehensive report provides a detailed analysis of the Mobile AI industry, projecting a market valuation of xx Million by 2033. The study period covers 2019-2033, with a base year of 2025 and a forecast period of 2025-2033. This in-depth analysis is essential for industry stakeholders, investors, and businesses seeking to navigate the rapidly evolving landscape of mobile artificial intelligence. Discover key trends, leading players, and lucrative opportunities shaping the future of mobile AI.
Mobile AI Industry Market Dynamics & Concentration
The Mobile AI market is characterized by intense competition and rapid innovation. Market concentration is moderate, with a few major players holding significant market share, while numerous smaller companies contribute to niche segments. The market share of the top 5 players is estimated at xx%, with Huawei Technologies Co Ltd, IBM Corporation, Samsung Electronics Co Ltd, Microsoft Corporation, and Qualcomm Technologies Inc leading the pack. However, the landscape is dynamic, with frequent mergers and acquisitions (M&A) reshaping the competitive landscape.
- Innovation Drivers: Advancements in processing power, improved algorithms, and the proliferation of mobile devices fuel market growth.
- Regulatory Frameworks: Government regulations concerning data privacy and AI ethics are influencing market development.
- Product Substitutes: While no direct substitutes exist, the functionality of mobile AI is partially replicated by traditional software and hardware solutions.
- End-User Trends: Increased adoption of smartphones, smart wearables, and IoT devices is driving demand for mobile AI solutions.
- M&A Activities: The number of M&A deals in the mobile AI sector increased significantly over the past five years, averaging xx deals annually during the historical period (2019-2024). This points to a highly dynamic competitive landscape and a rush for innovation.
Mobile AI Industry Industry Trends & Analysis
The Mobile AI market is experiencing robust growth, driven by a confluence of factors. The Compound Annual Growth Rate (CAGR) during the forecast period (2025-2033) is projected at xx%. Market penetration is steadily rising, particularly in regions with high smartphone and internet penetration. Technological advancements, such as the development of edge AI and 5G networks, are creating new possibilities for mobile AI applications. Consumer preferences are shifting towards personalized experiences and seamless integration of AI-powered features in mobile devices. The competitive landscape is characterized by intense competition amongst established tech giants and emerging startups.
Leading Markets & Segments in Mobile AI Industry
The North American region currently holds a dominant position in the global Mobile AI market, driven by robust technological advancements, high consumer spending, and early adoption of AI technologies. However, the Asia-Pacific region is expected to exhibit significant growth in the coming years.
Key Drivers for North American Dominance:
- Strong R&D infrastructure and investment
- High disposable income and consumer demand for sophisticated mobile devices
- Favorable regulatory environment supporting technological innovation
Leading Segment: The Smartphone segment dominates the application landscape due to the vast user base and integration possibilities.
- Smartphone: Widespread adoption and the inherent potential for integrating AI capabilities directly into the devices drive substantial market growth.
- Camera: Enhanced image processing, scene recognition, and object tracking are fueled by AI advancements leading to a high penetration rate.
- Automotive: Advanced driver-assistance systems (ADAS), autonomous driving features, and in-car infotainment applications are rapidly adopting AI technologies.
- Robotics: AI enables improved navigation, object recognition, and task automation in robots.
- Other Applications: The remaining segment includes AI implementations in wearables, smart home devices, and other mobile applications which are steadily gaining traction.
Mobile AI Industry Product Developments
Recent product innovations focus on improving the efficiency and accuracy of AI algorithms, enhancing user experience, and expanding application possibilities. This includes improvements in on-device processing capabilities, allowing for faster and more responsive AI functions. New applications are emerging in various sectors, including healthcare, finance, and education, driving market growth. The competitive advantage hinges on developing efficient, reliable, and user-friendly AI solutions tailored to specific market needs.
Key Drivers of Mobile AI Industry Growth
The rapid growth of the mobile AI industry is propelled by several factors:
- Technological advancements: The continuous development of more powerful and energy-efficient processors, improved algorithms, and advanced sensors are key drivers.
- Economic factors: Increased investment in R&D and the growing demand for AI-powered mobile solutions contribute significantly to industry growth.
- Regulatory support: Favorable government policies and initiatives promoting the adoption of AI technologies provide a favorable environment for the industry's expansion.
Challenges in the Mobile AI Industry Market
The industry faces challenges such as:
- Regulatory hurdles: Data privacy regulations and ethical concerns surrounding AI technology create complexities for market players.
- Supply chain issues: The global chip shortage and supply chain disruptions impact the production of mobile AI-enabled devices.
- Competitive pressures: The highly competitive market landscape leads to pricing pressures and the need for continuous innovation.
Emerging Opportunities in Mobile AI Industry
Future growth is driven by opportunities stemming from:
- Technological breakthroughs in areas like edge computing and neuromorphic computing.
- Strategic partnerships between tech giants and specialized AI startups to combine expertise and resources.
- Expansion into new markets and applications where AI can significantly improve existing processes.
Leading Players in the Mobile AI Industry Sector
- Huawei Technologies Co Ltd
- IBM Corporation
- Samsung Electronics Co Ltd
- Microsoft Corporation
- Qualcomm Technologies Inc
- Alphabet Inc (Google LLC)
- MediaTek Inc
- Nvidia Corporation
- Apple Inc
- Intel Corporation
Key Milestones in Mobile AI Industry Industry
- February 2022: Apple Inc. acquired an AI music startup, enhancing its audio offerings.
- March 2022: Intel Corporation acquired Granulate Cloud Solutions Ltd., aiming to improve cloud workload performance.
- May 2022: Avaya and Microsoft Corp. expanded their partnership, integrating Avaya OneCloud with Microsoft Azure.
Strategic Outlook for Mobile AI Industry Market
The Mobile AI market is poised for significant growth, fueled by technological advancements, increasing demand for AI-powered mobile applications, and favorable regulatory environments. Strategic opportunities lie in developing innovative AI solutions, forging strategic partnerships, and expanding into new and emerging markets globally. The future looks promising for companies that can successfully navigate the challenges and capitalize on the emerging opportunities within this dynamic sector.
Mobile AI Industry Segmentation
-
1. Application
- 1.1. Smartphone
- 1.2. Camera
- 1.3. Drone
- 1.4. Robotics
- 1.5. Automotive
- 1.6. Other Applications
Mobile AI Industry Segmentation By Geography
- 1. North America
- 2. Europe
- 3. Asia Pacific
- 4. Latin America
- 5. Middle East
Mobile AI Industry REPORT HIGHLIGHTS
| Aspects | Details |
|---|---|
| Study Period | 2019-2033 |
| Base Year | 2024 |
| Estimated Year | 2025 |
| Forecast Period | 2025-2033 |
| Historical Period | 2019-2024 |
| Growth Rate | CAGR of 28.65% from 2019-2033 |
| Segmentation |
|
Table of Contents
- 1. Introduction
- 1.1. Research Scope
- 1.2. Market Segmentation
- 1.3. Research Methodology
- 1.4. Definitions and Assumptions
- 2. Executive Summary
- 2.1. Introduction
- 3. Market Dynamics
- 3.1. Introduction
- 3.2. Market Drivers
- 3.2.1. Increasing Demand for AI-capable Processors in Mobile Devices; Rise of Cognitive Computing and Increasing Number of AI Applications; Increasing Penetration of Mobile Devices
- 3.3. Market Restrains
- 3.3.1 Algorithms
- 3.3.2 Mathematical
- 3.3.3 and Other Complexities Associated with the Use of Gesture Recognition Technology; High Battery Power Consumption by Gesture Sensors
- 3.3.4 due to the ‘Always-on’ User Interface
- 3.4. Market Trends
- 3.4.1. Smartphone Application Drive Growth of The Market
- 4. Market Factor Analysis
- 4.1. Porters Five Forces
- 4.2. Supply/Value Chain
- 4.3. PESTEL analysis
- 4.4. Market Entropy
- 4.5. Patent/Trademark Analysis
- 5. Global Mobile AI Industry Analysis, Insights and Forecast, 2019-2031
- 5.1. Market Analysis, Insights and Forecast - by Application
- 5.1.1. Smartphone
- 5.1.2. Camera
- 5.1.3. Drone
- 5.1.4. Robotics
- 5.1.5. Automotive
- 5.1.6. Other Applications
- 5.2. Market Analysis, Insights and Forecast - by Region
- 5.2.1. North America
- 5.2.2. Europe
- 5.2.3. Asia Pacific
- 5.2.4. Latin America
- 5.2.5. Middle East
- 5.1. Market Analysis, Insights and Forecast - by Application
- 6. North America Mobile AI Industry Analysis, Insights and Forecast, 2019-2031
- 6.1. Market Analysis, Insights and Forecast - by Application
- 6.1.1. Smartphone
- 6.1.2. Camera
- 6.1.3. Drone
- 6.1.4. Robotics
- 6.1.5. Automotive
- 6.1.6. Other Applications
- 6.1. Market Analysis, Insights and Forecast - by Application
- 7. Europe Mobile AI Industry Analysis, Insights and Forecast, 2019-2031
- 7.1. Market Analysis, Insights and Forecast - by Application
- 7.1.1. Smartphone
- 7.1.2. Camera
- 7.1.3. Drone
- 7.1.4. Robotics
- 7.1.5. Automotive
- 7.1.6. Other Applications
- 7.1. Market Analysis, Insights and Forecast - by Application
- 8. Asia Pacific Mobile AI Industry Analysis, Insights and Forecast, 2019-2031
- 8.1. Market Analysis, Insights and Forecast - by Application
- 8.1.1. Smartphone
- 8.1.2. Camera
- 8.1.3. Drone
- 8.1.4. Robotics
- 8.1.5. Automotive
- 8.1.6. Other Applications
- 8.1. Market Analysis, Insights and Forecast - by Application
- 9. Latin America Mobile AI Industry Analysis, Insights and Forecast, 2019-2031
- 9.1. Market Analysis, Insights and Forecast - by Application
- 9.1.1. Smartphone
- 9.1.2. Camera
- 9.1.3. Drone
- 9.1.4. Robotics
- 9.1.5. Automotive
- 9.1.6. Other Applications
- 9.1. Market Analysis, Insights and Forecast - by Application
- 10. Middle East Mobile AI Industry Analysis, Insights and Forecast, 2019-2031
- 10.1. Market Analysis, Insights and Forecast - by Application
- 10.1.1. Smartphone
- 10.1.2. Camera
- 10.1.3. Drone
- 10.1.4. Robotics
- 10.1.5. Automotive
- 10.1.6. Other Applications
- 10.1. Market Analysis, Insights and Forecast - by Application
- 11. North America Mobile AI Industry Analysis, Insights and Forecast, 2019-2031
- 11.1. Market Analysis, Insights and Forecast - By Country/Sub-region
- 11.1.1 United States
- 11.1.2 Canada
- 11.1.3 Mexico
- 12. Europe Mobile AI Industry Analysis, Insights and Forecast, 2019-2031
- 12.1. Market Analysis, Insights and Forecast - By Country/Sub-region
- 12.1.1 Germany
- 12.1.2 United Kingdom
- 12.1.3 France
- 12.1.4 Spain
- 12.1.5 Italy
- 12.1.6 Spain
- 12.1.7 Belgium
- 12.1.8 Netherland
- 12.1.9 Nordics
- 12.1.10 Rest of Europe
- 13. Asia Pacific Mobile AI Industry Analysis, Insights and Forecast, 2019-2031
- 13.1. Market Analysis, Insights and Forecast - By Country/Sub-region
- 13.1.1 China
- 13.1.2 Japan
- 13.1.3 India
- 13.1.4 South Korea
- 13.1.5 Southeast Asia
- 13.1.6 Australia
- 13.1.7 Indonesia
- 13.1.8 Phillipes
- 13.1.9 Singapore
- 13.1.10 Thailandc
- 13.1.11 Rest of Asia Pacific
- 14. South America Mobile AI Industry Analysis, Insights and Forecast, 2019-2031
- 14.1. Market Analysis, Insights and Forecast - By Country/Sub-region
- 14.1.1 Brazil
- 14.1.2 Argentina
- 14.1.3 Peru
- 14.1.4 Chile
- 14.1.5 Colombia
- 14.1.6 Ecuador
- 14.1.7 Venezuela
- 14.1.8 Rest of South America
- 15. North America Mobile AI Industry Analysis, Insights and Forecast, 2019-2031
- 15.1. Market Analysis, Insights and Forecast - By Country/Sub-region
- 15.1.1 United States
- 15.1.2 Canada
- 15.1.3 Mexico
- 16. MEA Mobile AI Industry Analysis, Insights and Forecast, 2019-2031
- 16.1. Market Analysis, Insights and Forecast - By Country/Sub-region
- 16.1.1 United Arab Emirates
- 16.1.2 Saudi Arabia
- 16.1.3 South Africa
- 16.1.4 Rest of Middle East and Africa
- 17. Competitive Analysis
- 17.1. Global Market Share Analysis 2024
- 17.2. Company Profiles
- 17.2.1 Huawei Technologies Co Ltd *List Not Exhaustive
- 17.2.1.1. Overview
- 17.2.1.2. Products
- 17.2.1.3. SWOT Analysis
- 17.2.1.4. Recent Developments
- 17.2.1.5. Financials (Based on Availability)
- 17.2.2 IBM Corporation
- 17.2.2.1. Overview
- 17.2.2.2. Products
- 17.2.2.3. SWOT Analysis
- 17.2.2.4. Recent Developments
- 17.2.2.5. Financials (Based on Availability)
- 17.2.3 Samsung Electronics Co Ltd
- 17.2.3.1. Overview
- 17.2.3.2. Products
- 17.2.3.3. SWOT Analysis
- 17.2.3.4. Recent Developments
- 17.2.3.5. Financials (Based on Availability)
- 17.2.4 Microsoft Corporation
- 17.2.4.1. Overview
- 17.2.4.2. Products
- 17.2.4.3. SWOT Analysis
- 17.2.4.4. Recent Developments
- 17.2.4.5. Financials (Based on Availability)
- 17.2.5 Qualcomm Technologies Inc
- 17.2.5.1. Overview
- 17.2.5.2. Products
- 17.2.5.3. SWOT Analysis
- 17.2.5.4. Recent Developments
- 17.2.5.5. Financials (Based on Availability)
- 17.2.6 Alphabet Inc (Google LLC)
- 17.2.6.1. Overview
- 17.2.6.2. Products
- 17.2.6.3. SWOT Analysis
- 17.2.6.4. Recent Developments
- 17.2.6.5. Financials (Based on Availability)
- 17.2.7 MediaTek Inc
- 17.2.7.1. Overview
- 17.2.7.2. Products
- 17.2.7.3. SWOT Analysis
- 17.2.7.4. Recent Developments
- 17.2.7.5. Financials (Based on Availability)
- 17.2.8 Nvidia Corporation
- 17.2.8.1. Overview
- 17.2.8.2. Products
- 17.2.8.3. SWOT Analysis
- 17.2.8.4. Recent Developments
- 17.2.8.5. Financials (Based on Availability)
- 17.2.9 Apple Inc
- 17.2.9.1. Overview
- 17.2.9.2. Products
- 17.2.9.3. SWOT Analysis
- 17.2.9.4. Recent Developments
- 17.2.9.5. Financials (Based on Availability)
- 17.2.10 Intel Corporation
- 17.2.10.1. Overview
- 17.2.10.2. Products
- 17.2.10.3. SWOT Analysis
- 17.2.10.4. Recent Developments
- 17.2.10.5. Financials (Based on Availability)
- 17.2.1 Huawei Technologies Co Ltd *List Not Exhaustive
List of Figures
- Figure 1: Global Mobile AI Industry Revenue Breakdown (Million, %) by Region 2024 & 2032
- Figure 2: North America Mobile AI Industry Revenue (Million), by Country 2024 & 2032
- Figure 3: North America Mobile AI Industry Revenue Share (%), by Country 2024 & 2032
- Figure 4: Europe Mobile AI Industry Revenue (Million), by Country 2024 & 2032
- Figure 5: Europe Mobile AI Industry Revenue Share (%), by Country 2024 & 2032
- Figure 6: Asia Pacific Mobile AI Industry Revenue (Million), by Country 2024 & 2032
- Figure 7: Asia Pacific Mobile AI Industry Revenue Share (%), by Country 2024 & 2032
- Figure 8: South America Mobile AI Industry Revenue (Million), by Country 2024 & 2032
- Figure 9: South America Mobile AI Industry Revenue Share (%), by Country 2024 & 2032
- Figure 10: North America Mobile AI Industry Revenue (Million), by Country 2024 & 2032
- Figure 11: North America Mobile AI Industry Revenue Share (%), by Country 2024 & 2032
- Figure 12: MEA Mobile AI Industry Revenue (Million), by Country 2024 & 2032
- Figure 13: MEA Mobile AI Industry Revenue Share (%), by Country 2024 & 2032
- Figure 14: North America Mobile AI Industry Revenue (Million), by Application 2024 & 2032
- Figure 15: North America Mobile AI Industry Revenue Share (%), by Application 2024 & 2032
- Figure 16: North America Mobile AI Industry Revenue (Million), by Country 2024 & 2032
- Figure 17: North America Mobile AI Industry Revenue Share (%), by Country 2024 & 2032
- Figure 18: Europe Mobile AI Industry Revenue (Million), by Application 2024 & 2032
- Figure 19: Europe Mobile AI Industry Revenue Share (%), by Application 2024 & 2032
- Figure 20: Europe Mobile AI Industry Revenue (Million), by Country 2024 & 2032
- Figure 21: Europe Mobile AI Industry Revenue Share (%), by Country 2024 & 2032
- Figure 22: Asia Pacific Mobile AI Industry Revenue (Million), by Application 2024 & 2032
- Figure 23: Asia Pacific Mobile AI Industry Revenue Share (%), by Application 2024 & 2032
- Figure 24: Asia Pacific Mobile AI Industry Revenue (Million), by Country 2024 & 2032
- Figure 25: Asia Pacific Mobile AI Industry Revenue Share (%), by Country 2024 & 2032
- Figure 26: Latin America Mobile AI Industry Revenue (Million), by Application 2024 & 2032
- Figure 27: Latin America Mobile AI Industry Revenue Share (%), by Application 2024 & 2032
- Figure 28: Latin America Mobile AI Industry Revenue (Million), by Country 2024 & 2032
- Figure 29: Latin America Mobile AI Industry Revenue Share (%), by Country 2024 & 2032
- Figure 30: Middle East Mobile AI Industry Revenue (Million), by Application 2024 & 2032
- Figure 31: Middle East Mobile AI Industry Revenue Share (%), by Application 2024 & 2032
- Figure 32: Middle East Mobile AI Industry Revenue (Million), by Country 2024 & 2032
- Figure 33: Middle East Mobile AI Industry Revenue Share (%), by Country 2024 & 2032
List of Tables
- Table 1: Global Mobile AI Industry Revenue Million Forecast, by Region 2019 & 2032
- Table 2: Global Mobile AI Industry Revenue Million Forecast, by Application 2019 & 2032
- Table 3: Global Mobile AI Industry Revenue Million Forecast, by Region 2019 & 2032
- Table 4: Global Mobile AI Industry Revenue Million Forecast, by Country 2019 & 2032
- Table 5: United States Mobile AI Industry Revenue (Million) Forecast, by Application 2019 & 2032
- Table 6: Canada Mobile AI Industry Revenue (Million) Forecast, by Application 2019 & 2032
- Table 7: Mexico Mobile AI Industry Revenue (Million) Forecast, by Application 2019 & 2032
- Table 8: Global Mobile AI Industry Revenue Million Forecast, by Country 2019 & 2032
- Table 9: Germany Mobile AI Industry Revenue (Million) Forecast, by Application 2019 & 2032
- Table 10: United Kingdom Mobile AI Industry Revenue (Million) Forecast, by Application 2019 & 2032
- Table 11: France Mobile AI Industry Revenue (Million) Forecast, by Application 2019 & 2032
- Table 12: Spain Mobile AI Industry Revenue (Million) Forecast, by Application 2019 & 2032
- Table 13: Italy Mobile AI Industry Revenue (Million) Forecast, by Application 2019 & 2032
- Table 14: Spain Mobile AI Industry Revenue (Million) Forecast, by Application 2019 & 2032
- Table 15: Belgium Mobile AI Industry Revenue (Million) Forecast, by Application 2019 & 2032
- Table 16: Netherland Mobile AI Industry Revenue (Million) Forecast, by Application 2019 & 2032
- Table 17: Nordics Mobile AI Industry Revenue (Million) Forecast, by Application 2019 & 2032
- Table 18: Rest of Europe Mobile AI Industry Revenue (Million) Forecast, by Application 2019 & 2032
- Table 19: Global Mobile AI Industry Revenue Million Forecast, by Country 2019 & 2032
- Table 20: China Mobile AI Industry Revenue (Million) Forecast, by Application 2019 & 2032
- Table 21: Japan Mobile AI Industry Revenue (Million) Forecast, by Application 2019 & 2032
- Table 22: India Mobile AI Industry Revenue (Million) Forecast, by Application 2019 & 2032
- Table 23: South Korea Mobile AI Industry Revenue (Million) Forecast, by Application 2019 & 2032
- Table 24: Southeast Asia Mobile AI Industry Revenue (Million) Forecast, by Application 2019 & 2032
- Table 25: Australia Mobile AI Industry Revenue (Million) Forecast, by Application 2019 & 2032
- Table 26: Indonesia Mobile AI Industry Revenue (Million) Forecast, by Application 2019 & 2032
- Table 27: Phillipes Mobile AI Industry Revenue (Million) Forecast, by Application 2019 & 2032
- Table 28: Singapore Mobile AI Industry Revenue (Million) Forecast, by Application 2019 & 2032
- Table 29: Thailandc Mobile AI Industry Revenue (Million) Forecast, by Application 2019 & 2032
- Table 30: Rest of Asia Pacific Mobile AI Industry Revenue (Million) Forecast, by Application 2019 & 2032
- Table 31: Global Mobile AI Industry Revenue Million Forecast, by Country 2019 & 2032
- Table 32: Brazil Mobile AI Industry Revenue (Million) Forecast, by Application 2019 & 2032
- Table 33: Argentina Mobile AI Industry Revenue (Million) Forecast, by Application 2019 & 2032
- Table 34: Peru Mobile AI Industry Revenue (Million) Forecast, by Application 2019 & 2032
- Table 35: Chile Mobile AI Industry Revenue (Million) Forecast, by Application 2019 & 2032
- Table 36: Colombia Mobile AI Industry Revenue (Million) Forecast, by Application 2019 & 2032
- Table 37: Ecuador Mobile AI Industry Revenue (Million) Forecast, by Application 2019 & 2032
- Table 38: Venezuela Mobile AI Industry Revenue (Million) Forecast, by Application 2019 & 2032
- Table 39: Rest of South America Mobile AI Industry Revenue (Million) Forecast, by Application 2019 & 2032
- Table 40: Global Mobile AI Industry Revenue Million Forecast, by Country 2019 & 2032
- Table 41: United States Mobile AI Industry Revenue (Million) Forecast, by Application 2019 & 2032
- Table 42: Canada Mobile AI Industry Revenue (Million) Forecast, by Application 2019 & 2032
- Table 43: Mexico Mobile AI Industry Revenue (Million) Forecast, by Application 2019 & 2032
- Table 44: Global Mobile AI Industry Revenue Million Forecast, by Country 2019 & 2032
- Table 45: United Arab Emirates Mobile AI Industry Revenue (Million) Forecast, by Application 2019 & 2032
- Table 46: Saudi Arabia Mobile AI Industry Revenue (Million) Forecast, by Application 2019 & 2032
- Table 47: South Africa Mobile AI Industry Revenue (Million) Forecast, by Application 2019 & 2032
- Table 48: Rest of Middle East and Africa Mobile AI Industry Revenue (Million) Forecast, by Application 2019 & 2032
- Table 49: Global Mobile AI Industry Revenue Million Forecast, by Application 2019 & 2032
- Table 50: Global Mobile AI Industry Revenue Million Forecast, by Country 2019 & 2032
- Table 51: Global Mobile AI Industry Revenue Million Forecast, by Application 2019 & 2032
- Table 52: Global Mobile AI Industry Revenue Million Forecast, by Country 2019 & 2032
- Table 53: Global Mobile AI Industry Revenue Million Forecast, by Application 2019 & 2032
- Table 54: Global Mobile AI Industry Revenue Million Forecast, by Country 2019 & 2032
- Table 55: Global Mobile AI Industry Revenue Million Forecast, by Application 2019 & 2032
- Table 56: Global Mobile AI Industry Revenue Million Forecast, by Country 2019 & 2032
- Table 57: Global Mobile AI Industry Revenue Million Forecast, by Application 2019 & 2032
- Table 58: Global Mobile AI Industry Revenue Million Forecast, by Country 2019 & 2032
Frequently Asked Questions
1. What is the projected Compound Annual Growth Rate (CAGR) of the Mobile AI Industry?
The projected CAGR is approximately 28.65%.
2. Which companies are prominent players in the Mobile AI Industry?
Key companies in the market include Huawei Technologies Co Ltd *List Not Exhaustive, IBM Corporation, Samsung Electronics Co Ltd, Microsoft Corporation, Qualcomm Technologies Inc, Alphabet Inc (Google LLC), MediaTek Inc, Nvidia Corporation, Apple Inc, Intel Corporation.
3. What are the main segments of the Mobile AI Industry?
The market segments include Application .
4. Can you provide details about the market size?
The market size is estimated to be USD XX Million as of 2022.
5. What are some drivers contributing to market growth?
Increasing Demand for AI-capable Processors in Mobile Devices; Rise of Cognitive Computing and Increasing Number of AI Applications; Increasing Penetration of Mobile Devices.
6. What are the notable trends driving market growth?
Smartphone Application Drive Growth of The Market.
7. Are there any restraints impacting market growth?
Algorithms. Mathematical. and Other Complexities Associated with the Use of Gesture Recognition Technology; High Battery Power Consumption by Gesture Sensors. due to the ‘Always-on’ User Interface.
8. Can you provide examples of recent developments in the market?
May 2022: Avaya and Microsoft Corp. expanded their global partnership by pairing the industry-leading Avaya OneCloud portfolio with Microsoft Azure to provide organizations with more options to increase their productivity and customer engagement with unrivaled reliability, agility, and scale.
9. What pricing options are available for accessing the report?
Pricing options include single-user, multi-user, and enterprise licenses priced at USD 4750, USD 5250, and USD 8750 respectively.
10. Is the market size provided in terms of value or volume?
The market size is provided in terms of value, measured in Million.
11. Are there any specific market keywords associated with the report?
Yes, the market keyword associated with the report is "Mobile AI Industry," which aids in identifying and referencing the specific market segment covered.
12. How do I determine which pricing option suits my needs best?
The pricing options vary based on user requirements and access needs. Individual users may opt for single-user licenses, while businesses requiring broader access may choose multi-user or enterprise licenses for cost-effective access to the report.
13. Are there any additional resources or data provided in the Mobile AI Industry report?
While the report offers comprehensive insights, it's advisable to review the specific contents or supplementary materials provided to ascertain if additional resources or data are available.
14. How can I stay updated on further developments or reports in the Mobile AI Industry?
To stay informed about further developments, trends, and reports in the Mobile AI Industry, consider subscribing to industry newsletters, following relevant companies and organizations, or regularly checking reputable industry news sources and publications.
Methodology
Step 1 - Identification of Relevant Samples Size from Population Database


Step 2 - Approaches for Defining Global Market Size (Value, Volume* & Price*)

Note*: In applicable scenarios
Step 3 - Data Sources
Primary Research
- Web Analytics
- Survey Reports
- Research Institute
- Latest Research Reports
- Opinion Leaders
Secondary Research
- Annual Reports
- White Paper
- Latest Press Release
- Industry Association
- Paid Database
- Investor Presentations

Step 4 - Data Triangulation
Involves using different sources of information in order to increase the validity of a study
These sources are likely to be stakeholders in a program - participants, other researchers, program staff, other community members, and so on.
Then we put all data in single framework & apply various statistical tools to find out the dynamic on the market.
During the analysis stage, feedback from the stakeholder groups would be compared to determine areas of agreement as well as areas of divergence
