

Key Insights
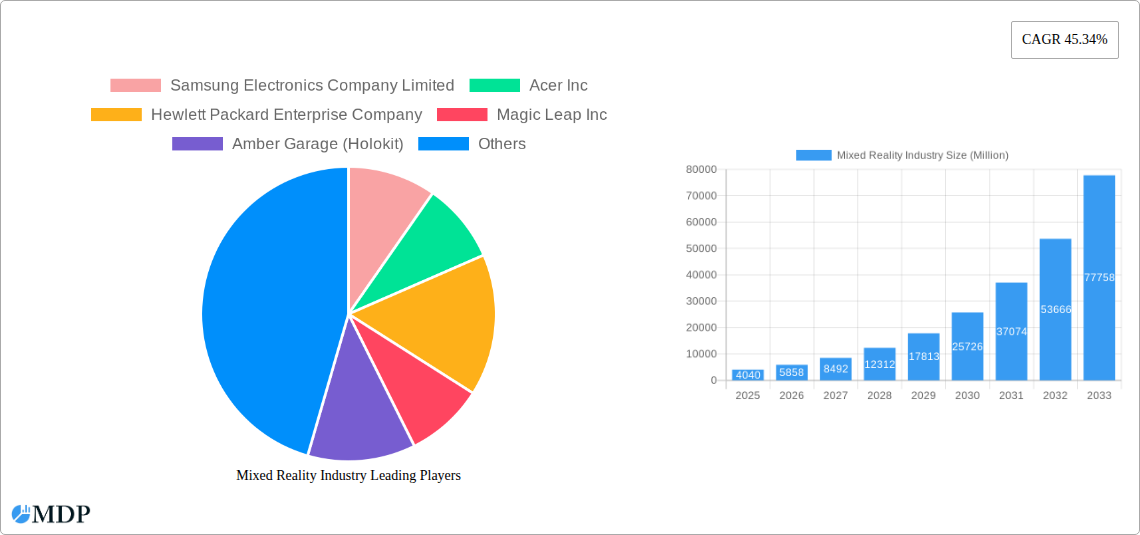
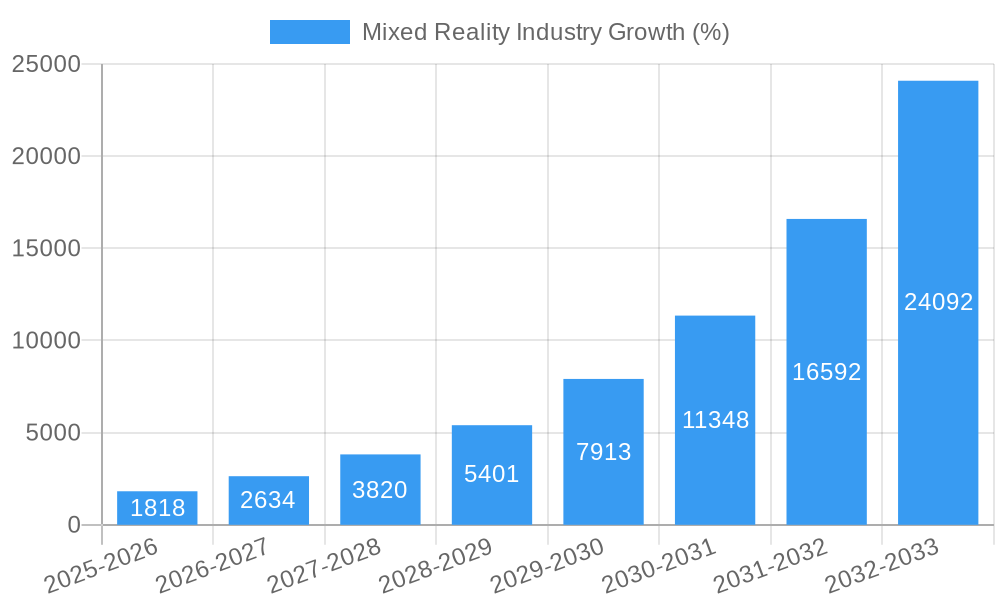
The mixed reality (MR) industry is experiencing explosive growth, projected to reach a market size of $4.04 billion in 2025 and exhibiting a remarkable Compound Annual Growth Rate (CAGR) of 45.34%. This rapid expansion is fueled by several key drivers. Advancements in hardware, including lighter, more powerful headsets and improved tracking technologies, are making MR more accessible and user-friendly. Simultaneously, the decreasing cost of development and deployment is making MR solutions more economically viable for businesses across various sectors. Increasing adoption across key end-user verticals, such as education (using immersive learning experiences), engineering (for design and prototyping), entertainment (for gaming and interactive experiences), and healthcare (for training and surgical simulations), is further propelling market growth. The emergence of innovative applications and the development of robust software ecosystems are also significant contributors. While challenges remain, such as the need for further technological advancements to enhance user experience and address potential health concerns related to prolonged use, the overall market trajectory indicates a highly promising future for MR technology.
Looking ahead to 2033, the continued refinement of MR technology and its integration into diverse applications will likely sustain this high growth trajectory. We can anticipate further miniaturization and improved ergonomics of MR headsets, leading to increased comfort and wider adoption. The development of more sophisticated interaction methods, such as haptic feedback and gesture recognition, will create more immersive and intuitive experiences. Furthermore, the increasing availability of high-quality MR content and the expansion of developer communities will contribute to a richer and more engaging ecosystem. The ongoing convergence of MR with artificial intelligence (AI) and other emerging technologies holds the potential to unlock even more transformative applications across various sectors, driving further market expansion in the years to come. Competition among established tech giants like Samsung, Microsoft, and Meta, as well as innovative startups, will further accelerate innovation and market penetration.
Mixed Reality Industry: A Comprehensive Market Report (2019-2033)
This in-depth report provides a comprehensive analysis of the Mixed Reality (MR) industry, projecting a market value exceeding $XX Million by 2033. It offers crucial insights for investors, industry stakeholders, and technology enthusiasts alike, covering market dynamics, leading players, and future growth opportunities. The report covers the period from 2019 to 2033, with a base year of 2025 and a forecast period spanning 2025-2033.
Mixed Reality Industry Market Dynamics & Concentration
The Mixed Reality market is characterized by a dynamic interplay of factors influencing its growth and concentration. The market is witnessing significant innovation, driven by advancements in display technology, processing power, and sensor capabilities. This innovation is leading to the development of more immersive and versatile MR devices and applications. However, regulatory frameworks, particularly concerning data privacy and security, pose challenges to market expansion. The presence of substitute technologies, such as Virtual Reality (VR) and Augmented Reality (AR), also affects market share.
End-user trends are rapidly evolving, with increasing adoption across diverse sectors like education, healthcare, and entertainment. The market has also seen a notable increase in mergers and acquisitions (M&A) activity, reflecting the strategic importance of the MR space. In the historical period (2019-2024), we observed approximately xx M&A deals, indicating a consolidating market. While precise market share data for individual companies is proprietary, the report details a competitive landscape with key players such as Samsung Electronics Company Limited, Acer Inc, Hewlett Packard Enterprise Company, Magic Leap Inc, Amber Garage (Holokit), Microsoft Corporation, AsusTek Computer Inc, Meta Platform Inc, Dell Technologies Inc, and Occipital Inc holding significant, albeit varying, portions of the market. The report provides a detailed breakdown of market concentration using the Herfindahl-Hirschman Index (HHI) and other relevant metrics.
Mixed Reality Industry Industry Trends & Analysis
The Mixed Reality market is experiencing robust growth, with a projected Compound Annual Growth Rate (CAGR) of xx% during the forecast period (2025-2033). This growth is propelled by several key factors. Technological advancements, including improvements in processing power, display resolution, and sensor accuracy, are enhancing the user experience and expanding the range of applications. Consumer preferences are shifting towards more immersive and interactive experiences, further driving demand for MR devices and applications. The increasing market penetration of MR technology across various industry verticals further contributes to this growth trajectory. However, the competitive landscape is highly dynamic, with established players and emerging startups vying for market share, creating both opportunities and challenges. The report provides a detailed analysis of the competitive dynamics, including pricing strategies, product differentiation, and market positioning of key players. The report also explores the impact of technological disruptions, such as the rise of 5G and advancements in AI, on the MR market.
Leading Markets & Segments in Mixed Reality Industry
The Mixed Reality market exhibits significant regional and segmental variations in growth. While specific market dominance details require access to proprietary data, the report identifies key drivers and trends within each segment.
- Education: The use of MR in education is increasing rapidly, with immersive learning experiences driving demand. Key drivers include government initiatives promoting technology in education and the rising adoption of blended learning models.
- Engineering: MR is revolutionizing engineering design and prototyping processes. Key drivers include increased efficiency and reduced development costs.
- Entertainment: The entertainment sector is a significant adopter of MR technology, with immersive gaming and interactive experiences driving demand. Key drivers include consumer interest in new forms of entertainment and the increasing affordability of MR devices.
- Healthcare: MR applications in healthcare are expanding rapidly, from surgical simulations to patient rehabilitation. Key drivers include the need for improved patient care and the ability of MR to enhance medical training and procedures.
- Other End-user Verticals: This sector encompasses a broad range of applications, including retail, manufacturing, and military, each with specific growth drivers outlined within the report.
The report analyzes the dominant regions and segments based on market size, growth rate, and key drivers, providing a comprehensive understanding of the market landscape.
Mixed Reality Industry Product Developments
The MR industry is witnessing a rapid pace of product innovation, with companies constantly releasing new devices and applications tailored to specific market needs. Technological trends such as improved display technology (higher resolution, wider field of view), more powerful processors, and advanced sensor integration are driving these developments. New applications are emerging across various sectors, leading to a more diversified market with greater potential for future growth. The competitive advantage lies in offering innovative features, high-quality user experiences, and strong ecosystem support.
Key Drivers of Mixed Reality Industry Growth
The robust growth of the Mixed Reality industry is driven by a confluence of factors. Technological advancements, particularly in display technology, processing power, and sensor capabilities, are at the forefront. Economic factors, such as increasing disposable incomes and corporate investments in new technologies, further fuel this growth. Supportive government regulations and initiatives, particularly those aimed at promoting technological innovation and digital transformation, play a crucial role. Specific examples include government funding for research and development in MR technology and tax incentives for MR-related businesses.
Challenges in the Mixed Reality Industry Market
Despite its immense potential, the Mixed Reality industry faces several challenges. Regulatory hurdles, particularly concerning data privacy and security, are significant barriers. Supply chain disruptions, especially those related to the procurement of specialized components, can also impact production and market availability. Intense competitive pressures from established players and new entrants contribute to pricing pressures and the need for constant innovation. The report quantifies the impact of these challenges on market growth using various metrics and forecasts.
Emerging Opportunities in Mixed Reality Industry
The future of the Mixed Reality market presents considerable opportunities. Technological breakthroughs in areas such as haptic feedback, eye tracking, and brain-computer interfaces are poised to create more immersive and interactive experiences. Strategic partnerships between technology companies, content creators, and industry verticals will expand the reach and applications of MR technology. Market expansion into new geographical regions and industry segments will further drive growth. The report provides a comprehensive analysis of these opportunities, highlighting their potential impact on future market trends.
Leading Players in the Mixed Reality Industry Sector
- Samsung Electronics Company Limited
- Acer Inc
- Hewlett Packard Enterprise Company
- Magic Leap Inc
- Amber Garage (Holokit)
- Microsoft Corporation
- AsusTek Computer Inc
- Meta Platform Inc
- Dell Technologies Inc
- Occipital Inc
- List Not Exhaustive
Key Milestones in Mixed Reality Industry Industry
- 2020: Significant advancements in MR headset processing power and display technology.
- 2021: Increased adoption of MR in healthcare for surgical training and planning.
- 2022: Several major technology companies announce strategic investments in MR research and development.
- 2023: Several key partnerships between MR hardware and software developers.
- 2024: Release of multiple new generation MR headsets with improved features.
- (Further milestones detailed within the report)
Strategic Outlook for Mixed Reality Industry Market
The Mixed Reality industry is poised for substantial growth in the coming years, driven by continuous technological innovation, increasing adoption across diverse sectors, and strategic partnerships. The potential for immersive experiences in various applications, from education and healthcare to entertainment and engineering, presents significant opportunities for both established players and new entrants. The report concludes with actionable insights and recommendations for navigating this dynamic and rapidly evolving market.
Mixed Reality Industry Segmentation
-
1. End-user Verticals
- 1.1. Education
- 1.2. Engineering
- 1.3. Entertainment
- 1.4. Healthcare
- 1.5. Other End-user Verticals
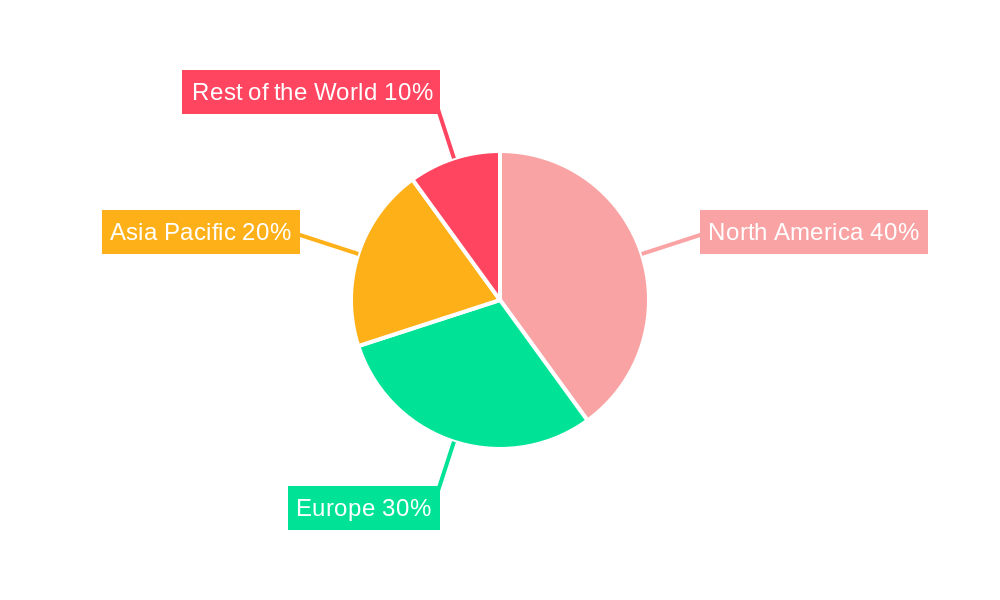
Mixed Reality Industry Segmentation By Geography
-
1. North America
- 1.1. United States
- 1.2. Canada
-
2. Europe
- 2.1. United Kingdom
- 2.2. France
- 2.3. Rest of Europe
-
3. Asia Pacific
- 3.1. China
- 3.2. India
- 3.3. Japan
- 3.4. Rest of Asia Pacific
- 4. Rest of the World
Mixed Reality Industry REPORT HIGHLIGHTS
| Aspects | Details |
|---|---|
| Study Period | 2019-2033 |
| Base Year | 2024 |
| Estimated Year | 2025 |
| Forecast Period | 2025-2033 |
| Historical Period | 2019-2024 |
| Growth Rate | CAGR of 45.34% from 2019-2033 |
| Segmentation |
|
Table of Contents
- 1. Introduction
- 1.1. Research Scope
- 1.2. Market Segmentation
- 1.3. Research Methodology
- 1.4. Definitions and Assumptions
- 2. Executive Summary
- 2.1. Introduction
- 3. Market Dynamics
- 3.1. Introduction
- 3.2. Market Drivers
- 3.2.1 High End-Electronic Consumer Market; Growing Adoption in Various Industries; Growing Awarness of Technology
- 3.2.2 along with Content Availability
- 3.3. Market Restrains
- 3.3.1. Lack of Standardization for Security of Digital Content
- 3.4. Market Trends
- 3.4.1. Education Sector will Hold a Significant Market Share
- 4. Market Factor Analysis
- 4.1. Porters Five Forces
- 4.2. Supply/Value Chain
- 4.3. PESTEL analysis
- 4.4. Market Entropy
- 4.5. Patent/Trademark Analysis
- 5. Global Mixed Reality Industry Analysis, Insights and Forecast, 2019-2031
- 5.1. Market Analysis, Insights and Forecast - by End-user Verticals
- 5.1.1. Education
- 5.1.2. Engineering
- 5.1.3. Entertainment
- 5.1.4. Healthcare
- 5.1.5. Other End-user Verticals
- 5.2. Market Analysis, Insights and Forecast - by Region
- 5.2.1. North America
- 5.2.2. Europe
- 5.2.3. Asia Pacific
- 5.2.4. Rest of the World
- 5.1. Market Analysis, Insights and Forecast - by End-user Verticals
- 6. North America Mixed Reality Industry Analysis, Insights and Forecast, 2019-2031
- 6.1. Market Analysis, Insights and Forecast - by End-user Verticals
- 6.1.1. Education
- 6.1.2. Engineering
- 6.1.3. Entertainment
- 6.1.4. Healthcare
- 6.1.5. Other End-user Verticals
- 6.1. Market Analysis, Insights and Forecast - by End-user Verticals
- 7. Europe Mixed Reality Industry Analysis, Insights and Forecast, 2019-2031
- 7.1. Market Analysis, Insights and Forecast - by End-user Verticals
- 7.1.1. Education
- 7.1.2. Engineering
- 7.1.3. Entertainment
- 7.1.4. Healthcare
- 7.1.5. Other End-user Verticals
- 7.1. Market Analysis, Insights and Forecast - by End-user Verticals
- 8. Asia Pacific Mixed Reality Industry Analysis, Insights and Forecast, 2019-2031
- 8.1. Market Analysis, Insights and Forecast - by End-user Verticals
- 8.1.1. Education
- 8.1.2. Engineering
- 8.1.3. Entertainment
- 8.1.4. Healthcare
- 8.1.5. Other End-user Verticals
- 8.1. Market Analysis, Insights and Forecast - by End-user Verticals
- 9. Rest of the World Mixed Reality Industry Analysis, Insights and Forecast, 2019-2031
- 9.1. Market Analysis, Insights and Forecast - by End-user Verticals
- 9.1.1. Education
- 9.1.2. Engineering
- 9.1.3. Entertainment
- 9.1.4. Healthcare
- 9.1.5. Other End-user Verticals
- 9.1. Market Analysis, Insights and Forecast - by End-user Verticals
- 10. North America Mixed Reality Industry Analysis, Insights and Forecast, 2019-2031
- 10.1. Market Analysis, Insights and Forecast - By Country/Sub-region
- 10.1.1 United States
- 10.1.2 Canada
- 11. Europe Mixed Reality Industry Analysis, Insights and Forecast, 2019-2031
- 11.1. Market Analysis, Insights and Forecast - By Country/Sub-region
- 11.1.1 United Kingdom
- 11.1.2 France
- 11.1.3 Rest of Europe
- 12. Asia Pacific Mixed Reality Industry Analysis, Insights and Forecast, 2019-2031
- 12.1. Market Analysis, Insights and Forecast - By Country/Sub-region
- 12.1.1 China
- 12.1.2 India
- 12.1.3 Japan
- 12.1.4 Rest of Asia Pacific
- 13. Rest of the World Mixed Reality Industry Analysis, Insights and Forecast, 2019-2031
- 13.1. Market Analysis, Insights and Forecast - By Country/Sub-region
- 13.1.1.
- 14. Competitive Analysis
- 14.1. Global Market Share Analysis 2024
- 14.2. Company Profiles
- 14.2.1 Samsung Electronics Company Limited
- 14.2.1.1. Overview
- 14.2.1.2. Products
- 14.2.1.3. SWOT Analysis
- 14.2.1.4. Recent Developments
- 14.2.1.5. Financials (Based on Availability)
- 14.2.2 Acer Inc
- 14.2.2.1. Overview
- 14.2.2.2. Products
- 14.2.2.3. SWOT Analysis
- 14.2.2.4. Recent Developments
- 14.2.2.5. Financials (Based on Availability)
- 14.2.3 Hewlett Packard Enterprise Company
- 14.2.3.1. Overview
- 14.2.3.2. Products
- 14.2.3.3. SWOT Analysis
- 14.2.3.4. Recent Developments
- 14.2.3.5. Financials (Based on Availability)
- 14.2.4 Magic Leap Inc
- 14.2.4.1. Overview
- 14.2.4.2. Products
- 14.2.4.3. SWOT Analysis
- 14.2.4.4. Recent Developments
- 14.2.4.5. Financials (Based on Availability)
- 14.2.5 Amber Garage (Holokit)
- 14.2.5.1. Overview
- 14.2.5.2. Products
- 14.2.5.3. SWOT Analysis
- 14.2.5.4. Recent Developments
- 14.2.5.5. Financials (Based on Availability)
- 14.2.6 Microsoft Corporation
- 14.2.6.1. Overview
- 14.2.6.2. Products
- 14.2.6.3. SWOT Analysis
- 14.2.6.4. Recent Developments
- 14.2.6.5. Financials (Based on Availability)
- 14.2.7 AsusTek Computer Inc
- 14.2.7.1. Overview
- 14.2.7.2. Products
- 14.2.7.3. SWOT Analysis
- 14.2.7.4. Recent Developments
- 14.2.7.5. Financials (Based on Availability)
- 14.2.8 Meta Platform Inc
- 14.2.8.1. Overview
- 14.2.8.2. Products
- 14.2.8.3. SWOT Analysis
- 14.2.8.4. Recent Developments
- 14.2.8.5. Financials (Based on Availability)
- 14.2.9 Dell Technologies Inc
- 14.2.9.1. Overview
- 14.2.9.2. Products
- 14.2.9.3. SWOT Analysis
- 14.2.9.4. Recent Developments
- 14.2.9.5. Financials (Based on Availability)
- 14.2.10 Occipital Inc *List Not Exhaustive
- 14.2.10.1. Overview
- 14.2.10.2. Products
- 14.2.10.3. SWOT Analysis
- 14.2.10.4. Recent Developments
- 14.2.10.5. Financials (Based on Availability)
- 14.2.1 Samsung Electronics Company Limited
List of Figures
- Figure 1: Global Mixed Reality Industry Revenue Breakdown (Million, %) by Region 2024 & 2032
- Figure 2: North America Mixed Reality Industry Revenue (Million), by Country 2024 & 2032
- Figure 3: North America Mixed Reality Industry Revenue Share (%), by Country 2024 & 2032
- Figure 4: Europe Mixed Reality Industry Revenue (Million), by Country 2024 & 2032
- Figure 5: Europe Mixed Reality Industry Revenue Share (%), by Country 2024 & 2032
- Figure 6: Asia Pacific Mixed Reality Industry Revenue (Million), by Country 2024 & 2032
- Figure 7: Asia Pacific Mixed Reality Industry Revenue Share (%), by Country 2024 & 2032
- Figure 8: Rest of the World Mixed Reality Industry Revenue (Million), by Country 2024 & 2032
- Figure 9: Rest of the World Mixed Reality Industry Revenue Share (%), by Country 2024 & 2032
- Figure 10: North America Mixed Reality Industry Revenue (Million), by End-user Verticals 2024 & 2032
- Figure 11: North America Mixed Reality Industry Revenue Share (%), by End-user Verticals 2024 & 2032
- Figure 12: North America Mixed Reality Industry Revenue (Million), by Country 2024 & 2032
- Figure 13: North America Mixed Reality Industry Revenue Share (%), by Country 2024 & 2032
- Figure 14: Europe Mixed Reality Industry Revenue (Million), by End-user Verticals 2024 & 2032
- Figure 15: Europe Mixed Reality Industry Revenue Share (%), by End-user Verticals 2024 & 2032
- Figure 16: Europe Mixed Reality Industry Revenue (Million), by Country 2024 & 2032
- Figure 17: Europe Mixed Reality Industry Revenue Share (%), by Country 2024 & 2032
- Figure 18: Asia Pacific Mixed Reality Industry Revenue (Million), by End-user Verticals 2024 & 2032
- Figure 19: Asia Pacific Mixed Reality Industry Revenue Share (%), by End-user Verticals 2024 & 2032
- Figure 20: Asia Pacific Mixed Reality Industry Revenue (Million), by Country 2024 & 2032
- Figure 21: Asia Pacific Mixed Reality Industry Revenue Share (%), by Country 2024 & 2032
- Figure 22: Rest of the World Mixed Reality Industry Revenue (Million), by End-user Verticals 2024 & 2032
- Figure 23: Rest of the World Mixed Reality Industry Revenue Share (%), by End-user Verticals 2024 & 2032
- Figure 24: Rest of the World Mixed Reality Industry Revenue (Million), by Country 2024 & 2032
- Figure 25: Rest of the World Mixed Reality Industry Revenue Share (%), by Country 2024 & 2032
List of Tables
- Table 1: Global Mixed Reality Industry Revenue Million Forecast, by Region 2019 & 2032
- Table 2: Global Mixed Reality Industry Revenue Million Forecast, by End-user Verticals 2019 & 2032
- Table 3: Global Mixed Reality Industry Revenue Million Forecast, by Region 2019 & 2032
- Table 4: Global Mixed Reality Industry Revenue Million Forecast, by Country 2019 & 2032
- Table 5: United States Mixed Reality Industry Revenue (Million) Forecast, by Application 2019 & 2032
- Table 6: Canada Mixed Reality Industry Revenue (Million) Forecast, by Application 2019 & 2032
- Table 7: Global Mixed Reality Industry Revenue Million Forecast, by Country 2019 & 2032
- Table 8: United Kingdom Mixed Reality Industry Revenue (Million) Forecast, by Application 2019 & 2032
- Table 9: France Mixed Reality Industry Revenue (Million) Forecast, by Application 2019 & 2032
- Table 10: Rest of Europe Mixed Reality Industry Revenue (Million) Forecast, by Application 2019 & 2032
- Table 11: Global Mixed Reality Industry Revenue Million Forecast, by Country 2019 & 2032
- Table 12: China Mixed Reality Industry Revenue (Million) Forecast, by Application 2019 & 2032
- Table 13: India Mixed Reality Industry Revenue (Million) Forecast, by Application 2019 & 2032
- Table 14: Japan Mixed Reality Industry Revenue (Million) Forecast, by Application 2019 & 2032
- Table 15: Rest of Asia Pacific Mixed Reality Industry Revenue (Million) Forecast, by Application 2019 & 2032
- Table 16: Global Mixed Reality Industry Revenue Million Forecast, by Country 2019 & 2032
- Table 17: Mixed Reality Industry Revenue (Million) Forecast, by Application 2019 & 2032
- Table 18: Global Mixed Reality Industry Revenue Million Forecast, by End-user Verticals 2019 & 2032
- Table 19: Global Mixed Reality Industry Revenue Million Forecast, by Country 2019 & 2032
- Table 20: United States Mixed Reality Industry Revenue (Million) Forecast, by Application 2019 & 2032
- Table 21: Canada Mixed Reality Industry Revenue (Million) Forecast, by Application 2019 & 2032
- Table 22: Global Mixed Reality Industry Revenue Million Forecast, by End-user Verticals 2019 & 2032
- Table 23: Global Mixed Reality Industry Revenue Million Forecast, by Country 2019 & 2032
- Table 24: United Kingdom Mixed Reality Industry Revenue (Million) Forecast, by Application 2019 & 2032
- Table 25: France Mixed Reality Industry Revenue (Million) Forecast, by Application 2019 & 2032
- Table 26: Rest of Europe Mixed Reality Industry Revenue (Million) Forecast, by Application 2019 & 2032
- Table 27: Global Mixed Reality Industry Revenue Million Forecast, by End-user Verticals 2019 & 2032
- Table 28: Global Mixed Reality Industry Revenue Million Forecast, by Country 2019 & 2032
- Table 29: China Mixed Reality Industry Revenue (Million) Forecast, by Application 2019 & 2032
- Table 30: India Mixed Reality Industry Revenue (Million) Forecast, by Application 2019 & 2032
- Table 31: Japan Mixed Reality Industry Revenue (Million) Forecast, by Application 2019 & 2032
- Table 32: Rest of Asia Pacific Mixed Reality Industry Revenue (Million) Forecast, by Application 2019 & 2032
- Table 33: Global Mixed Reality Industry Revenue Million Forecast, by End-user Verticals 2019 & 2032
- Table 34: Global Mixed Reality Industry Revenue Million Forecast, by Country 2019 & 2032
Frequently Asked Questions
1. What is the projected Compound Annual Growth Rate (CAGR) of the Mixed Reality Industry?
The projected CAGR is approximately 45.34%.
2. Which companies are prominent players in the Mixed Reality Industry?
Key companies in the market include Samsung Electronics Company Limited, Acer Inc, Hewlett Packard Enterprise Company, Magic Leap Inc, Amber Garage (Holokit), Microsoft Corporation, AsusTek Computer Inc, Meta Platform Inc, Dell Technologies Inc, Occipital Inc *List Not Exhaustive.
3. What are the main segments of the Mixed Reality Industry?
The market segments include End-user Verticals.
4. Can you provide details about the market size?
The market size is estimated to be USD 4.04 Million as of 2022.
5. What are some drivers contributing to market growth?
High End-Electronic Consumer Market; Growing Adoption in Various Industries; Growing Awarness of Technology. along with Content Availability.
6. What are the notable trends driving market growth?
Education Sector will Hold a Significant Market Share.
7. Are there any restraints impacting market growth?
Lack of Standardization for Security of Digital Content.
8. Can you provide examples of recent developments in the market?
N/A
9. What pricing options are available for accessing the report?
Pricing options include single-user, multi-user, and enterprise licenses priced at USD 4750, USD 5250, and USD 8750 respectively.
10. Is the market size provided in terms of value or volume?
The market size is provided in terms of value, measured in Million.
11. Are there any specific market keywords associated with the report?
Yes, the market keyword associated with the report is "Mixed Reality Industry," which aids in identifying and referencing the specific market segment covered.
12. How do I determine which pricing option suits my needs best?
The pricing options vary based on user requirements and access needs. Individual users may opt for single-user licenses, while businesses requiring broader access may choose multi-user or enterprise licenses for cost-effective access to the report.
13. Are there any additional resources or data provided in the Mixed Reality Industry report?
While the report offers comprehensive insights, it's advisable to review the specific contents or supplementary materials provided to ascertain if additional resources or data are available.
14. How can I stay updated on further developments or reports in the Mixed Reality Industry?
To stay informed about further developments, trends, and reports in the Mixed Reality Industry, consider subscribing to industry newsletters, following relevant companies and organizations, or regularly checking reputable industry news sources and publications.
Methodology
Step 1 - Identification of Relevant Samples Size from Population Database


Step 2 - Approaches for Defining Global Market Size (Value, Volume* & Price*)

Note*: In applicable scenarios
Step 3 - Data Sources
Primary Research
- Web Analytics
- Survey Reports
- Research Institute
- Latest Research Reports
- Opinion Leaders
Secondary Research
- Annual Reports
- White Paper
- Latest Press Release
- Industry Association
- Paid Database
- Investor Presentations

Step 4 - Data Triangulation
Involves using different sources of information in order to increase the validity of a study
These sources are likely to be stakeholders in a program - participants, other researchers, program staff, other community members, and so on.
Then we put all data in single framework & apply various statistical tools to find out the dynamic on the market.
During the analysis stage, feedback from the stakeholder groups would be compared to determine areas of agreement as well as areas of divergence
