

Key Insights
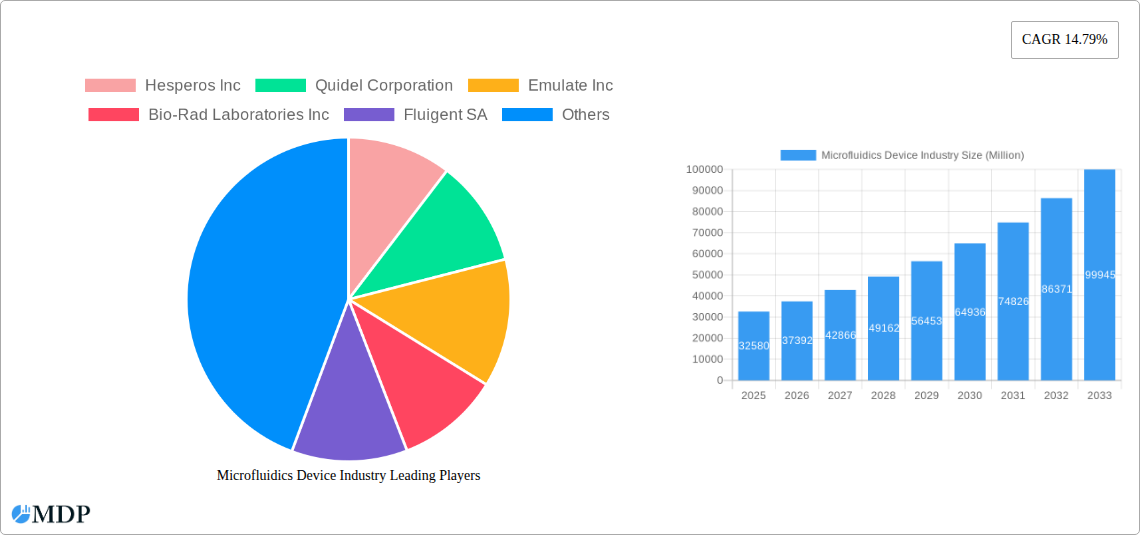
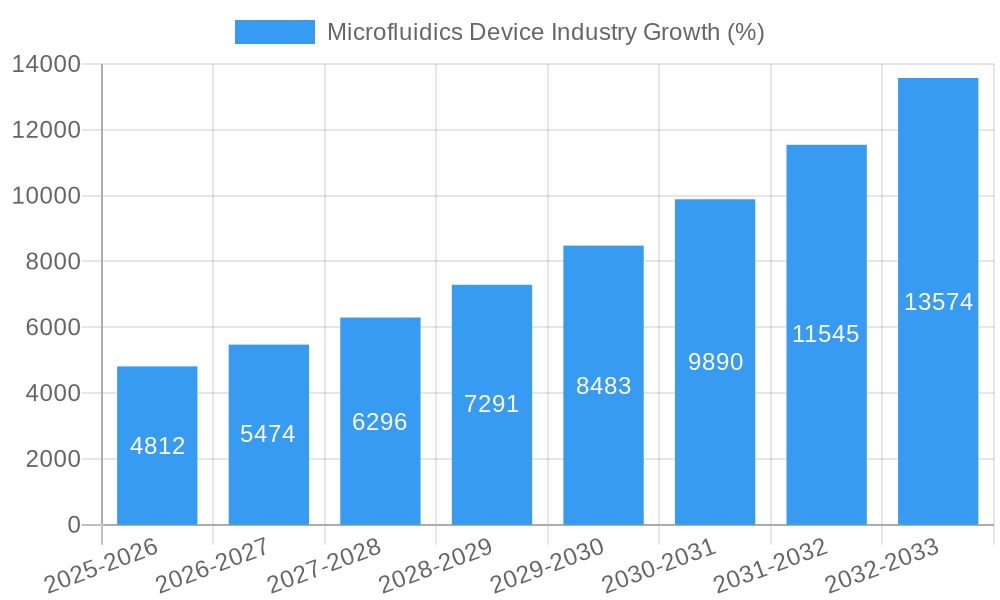
The global microfluidics device market is experiencing robust growth, projected to reach \$32.58 billion in 2025 and maintain a Compound Annual Growth Rate (CAGR) of 14.79% from 2025 to 2033. This expansion is driven primarily by the increasing demand for point-of-care diagnostics, fueled by the need for rapid and accurate disease detection in decentralized settings. The pharmaceutical and biotechnology research sectors also significantly contribute to market growth, leveraging microfluidics for drug discovery, development, and high-throughput screening. Technological advancements, such as the development of more sophisticated microfluidic devices with enhanced functionalities and integration with other analytical techniques, are further accelerating market expansion. The versatility of microfluidics in various applications, including clinical diagnostics and personalized medicine, is creating significant opportunities for market players.
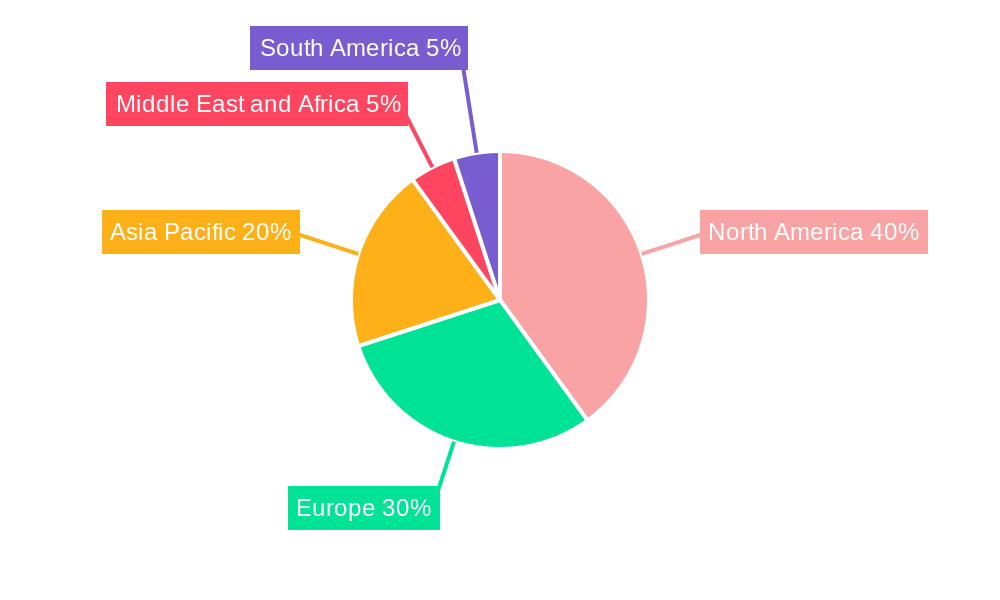
The market segmentation reveals that microfluidic-based devices represent a significant portion of the market share, followed by microfluidic components. Polymer materials dominate the material segment due to their cost-effectiveness and biocompatibility. North America currently holds a leading position in the market due to advanced healthcare infrastructure and substantial investments in research and development. However, the Asia-Pacific region is anticipated to experience substantial growth in the coming years, driven by increasing healthcare spending and a rising prevalence of chronic diseases. While factors like high initial investment costs and the complexity of microfluidic device manufacturing can pose challenges, the overall market outlook remains positive, with continued innovation and market penetration expected across diverse applications. Competition among established players and emerging companies is intense, driving further technological advancements and market consolidation.
Microfluidics Device Industry: A Comprehensive Market Report (2019-2033)
This in-depth report provides a comprehensive analysis of the global microfluidics device industry, offering invaluable insights for stakeholders, investors, and industry professionals. With a detailed study period spanning from 2019 to 2033, including a base year of 2025 and a forecast period from 2025 to 2033, this report delivers actionable intelligence for informed decision-making. The market is segmented by product type (Microfluidic-based Devices, Microfluidic Components), application (Drug Delivery, Point-of-care Diagnostics, Pharmaceutical and Biotechnology Research, Clinical Diagnostics, Other Applications), and material (Polymer, Silicone, Glass, Other Materials). Key players analyzed include Hesperos Inc, Quidel Corporation, Emulate Inc, Bio-Rad Laboratories Inc, Fluigent SA, ZEON CORPORATION, Dolomite Microfluidics (Blacktrace Holdings Ltd), Micronit Microfluidics, Biosurfit SA, Bartels-Mikrotechnik, Sphere Fluidics Limited, Agilent Technologies Inc, UFluidix, PerkinElmer Inc, Illumina Inc, FluIdigm Corporation, and Nanomix Inc. The report projects a market value exceeding xx Million by 2033.
Microfluidics Device Industry Market Dynamics & Concentration
The global microfluidics device market is characterized by a moderately concentrated landscape, with several major players holding significant market share. However, the presence of numerous smaller companies and startups indicates a dynamic competitive environment. Innovation is a key driver, fueled by advancements in materials science, miniaturization technologies, and the increasing demand for sophisticated diagnostic and therapeutic tools. Stringent regulatory frameworks, particularly in the healthcare sector, influence product development and market access. The market witnesses continuous product substitution as newer technologies with improved performance and cost-effectiveness emerge. End-user trends, including the preference for point-of-care diagnostics and personalized medicine, significantly impact market growth. Mergers and acquisitions (M&A) activity is relatively high, indicating consolidation and strategic expansion within the industry. The estimated number of M&A deals in the period 2019-2024 is approximately xx, with an average deal value of xx Million. Market leaders collectively hold an estimated xx% market share, while the remaining share is distributed among numerous smaller players.
Microfluidics Device Industry Industry Trends & Analysis
The microfluidics device industry is experiencing robust growth, driven by several key factors. The rising prevalence of chronic diseases is increasing the demand for point-of-care diagnostics, a major application segment. Advancements in microfabrication techniques are enabling the development of more sophisticated and efficient devices. Consumer preference for personalized medicine and rapid diagnostics fuels the adoption of microfluidic-based solutions. The market exhibits strong competitive dynamics, with companies focusing on product innovation, strategic partnerships, and expansion into new geographical markets. The compound annual growth rate (CAGR) for the period 2025-2033 is projected to be xx%, driven primarily by the increasing demand in pharmaceutical and biotechnology research. Market penetration in emerging economies is also expected to increase significantly, contributing to overall growth. Technological disruptions, such as the integration of artificial intelligence and automation, are further accelerating market expansion.
Leading Markets & Segments in Microfluidics Device Industry
Dominant Region: North America currently holds the largest market share, driven by strong R&D investments, advanced healthcare infrastructure, and a significant presence of key players. Europe and Asia-Pacific follow closely, exhibiting strong growth potential.
Dominant Segment (Product Type): Microfluidic-based devices account for a larger market share than microfluidic components, due to their extensive application across diverse fields.
Dominant Segment (Application): The pharmaceutical and biotechnology research segment holds the largest market share, followed by point-of-care diagnostics. The drug delivery segment is also experiencing significant growth.
Dominant Segment (Material): Polymer materials dominate the market due to their versatility, biocompatibility, and cost-effectiveness.
Key Drivers:
- North America: Strong government funding for R&D, robust healthcare infrastructure, and a large pool of skilled professionals.
- Europe: Growing investments in personalized medicine and point-of-care diagnostics.
- Asia-Pacific: Increasing healthcare expenditure and a rising prevalence of chronic diseases.
Microfluidics Device Industry Product Developments
Recent product innovations include advanced microfluidic chips with improved sensitivity and throughput for various applications, including genomics, proteomics, and cell analysis. Integration of microfluidics with other technologies, such as lab-on-a-chip devices and point-of-care diagnostic platforms, enhances their capabilities and broadens their applications. Companies are focusing on developing miniaturized, portable, and user-friendly devices to expand market access and improve patient care. These developments are driving market growth by improving the speed, accuracy, and affordability of various diagnostic and therapeutic procedures.
Key Drivers of Microfluidics Device Industry Growth
Technological advancements, such as the development of novel materials and microfabrication techniques, are driving industry growth. Increasing demand for high-throughput screening in drug discovery and personalized medicine is fueling market expansion. Favorable regulatory frameworks in some regions are encouraging innovation and market entry. For example, the FDA's initiatives to accelerate the approval of innovative diagnostic devices contribute to this growth. Government investments in healthcare infrastructure and R&D initiatives further stimulate market expansion.
Challenges in the Microfluidics Device Industry Market
High manufacturing costs and the complexity of device fabrication pose significant challenges. Stringent regulatory requirements and lengthy approval processes can delay product launches and limit market access. The need for specialized skills and expertise limits the accessibility of this technology for smaller companies. Supply chain disruptions and the reliance on specialized materials can impact production and profitability. Intense competition among established players and emerging startups further increases market pressure. These challenges collectively limit the industry's growth potential.
Emerging Opportunities in Microfluidics Device Industry
The integration of artificial intelligence and machine learning in microfluidic systems offers significant opportunities for improved diagnostics and automation. Strategic collaborations between microfluidics companies and pharmaceutical/biotechnology firms can lead to the development of innovative diagnostic and therapeutic tools. Expansion into emerging markets with significant unmet healthcare needs presents immense growth potential. Advancements in materials science, such as the development of biocompatible and biodegradable polymers, are opening new avenues for application.
Leading Players in the Microfluidics Device Industry Sector
- Hesperos Inc
- Quidel Corporation
- Emulate Inc
- Bio-Rad Laboratories Inc
- Fluigent SA
- ZEON CORPORATION
- Dolomite Microfluidics (Blacktrace Holdings Ltd)
- Micronit Microfluidics
- Biosurfit SA
- Bartels-Mikrotechnik
- Sphere Fluidics Limited
- Agilent Technologies Inc
- UFluidix
- PerkinElmer Inc
- Illumina Inc
- FluIdigm Corporation
- Nanomix Inc
Key Milestones in Microfluidics Device Industry Industry
- November 2023: Microfluidics (IDEX MPT) launched a new processor for production-scale cell disruption, impacting vaccine and gene therapy manufacturing.
- January 2023: SCIEX launched the Intabio ZT system, a fully integrated microfluidic platform combining icIEF separation and UV detection, advancing proteomics research.
Strategic Outlook for Microfluidics Device Industry Market
The microfluidics device market is poised for significant growth driven by continued technological innovation, expanding applications, and increasing demand across healthcare and research sectors. Strategic partnerships, focused R&D investments, and expansion into new geographical markets are key growth accelerators. The market's future potential lies in the development of highly integrated, automated, and AI-powered microfluidic systems capable of performing complex analyses with high precision and efficiency.
Microfluidics Device Industry Segmentation
-
1. Product Type
- 1.1. Microfluidic-based Devices
-
1.2. Microfluidic Components
- 1.2.1. Microfluidic Chips
- 1.2.2. Micro Pumps
- 1.2.3. Microneedles
- 1.2.4. Other Product Types
-
2. Application
- 2.1. Drug Delivery
- 2.2. Point-of-care Diagnostics
- 2.3. Pharmaceutical and Biotechnology Research
-
3. Material
- 3.1. Polymer
- 3.2. Silicone
- 3.3. Glass
Microfluidics Device Industry Segmentation By Geography
-
1. North America
- 1.1. United States
- 1.2. Canada
- 1.3. Mexico
-
2. Europe
- 2.1. France
- 2.2. United Kingdom
- 2.3. Germany
- 2.4. Italy
- 2.5. Spain
- 2.6. Rest of Europe
-
3. Asia Pacific
- 3.1. China
- 3.2. Japan
- 3.3. India
- 3.4. Australia
- 3.5. South Korea
- 3.6. Rest of Asia Pacific
-
4. Middle East and Africa
- 4.1. GCC
- 4.2. South Africa
- 4.3. Rest of Middle East and Africa
-
5. South America
- 5.1. Brazil
- 5.2. Argentina
- 5.3. Rest of South America
Microfluidics Device Industry REPORT HIGHLIGHTS
| Aspects | Details |
|---|---|
| Study Period | 2019-2033 |
| Base Year | 2024 |
| Estimated Year | 2025 |
| Forecast Period | 2025-2033 |
| Historical Period | 2019-2024 |
| Growth Rate | CAGR of 14.79% from 2019-2033 |
| Segmentation |
|
Table of Contents
- 1. Introduction
- 1.1. Research Scope
- 1.2. Market Segmentation
- 1.3. Research Methodology
- 1.4. Definitions and Assumptions
- 2. Executive Summary
- 2.1. Introduction
- 3. Market Dynamics
- 3.1. Introduction
- 3.2. Market Drivers
- 3.2.1. Increasing Demand for Point-of-care Testing; Increasing Incidences of Various Diseases; Faster Turn-around Time for Analysis and Improved Portability of Devices
- 3.3. Market Restrains
- 3.3.1. Integration of Microfluidics Technology with Existing Workflows; Low Adoption in Developing Countries Due to High Prices
- 3.4. Market Trends
- 3.4.1. The Point-of-Care Diagnostics Segment is Expected to Witness Considerable Growth During the Forecast Period
- 4. Market Factor Analysis
- 4.1. Porters Five Forces
- 4.2. Supply/Value Chain
- 4.3. PESTEL analysis
- 4.4. Market Entropy
- 4.5. Patent/Trademark Analysis
- 5. Global Microfluidics Device Industry Analysis, Insights and Forecast, 2019-2031
- 5.1. Market Analysis, Insights and Forecast - by Product Type
- 5.1.1. Microfluidic-based Devices
- 5.1.2. Microfluidic Components
- 5.1.2.1. Microfluidic Chips
- 5.1.2.2. Micro Pumps
- 5.1.2.3. Microneedles
- 5.1.2.4. Other Product Types
- 5.2. Market Analysis, Insights and Forecast - by Application
- 5.2.1. Drug Delivery
- 5.2.2. Point-of-care Diagnostics
- 5.2.3. Pharmaceutical and Biotechnology Research
- 5.3. Market Analysis, Insights and Forecast - by Material
- 5.3.1. Polymer
- 5.3.2. Silicone
- 5.3.3. Glass
- 5.4. Market Analysis, Insights and Forecast - by Region
- 5.4.1. North America
- 5.4.2. Europe
- 5.4.3. Asia Pacific
- 5.4.4. Middle East and Africa
- 5.4.5. South America
- 5.1. Market Analysis, Insights and Forecast - by Product Type
- 6. North America Microfluidics Device Industry Analysis, Insights and Forecast, 2019-2031
- 6.1. Market Analysis, Insights and Forecast - by Product Type
- 6.1.1. Microfluidic-based Devices
- 6.1.2. Microfluidic Components
- 6.1.2.1. Microfluidic Chips
- 6.1.2.2. Micro Pumps
- 6.1.2.3. Microneedles
- 6.1.2.4. Other Product Types
- 6.2. Market Analysis, Insights and Forecast - by Application
- 6.2.1. Drug Delivery
- 6.2.2. Point-of-care Diagnostics
- 6.2.3. Pharmaceutical and Biotechnology Research
- 6.3. Market Analysis, Insights and Forecast - by Material
- 6.3.1. Polymer
- 6.3.2. Silicone
- 6.3.3. Glass
- 6.1. Market Analysis, Insights and Forecast - by Product Type
- 7. Europe Microfluidics Device Industry Analysis, Insights and Forecast, 2019-2031
- 7.1. Market Analysis, Insights and Forecast - by Product Type
- 7.1.1. Microfluidic-based Devices
- 7.1.2. Microfluidic Components
- 7.1.2.1. Microfluidic Chips
- 7.1.2.2. Micro Pumps
- 7.1.2.3. Microneedles
- 7.1.2.4. Other Product Types
- 7.2. Market Analysis, Insights and Forecast - by Application
- 7.2.1. Drug Delivery
- 7.2.2. Point-of-care Diagnostics
- 7.2.3. Pharmaceutical and Biotechnology Research
- 7.3. Market Analysis, Insights and Forecast - by Material
- 7.3.1. Polymer
- 7.3.2. Silicone
- 7.3.3. Glass
- 7.1. Market Analysis, Insights and Forecast - by Product Type
- 8. Asia Pacific Microfluidics Device Industry Analysis, Insights and Forecast, 2019-2031
- 8.1. Market Analysis, Insights and Forecast - by Product Type
- 8.1.1. Microfluidic-based Devices
- 8.1.2. Microfluidic Components
- 8.1.2.1. Microfluidic Chips
- 8.1.2.2. Micro Pumps
- 8.1.2.3. Microneedles
- 8.1.2.4. Other Product Types
- 8.2. Market Analysis, Insights and Forecast - by Application
- 8.2.1. Drug Delivery
- 8.2.2. Point-of-care Diagnostics
- 8.2.3. Pharmaceutical and Biotechnology Research
- 8.3. Market Analysis, Insights and Forecast - by Material
- 8.3.1. Polymer
- 8.3.2. Silicone
- 8.3.3. Glass
- 8.1. Market Analysis, Insights and Forecast - by Product Type
- 9. Middle East and Africa Microfluidics Device Industry Analysis, Insights and Forecast, 2019-2031
- 9.1. Market Analysis, Insights and Forecast - by Product Type
- 9.1.1. Microfluidic-based Devices
- 9.1.2. Microfluidic Components
- 9.1.2.1. Microfluidic Chips
- 9.1.2.2. Micro Pumps
- 9.1.2.3. Microneedles
- 9.1.2.4. Other Product Types
- 9.2. Market Analysis, Insights and Forecast - by Application
- 9.2.1. Drug Delivery
- 9.2.2. Point-of-care Diagnostics
- 9.2.3. Pharmaceutical and Biotechnology Research
- 9.3. Market Analysis, Insights and Forecast - by Material
- 9.3.1. Polymer
- 9.3.2. Silicone
- 9.3.3. Glass
- 9.1. Market Analysis, Insights and Forecast - by Product Type
- 10. South America Microfluidics Device Industry Analysis, Insights and Forecast, 2019-2031
- 10.1. Market Analysis, Insights and Forecast - by Product Type
- 10.1.1. Microfluidic-based Devices
- 10.1.2. Microfluidic Components
- 10.1.2.1. Microfluidic Chips
- 10.1.2.2. Micro Pumps
- 10.1.2.3. Microneedles
- 10.1.2.4. Other Product Types
- 10.2. Market Analysis, Insights and Forecast - by Application
- 10.2.1. Drug Delivery
- 10.2.2. Point-of-care Diagnostics
- 10.2.3. Pharmaceutical and Biotechnology Research
- 10.3. Market Analysis, Insights and Forecast - by Material
- 10.3.1. Polymer
- 10.3.2. Silicone
- 10.3.3. Glass
- 10.1. Market Analysis, Insights and Forecast - by Product Type
- 11. North America Microfluidics Device Industry Analysis, Insights and Forecast, 2019-2031
- 11.1. Market Analysis, Insights and Forecast - By Country/Sub-region
- 11.1.1 United States
- 11.1.2 Canada
- 11.1.3 Mexico
- 12. Europe Microfluidics Device Industry Analysis, Insights and Forecast, 2019-2031
- 12.1. Market Analysis, Insights and Forecast - By Country/Sub-region
- 12.1.1 France
- 12.1.2 United Kingdom
- 12.1.3 Germany
- 12.1.4 Italy
- 12.1.5 Spain
- 12.1.6 Rest of Europe
- 13. Asia Pacific Microfluidics Device Industry Analysis, Insights and Forecast, 2019-2031
- 13.1. Market Analysis, Insights and Forecast - By Country/Sub-region
- 13.1.1 China
- 13.1.2 Japan
- 13.1.3 India
- 13.1.4 Australia
- 13.1.5 South Korea
- 13.1.6 Rest of Asia Pacific
- 14. Middle East and Africa Microfluidics Device Industry Analysis, Insights and Forecast, 2019-2031
- 14.1. Market Analysis, Insights and Forecast - By Country/Sub-region
- 14.1.1 GCC
- 14.1.2 South Africa
- 14.1.3 Rest of Middle East and Africa
- 15. South America Microfluidics Device Industry Analysis, Insights and Forecast, 2019-2031
- 15.1. Market Analysis, Insights and Forecast - By Country/Sub-region
- 15.1.1 Brazil
- 15.1.2 Argentina
- 15.1.3 Rest of South America
- 16. Competitive Analysis
- 16.1. Global Market Share Analysis 2024
- 16.2. Company Profiles
- 16.2.1 Hesperos Inc
- 16.2.1.1. Overview
- 16.2.1.2. Products
- 16.2.1.3. SWOT Analysis
- 16.2.1.4. Recent Developments
- 16.2.1.5. Financials (Based on Availability)
- 16.2.2 Quidel Corporation
- 16.2.2.1. Overview
- 16.2.2.2. Products
- 16.2.2.3. SWOT Analysis
- 16.2.2.4. Recent Developments
- 16.2.2.5. Financials (Based on Availability)
- 16.2.3 Emulate Inc
- 16.2.3.1. Overview
- 16.2.3.2. Products
- 16.2.3.3. SWOT Analysis
- 16.2.3.4. Recent Developments
- 16.2.3.5. Financials (Based on Availability)
- 16.2.4 Bio-Rad Laboratories Inc
- 16.2.4.1. Overview
- 16.2.4.2. Products
- 16.2.4.3. SWOT Analysis
- 16.2.4.4. Recent Developments
- 16.2.4.5. Financials (Based on Availability)
- 16.2.5 Fluigent SA
- 16.2.5.1. Overview
- 16.2.5.2. Products
- 16.2.5.3. SWOT Analysis
- 16.2.5.4. Recent Developments
- 16.2.5.5. Financials (Based on Availability)
- 16.2.6 ZEON CORPORATION
- 16.2.6.1. Overview
- 16.2.6.2. Products
- 16.2.6.3. SWOT Analysis
- 16.2.6.4. Recent Developments
- 16.2.6.5. Financials (Based on Availability)
- 16.2.7 Dolomite Microfluidics (Blacktrace Holdings Ltd)
- 16.2.7.1. Overview
- 16.2.7.2. Products
- 16.2.7.3. SWOT Analysis
- 16.2.7.4. Recent Developments
- 16.2.7.5. Financials (Based on Availability)
- 16.2.8 Micronit Microfluidics
- 16.2.8.1. Overview
- 16.2.8.2. Products
- 16.2.8.3. SWOT Analysis
- 16.2.8.4. Recent Developments
- 16.2.8.5. Financials (Based on Availability)
- 16.2.9 Biosurfit SA
- 16.2.9.1. Overview
- 16.2.9.2. Products
- 16.2.9.3. SWOT Analysis
- 16.2.9.4. Recent Developments
- 16.2.9.5. Financials (Based on Availability)
- 16.2.10 Bartels-Mikrotechnik
- 16.2.10.1. Overview
- 16.2.10.2. Products
- 16.2.10.3. SWOT Analysis
- 16.2.10.4. Recent Developments
- 16.2.10.5. Financials (Based on Availability)
- 16.2.11 Sphere Fluidics Limited
- 16.2.11.1. Overview
- 16.2.11.2. Products
- 16.2.11.3. SWOT Analysis
- 16.2.11.4. Recent Developments
- 16.2.11.5. Financials (Based on Availability)
- 16.2.12 Agilent Technologies Inc
- 16.2.12.1. Overview
- 16.2.12.2. Products
- 16.2.12.3. SWOT Analysis
- 16.2.12.4. Recent Developments
- 16.2.12.5. Financials (Based on Availability)
- 16.2.13 UFluidix
- 16.2.13.1. Overview
- 16.2.13.2. Products
- 16.2.13.3. SWOT Analysis
- 16.2.13.4. Recent Developments
- 16.2.13.5. Financials (Based on Availability)
- 16.2.14 PerkinElmer Inc
- 16.2.14.1. Overview
- 16.2.14.2. Products
- 16.2.14.3. SWOT Analysis
- 16.2.14.4. Recent Developments
- 16.2.14.5. Financials (Based on Availability)
- 16.2.15 Illumina Inc
- 16.2.15.1. Overview
- 16.2.15.2. Products
- 16.2.15.3. SWOT Analysis
- 16.2.15.4. Recent Developments
- 16.2.15.5. Financials (Based on Availability)
- 16.2.16 FluIdigm Corporation
- 16.2.16.1. Overview
- 16.2.16.2. Products
- 16.2.16.3. SWOT Analysis
- 16.2.16.4. Recent Developments
- 16.2.16.5. Financials (Based on Availability)
- 16.2.17 Nanomix Inc
- 16.2.17.1. Overview
- 16.2.17.2. Products
- 16.2.17.3. SWOT Analysis
- 16.2.17.4. Recent Developments
- 16.2.17.5. Financials (Based on Availability)
- 16.2.1 Hesperos Inc
List of Figures
- Figure 1: Global Microfluidics Device Industry Revenue Breakdown (Million, %) by Region 2024 & 2032
- Figure 2: Global Microfluidics Device Industry Volume Breakdown (K Unit, %) by Region 2024 & 2032
- Figure 3: North America Microfluidics Device Industry Revenue (Million), by Country 2024 & 2032
- Figure 4: North America Microfluidics Device Industry Volume (K Unit), by Country 2024 & 2032
- Figure 5: North America Microfluidics Device Industry Revenue Share (%), by Country 2024 & 2032
- Figure 6: North America Microfluidics Device Industry Volume Share (%), by Country 2024 & 2032
- Figure 7: Europe Microfluidics Device Industry Revenue (Million), by Country 2024 & 2032
- Figure 8: Europe Microfluidics Device Industry Volume (K Unit), by Country 2024 & 2032
- Figure 9: Europe Microfluidics Device Industry Revenue Share (%), by Country 2024 & 2032
- Figure 10: Europe Microfluidics Device Industry Volume Share (%), by Country 2024 & 2032
- Figure 11: Asia Pacific Microfluidics Device Industry Revenue (Million), by Country 2024 & 2032
- Figure 12: Asia Pacific Microfluidics Device Industry Volume (K Unit), by Country 2024 & 2032
- Figure 13: Asia Pacific Microfluidics Device Industry Revenue Share (%), by Country 2024 & 2032
- Figure 14: Asia Pacific Microfluidics Device Industry Volume Share (%), by Country 2024 & 2032
- Figure 15: Middle East and Africa Microfluidics Device Industry Revenue (Million), by Country 2024 & 2032
- Figure 16: Middle East and Africa Microfluidics Device Industry Volume (K Unit), by Country 2024 & 2032
- Figure 17: Middle East and Africa Microfluidics Device Industry Revenue Share (%), by Country 2024 & 2032
- Figure 18: Middle East and Africa Microfluidics Device Industry Volume Share (%), by Country 2024 & 2032
- Figure 19: South America Microfluidics Device Industry Revenue (Million), by Country 2024 & 2032
- Figure 20: South America Microfluidics Device Industry Volume (K Unit), by Country 2024 & 2032
- Figure 21: South America Microfluidics Device Industry Revenue Share (%), by Country 2024 & 2032
- Figure 22: South America Microfluidics Device Industry Volume Share (%), by Country 2024 & 2032
- Figure 23: North America Microfluidics Device Industry Revenue (Million), by Product Type 2024 & 2032
- Figure 24: North America Microfluidics Device Industry Volume (K Unit), by Product Type 2024 & 2032
- Figure 25: North America Microfluidics Device Industry Revenue Share (%), by Product Type 2024 & 2032
- Figure 26: North America Microfluidics Device Industry Volume Share (%), by Product Type 2024 & 2032
- Figure 27: North America Microfluidics Device Industry Revenue (Million), by Application 2024 & 2032
- Figure 28: North America Microfluidics Device Industry Volume (K Unit), by Application 2024 & 2032
- Figure 29: North America Microfluidics Device Industry Revenue Share (%), by Application 2024 & 2032
- Figure 30: North America Microfluidics Device Industry Volume Share (%), by Application 2024 & 2032
- Figure 31: North America Microfluidics Device Industry Revenue (Million), by Material 2024 & 2032
- Figure 32: North America Microfluidics Device Industry Volume (K Unit), by Material 2024 & 2032
- Figure 33: North America Microfluidics Device Industry Revenue Share (%), by Material 2024 & 2032
- Figure 34: North America Microfluidics Device Industry Volume Share (%), by Material 2024 & 2032
- Figure 35: North America Microfluidics Device Industry Revenue (Million), by Country 2024 & 2032
- Figure 36: North America Microfluidics Device Industry Volume (K Unit), by Country 2024 & 2032
- Figure 37: North America Microfluidics Device Industry Revenue Share (%), by Country 2024 & 2032
- Figure 38: North America Microfluidics Device Industry Volume Share (%), by Country 2024 & 2032
- Figure 39: Europe Microfluidics Device Industry Revenue (Million), by Product Type 2024 & 2032
- Figure 40: Europe Microfluidics Device Industry Volume (K Unit), by Product Type 2024 & 2032
- Figure 41: Europe Microfluidics Device Industry Revenue Share (%), by Product Type 2024 & 2032
- Figure 42: Europe Microfluidics Device Industry Volume Share (%), by Product Type 2024 & 2032
- Figure 43: Europe Microfluidics Device Industry Revenue (Million), by Application 2024 & 2032
- Figure 44: Europe Microfluidics Device Industry Volume (K Unit), by Application 2024 & 2032
- Figure 45: Europe Microfluidics Device Industry Revenue Share (%), by Application 2024 & 2032
- Figure 46: Europe Microfluidics Device Industry Volume Share (%), by Application 2024 & 2032
- Figure 47: Europe Microfluidics Device Industry Revenue (Million), by Material 2024 & 2032
- Figure 48: Europe Microfluidics Device Industry Volume (K Unit), by Material 2024 & 2032
- Figure 49: Europe Microfluidics Device Industry Revenue Share (%), by Material 2024 & 2032
- Figure 50: Europe Microfluidics Device Industry Volume Share (%), by Material 2024 & 2032
- Figure 51: Europe Microfluidics Device Industry Revenue (Million), by Country 2024 & 2032
- Figure 52: Europe Microfluidics Device Industry Volume (K Unit), by Country 2024 & 2032
- Figure 53: Europe Microfluidics Device Industry Revenue Share (%), by Country 2024 & 2032
- Figure 54: Europe Microfluidics Device Industry Volume Share (%), by Country 2024 & 2032
- Figure 55: Asia Pacific Microfluidics Device Industry Revenue (Million), by Product Type 2024 & 2032
- Figure 56: Asia Pacific Microfluidics Device Industry Volume (K Unit), by Product Type 2024 & 2032
- Figure 57: Asia Pacific Microfluidics Device Industry Revenue Share (%), by Product Type 2024 & 2032
- Figure 58: Asia Pacific Microfluidics Device Industry Volume Share (%), by Product Type 2024 & 2032
- Figure 59: Asia Pacific Microfluidics Device Industry Revenue (Million), by Application 2024 & 2032
- Figure 60: Asia Pacific Microfluidics Device Industry Volume (K Unit), by Application 2024 & 2032
- Figure 61: Asia Pacific Microfluidics Device Industry Revenue Share (%), by Application 2024 & 2032
- Figure 62: Asia Pacific Microfluidics Device Industry Volume Share (%), by Application 2024 & 2032
- Figure 63: Asia Pacific Microfluidics Device Industry Revenue (Million), by Material 2024 & 2032
- Figure 64: Asia Pacific Microfluidics Device Industry Volume (K Unit), by Material 2024 & 2032
- Figure 65: Asia Pacific Microfluidics Device Industry Revenue Share (%), by Material 2024 & 2032
- Figure 66: Asia Pacific Microfluidics Device Industry Volume Share (%), by Material 2024 & 2032
- Figure 67: Asia Pacific Microfluidics Device Industry Revenue (Million), by Country 2024 & 2032
- Figure 68: Asia Pacific Microfluidics Device Industry Volume (K Unit), by Country 2024 & 2032
- Figure 69: Asia Pacific Microfluidics Device Industry Revenue Share (%), by Country 2024 & 2032
- Figure 70: Asia Pacific Microfluidics Device Industry Volume Share (%), by Country 2024 & 2032
- Figure 71: Middle East and Africa Microfluidics Device Industry Revenue (Million), by Product Type 2024 & 2032
- Figure 72: Middle East and Africa Microfluidics Device Industry Volume (K Unit), by Product Type 2024 & 2032
- Figure 73: Middle East and Africa Microfluidics Device Industry Revenue Share (%), by Product Type 2024 & 2032
- Figure 74: Middle East and Africa Microfluidics Device Industry Volume Share (%), by Product Type 2024 & 2032
- Figure 75: Middle East and Africa Microfluidics Device Industry Revenue (Million), by Application 2024 & 2032
- Figure 76: Middle East and Africa Microfluidics Device Industry Volume (K Unit), by Application 2024 & 2032
- Figure 77: Middle East and Africa Microfluidics Device Industry Revenue Share (%), by Application 2024 & 2032
- Figure 78: Middle East and Africa Microfluidics Device Industry Volume Share (%), by Application 2024 & 2032
- Figure 79: Middle East and Africa Microfluidics Device Industry Revenue (Million), by Material 2024 & 2032
- Figure 80: Middle East and Africa Microfluidics Device Industry Volume (K Unit), by Material 2024 & 2032
- Figure 81: Middle East and Africa Microfluidics Device Industry Revenue Share (%), by Material 2024 & 2032
- Figure 82: Middle East and Africa Microfluidics Device Industry Volume Share (%), by Material 2024 & 2032
- Figure 83: Middle East and Africa Microfluidics Device Industry Revenue (Million), by Country 2024 & 2032
- Figure 84: Middle East and Africa Microfluidics Device Industry Volume (K Unit), by Country 2024 & 2032
- Figure 85: Middle East and Africa Microfluidics Device Industry Revenue Share (%), by Country 2024 & 2032
- Figure 86: Middle East and Africa Microfluidics Device Industry Volume Share (%), by Country 2024 & 2032
- Figure 87: South America Microfluidics Device Industry Revenue (Million), by Product Type 2024 & 2032
- Figure 88: South America Microfluidics Device Industry Volume (K Unit), by Product Type 2024 & 2032
- Figure 89: South America Microfluidics Device Industry Revenue Share (%), by Product Type 2024 & 2032
- Figure 90: South America Microfluidics Device Industry Volume Share (%), by Product Type 2024 & 2032
- Figure 91: South America Microfluidics Device Industry Revenue (Million), by Application 2024 & 2032
- Figure 92: South America Microfluidics Device Industry Volume (K Unit), by Application 2024 & 2032
- Figure 93: South America Microfluidics Device Industry Revenue Share (%), by Application 2024 & 2032
- Figure 94: South America Microfluidics Device Industry Volume Share (%), by Application 2024 & 2032
- Figure 95: South America Microfluidics Device Industry Revenue (Million), by Material 2024 & 2032
- Figure 96: South America Microfluidics Device Industry Volume (K Unit), by Material 2024 & 2032
- Figure 97: South America Microfluidics Device Industry Revenue Share (%), by Material 2024 & 2032
- Figure 98: South America Microfluidics Device Industry Volume Share (%), by Material 2024 & 2032
- Figure 99: South America Microfluidics Device Industry Revenue (Million), by Country 2024 & 2032
- Figure 100: South America Microfluidics Device Industry Volume (K Unit), by Country 2024 & 2032
- Figure 101: South America Microfluidics Device Industry Revenue Share (%), by Country 2024 & 2032
- Figure 102: South America Microfluidics Device Industry Volume Share (%), by Country 2024 & 2032
List of Tables
- Table 1: Global Microfluidics Device Industry Revenue Million Forecast, by Region 2019 & 2032
- Table 2: Global Microfluidics Device Industry Volume K Unit Forecast, by Region 2019 & 2032
- Table 3: Global Microfluidics Device Industry Revenue Million Forecast, by Product Type 2019 & 2032
- Table 4: Global Microfluidics Device Industry Volume K Unit Forecast, by Product Type 2019 & 2032
- Table 5: Global Microfluidics Device Industry Revenue Million Forecast, by Application 2019 & 2032
- Table 6: Global Microfluidics Device Industry Volume K Unit Forecast, by Application 2019 & 2032
- Table 7: Global Microfluidics Device Industry Revenue Million Forecast, by Material 2019 & 2032
- Table 8: Global Microfluidics Device Industry Volume K Unit Forecast, by Material 2019 & 2032
- Table 9: Global Microfluidics Device Industry Revenue Million Forecast, by Region 2019 & 2032
- Table 10: Global Microfluidics Device Industry Volume K Unit Forecast, by Region 2019 & 2032
- Table 11: Global Microfluidics Device Industry Revenue Million Forecast, by Country 2019 & 2032
- Table 12: Global Microfluidics Device Industry Volume K Unit Forecast, by Country 2019 & 2032
- Table 13: United States Microfluidics Device Industry Revenue (Million) Forecast, by Application 2019 & 2032
- Table 14: United States Microfluidics Device Industry Volume (K Unit) Forecast, by Application 2019 & 2032
- Table 15: Canada Microfluidics Device Industry Revenue (Million) Forecast, by Application 2019 & 2032
- Table 16: Canada Microfluidics Device Industry Volume (K Unit) Forecast, by Application 2019 & 2032
- Table 17: Mexico Microfluidics Device Industry Revenue (Million) Forecast, by Application 2019 & 2032
- Table 18: Mexico Microfluidics Device Industry Volume (K Unit) Forecast, by Application 2019 & 2032
- Table 19: Global Microfluidics Device Industry Revenue Million Forecast, by Country 2019 & 2032
- Table 20: Global Microfluidics Device Industry Volume K Unit Forecast, by Country 2019 & 2032
- Table 21: France Microfluidics Device Industry Revenue (Million) Forecast, by Application 2019 & 2032
- Table 22: France Microfluidics Device Industry Volume (K Unit) Forecast, by Application 2019 & 2032
- Table 23: United Kingdom Microfluidics Device Industry Revenue (Million) Forecast, by Application 2019 & 2032
- Table 24: United Kingdom Microfluidics Device Industry Volume (K Unit) Forecast, by Application 2019 & 2032
- Table 25: Germany Microfluidics Device Industry Revenue (Million) Forecast, by Application 2019 & 2032
- Table 26: Germany Microfluidics Device Industry Volume (K Unit) Forecast, by Application 2019 & 2032
- Table 27: Italy Microfluidics Device Industry Revenue (Million) Forecast, by Application 2019 & 2032
- Table 28: Italy Microfluidics Device Industry Volume (K Unit) Forecast, by Application 2019 & 2032
- Table 29: Spain Microfluidics Device Industry Revenue (Million) Forecast, by Application 2019 & 2032
- Table 30: Spain Microfluidics Device Industry Volume (K Unit) Forecast, by Application 2019 & 2032
- Table 31: Rest of Europe Microfluidics Device Industry Revenue (Million) Forecast, by Application 2019 & 2032
- Table 32: Rest of Europe Microfluidics Device Industry Volume (K Unit) Forecast, by Application 2019 & 2032
- Table 33: Global Microfluidics Device Industry Revenue Million Forecast, by Country 2019 & 2032
- Table 34: Global Microfluidics Device Industry Volume K Unit Forecast, by Country 2019 & 2032
- Table 35: China Microfluidics Device Industry Revenue (Million) Forecast, by Application 2019 & 2032
- Table 36: China Microfluidics Device Industry Volume (K Unit) Forecast, by Application 2019 & 2032
- Table 37: Japan Microfluidics Device Industry Revenue (Million) Forecast, by Application 2019 & 2032
- Table 38: Japan Microfluidics Device Industry Volume (K Unit) Forecast, by Application 2019 & 2032
- Table 39: India Microfluidics Device Industry Revenue (Million) Forecast, by Application 2019 & 2032
- Table 40: India Microfluidics Device Industry Volume (K Unit) Forecast, by Application 2019 & 2032
- Table 41: Australia Microfluidics Device Industry Revenue (Million) Forecast, by Application 2019 & 2032
- Table 42: Australia Microfluidics Device Industry Volume (K Unit) Forecast, by Application 2019 & 2032
- Table 43: South Korea Microfluidics Device Industry Revenue (Million) Forecast, by Application 2019 & 2032
- Table 44: South Korea Microfluidics Device Industry Volume (K Unit) Forecast, by Application 2019 & 2032
- Table 45: Rest of Asia Pacific Microfluidics Device Industry Revenue (Million) Forecast, by Application 2019 & 2032
- Table 46: Rest of Asia Pacific Microfluidics Device Industry Volume (K Unit) Forecast, by Application 2019 & 2032
- Table 47: Global Microfluidics Device Industry Revenue Million Forecast, by Country 2019 & 2032
- Table 48: Global Microfluidics Device Industry Volume K Unit Forecast, by Country 2019 & 2032
- Table 49: GCC Microfluidics Device Industry Revenue (Million) Forecast, by Application 2019 & 2032
- Table 50: GCC Microfluidics Device Industry Volume (K Unit) Forecast, by Application 2019 & 2032
- Table 51: South Africa Microfluidics Device Industry Revenue (Million) Forecast, by Application 2019 & 2032
- Table 52: South Africa Microfluidics Device Industry Volume (K Unit) Forecast, by Application 2019 & 2032
- Table 53: Rest of Middle East and Africa Microfluidics Device Industry Revenue (Million) Forecast, by Application 2019 & 2032
- Table 54: Rest of Middle East and Africa Microfluidics Device Industry Volume (K Unit) Forecast, by Application 2019 & 2032
- Table 55: Global Microfluidics Device Industry Revenue Million Forecast, by Country 2019 & 2032
- Table 56: Global Microfluidics Device Industry Volume K Unit Forecast, by Country 2019 & 2032
- Table 57: Brazil Microfluidics Device Industry Revenue (Million) Forecast, by Application 2019 & 2032
- Table 58: Brazil Microfluidics Device Industry Volume (K Unit) Forecast, by Application 2019 & 2032
- Table 59: Argentina Microfluidics Device Industry Revenue (Million) Forecast, by Application 2019 & 2032
- Table 60: Argentina Microfluidics Device Industry Volume (K Unit) Forecast, by Application 2019 & 2032
- Table 61: Rest of South America Microfluidics Device Industry Revenue (Million) Forecast, by Application 2019 & 2032
- Table 62: Rest of South America Microfluidics Device Industry Volume (K Unit) Forecast, by Application 2019 & 2032
- Table 63: Global Microfluidics Device Industry Revenue Million Forecast, by Product Type 2019 & 2032
- Table 64: Global Microfluidics Device Industry Volume K Unit Forecast, by Product Type 2019 & 2032
- Table 65: Global Microfluidics Device Industry Revenue Million Forecast, by Application 2019 & 2032
- Table 66: Global Microfluidics Device Industry Volume K Unit Forecast, by Application 2019 & 2032
- Table 67: Global Microfluidics Device Industry Revenue Million Forecast, by Material 2019 & 2032
- Table 68: Global Microfluidics Device Industry Volume K Unit Forecast, by Material 2019 & 2032
- Table 69: Global Microfluidics Device Industry Revenue Million Forecast, by Country 2019 & 2032
- Table 70: Global Microfluidics Device Industry Volume K Unit Forecast, by Country 2019 & 2032
- Table 71: United States Microfluidics Device Industry Revenue (Million) Forecast, by Application 2019 & 2032
- Table 72: United States Microfluidics Device Industry Volume (K Unit) Forecast, by Application 2019 & 2032
- Table 73: Canada Microfluidics Device Industry Revenue (Million) Forecast, by Application 2019 & 2032
- Table 74: Canada Microfluidics Device Industry Volume (K Unit) Forecast, by Application 2019 & 2032
- Table 75: Mexico Microfluidics Device Industry Revenue (Million) Forecast, by Application 2019 & 2032
- Table 76: Mexico Microfluidics Device Industry Volume (K Unit) Forecast, by Application 2019 & 2032
- Table 77: Global Microfluidics Device Industry Revenue Million Forecast, by Product Type 2019 & 2032
- Table 78: Global Microfluidics Device Industry Volume K Unit Forecast, by Product Type 2019 & 2032
- Table 79: Global Microfluidics Device Industry Revenue Million Forecast, by Application 2019 & 2032
- Table 80: Global Microfluidics Device Industry Volume K Unit Forecast, by Application 2019 & 2032
- Table 81: Global Microfluidics Device Industry Revenue Million Forecast, by Material 2019 & 2032
- Table 82: Global Microfluidics Device Industry Volume K Unit Forecast, by Material 2019 & 2032
- Table 83: Global Microfluidics Device Industry Revenue Million Forecast, by Country 2019 & 2032
- Table 84: Global Microfluidics Device Industry Volume K Unit Forecast, by Country 2019 & 2032
- Table 85: France Microfluidics Device Industry Revenue (Million) Forecast, by Application 2019 & 2032
- Table 86: France Microfluidics Device Industry Volume (K Unit) Forecast, by Application 2019 & 2032
- Table 87: United Kingdom Microfluidics Device Industry Revenue (Million) Forecast, by Application 2019 & 2032
- Table 88: United Kingdom Microfluidics Device Industry Volume (K Unit) Forecast, by Application 2019 & 2032
- Table 89: Germany Microfluidics Device Industry Revenue (Million) Forecast, by Application 2019 & 2032
- Table 90: Germany Microfluidics Device Industry Volume (K Unit) Forecast, by Application 2019 & 2032
- Table 91: Italy Microfluidics Device Industry Revenue (Million) Forecast, by Application 2019 & 2032
- Table 92: Italy Microfluidics Device Industry Volume (K Unit) Forecast, by Application 2019 & 2032
- Table 93: Spain Microfluidics Device Industry Revenue (Million) Forecast, by Application 2019 & 2032
- Table 94: Spain Microfluidics Device Industry Volume (K Unit) Forecast, by Application 2019 & 2032
- Table 95: Rest of Europe Microfluidics Device Industry Revenue (Million) Forecast, by Application 2019 & 2032
- Table 96: Rest of Europe Microfluidics Device Industry Volume (K Unit) Forecast, by Application 2019 & 2032
- Table 97: Global Microfluidics Device Industry Revenue Million Forecast, by Product Type 2019 & 2032
- Table 98: Global Microfluidics Device Industry Volume K Unit Forecast, by Product Type 2019 & 2032
- Table 99: Global Microfluidics Device Industry Revenue Million Forecast, by Application 2019 & 2032
- Table 100: Global Microfluidics Device Industry Volume K Unit Forecast, by Application 2019 & 2032
- Table 101: Global Microfluidics Device Industry Revenue Million Forecast, by Material 2019 & 2032
- Table 102: Global Microfluidics Device Industry Volume K Unit Forecast, by Material 2019 & 2032
- Table 103: Global Microfluidics Device Industry Revenue Million Forecast, by Country 2019 & 2032
- Table 104: Global Microfluidics Device Industry Volume K Unit Forecast, by Country 2019 & 2032
- Table 105: China Microfluidics Device Industry Revenue (Million) Forecast, by Application 2019 & 2032
- Table 106: China Microfluidics Device Industry Volume (K Unit) Forecast, by Application 2019 & 2032
- Table 107: Japan Microfluidics Device Industry Revenue (Million) Forecast, by Application 2019 & 2032
- Table 108: Japan Microfluidics Device Industry Volume (K Unit) Forecast, by Application 2019 & 2032
- Table 109: India Microfluidics Device Industry Revenue (Million) Forecast, by Application 2019 & 2032
- Table 110: India Microfluidics Device Industry Volume (K Unit) Forecast, by Application 2019 & 2032
- Table 111: Australia Microfluidics Device Industry Revenue (Million) Forecast, by Application 2019 & 2032
- Table 112: Australia Microfluidics Device Industry Volume (K Unit) Forecast, by Application 2019 & 2032
- Table 113: South Korea Microfluidics Device Industry Revenue (Million) Forecast, by Application 2019 & 2032
- Table 114: South Korea Microfluidics Device Industry Volume (K Unit) Forecast, by Application 2019 & 2032
- Table 115: Rest of Asia Pacific Microfluidics Device Industry Revenue (Million) Forecast, by Application 2019 & 2032
- Table 116: Rest of Asia Pacific Microfluidics Device Industry Volume (K Unit) Forecast, by Application 2019 & 2032
- Table 117: Global Microfluidics Device Industry Revenue Million Forecast, by Product Type 2019 & 2032
- Table 118: Global Microfluidics Device Industry Volume K Unit Forecast, by Product Type 2019 & 2032
- Table 119: Global Microfluidics Device Industry Revenue Million Forecast, by Application 2019 & 2032
- Table 120: Global Microfluidics Device Industry Volume K Unit Forecast, by Application 2019 & 2032
- Table 121: Global Microfluidics Device Industry Revenue Million Forecast, by Material 2019 & 2032
- Table 122: Global Microfluidics Device Industry Volume K Unit Forecast, by Material 2019 & 2032
- Table 123: Global Microfluidics Device Industry Revenue Million Forecast, by Country 2019 & 2032
- Table 124: Global Microfluidics Device Industry Volume K Unit Forecast, by Country 2019 & 2032
- Table 125: GCC Microfluidics Device Industry Revenue (Million) Forecast, by Application 2019 & 2032
- Table 126: GCC Microfluidics Device Industry Volume (K Unit) Forecast, by Application 2019 & 2032
- Table 127: South Africa Microfluidics Device Industry Revenue (Million) Forecast, by Application 2019 & 2032
- Table 128: South Africa Microfluidics Device Industry Volume (K Unit) Forecast, by Application 2019 & 2032
- Table 129: Rest of Middle East and Africa Microfluidics Device Industry Revenue (Million) Forecast, by Application 2019 & 2032
- Table 130: Rest of Middle East and Africa Microfluidics Device Industry Volume (K Unit) Forecast, by Application 2019 & 2032
- Table 131: Global Microfluidics Device Industry Revenue Million Forecast, by Product Type 2019 & 2032
- Table 132: Global Microfluidics Device Industry Volume K Unit Forecast, by Product Type 2019 & 2032
- Table 133: Global Microfluidics Device Industry Revenue Million Forecast, by Application 2019 & 2032
- Table 134: Global Microfluidics Device Industry Volume K Unit Forecast, by Application 2019 & 2032
- Table 135: Global Microfluidics Device Industry Revenue Million Forecast, by Material 2019 & 2032
- Table 136: Global Microfluidics Device Industry Volume K Unit Forecast, by Material 2019 & 2032
- Table 137: Global Microfluidics Device Industry Revenue Million Forecast, by Country 2019 & 2032
- Table 138: Global Microfluidics Device Industry Volume K Unit Forecast, by Country 2019 & 2032
- Table 139: Brazil Microfluidics Device Industry Revenue (Million) Forecast, by Application 2019 & 2032
- Table 140: Brazil Microfluidics Device Industry Volume (K Unit) Forecast, by Application 2019 & 2032
- Table 141: Argentina Microfluidics Device Industry Revenue (Million) Forecast, by Application 2019 & 2032
- Table 142: Argentina Microfluidics Device Industry Volume (K Unit) Forecast, by Application 2019 & 2032
- Table 143: Rest of South America Microfluidics Device Industry Revenue (Million) Forecast, by Application 2019 & 2032
- Table 144: Rest of South America Microfluidics Device Industry Volume (K Unit) Forecast, by Application 2019 & 2032
Frequently Asked Questions
1. What is the projected Compound Annual Growth Rate (CAGR) of the Microfluidics Device Industry?
The projected CAGR is approximately 14.79%.
2. Which companies are prominent players in the Microfluidics Device Industry?
Key companies in the market include Hesperos Inc, Quidel Corporation, Emulate Inc, Bio-Rad Laboratories Inc, Fluigent SA, ZEON CORPORATION, Dolomite Microfluidics (Blacktrace Holdings Ltd), Micronit Microfluidics, Biosurfit SA, Bartels-Mikrotechnik, Sphere Fluidics Limited, Agilent Technologies Inc, UFluidix, PerkinElmer Inc, Illumina Inc, FluIdigm Corporation, Nanomix Inc.
3. What are the main segments of the Microfluidics Device Industry?
The market segments include Product Type, Application, Material.
4. Can you provide details about the market size?
The market size is estimated to be USD 32.58 Million as of 2022.
5. What are some drivers contributing to market growth?
Increasing Demand for Point-of-care Testing; Increasing Incidences of Various Diseases; Faster Turn-around Time for Analysis and Improved Portability of Devices.
6. What are the notable trends driving market growth?
The Point-of-Care Diagnostics Segment is Expected to Witness Considerable Growth During the Forecast Period.
7. Are there any restraints impacting market growth?
Integration of Microfluidics Technology with Existing Workflows; Low Adoption in Developing Countries Due to High Prices.
8. Can you provide examples of recent developments in the market?
November 2023: Microfluidics, a unit of IDEX Material Processing Technology (MPT), launched Microfluidics’ newest processor, which is designed for production scale cell disruption, which is used in the manufacturing of many biological products such as antigens for vaccines and viral vectors that deliver genes for next-generation gene therapy.
9. What pricing options are available for accessing the report?
Pricing options include single-user, multi-user, and enterprise licenses priced at USD 4750, USD 5250, and USD 8750 respectively.
10. Is the market size provided in terms of value or volume?
The market size is provided in terms of value, measured in Million and volume, measured in K Unit.
11. Are there any specific market keywords associated with the report?
Yes, the market keyword associated with the report is "Microfluidics Device Industry," which aids in identifying and referencing the specific market segment covered.
12. How do I determine which pricing option suits my needs best?
The pricing options vary based on user requirements and access needs. Individual users may opt for single-user licenses, while businesses requiring broader access may choose multi-user or enterprise licenses for cost-effective access to the report.
13. Are there any additional resources or data provided in the Microfluidics Device Industry report?
While the report offers comprehensive insights, it's advisable to review the specific contents or supplementary materials provided to ascertain if additional resources or data are available.
14. How can I stay updated on further developments or reports in the Microfluidics Device Industry?
To stay informed about further developments, trends, and reports in the Microfluidics Device Industry, consider subscribing to industry newsletters, following relevant companies and organizations, or regularly checking reputable industry news sources and publications.
Methodology
Step 1 - Identification of Relevant Samples Size from Population Database


Step 2 - Approaches for Defining Global Market Size (Value, Volume* & Price*)

Note*: In applicable scenarios
Step 3 - Data Sources
Primary Research
- Web Analytics
- Survey Reports
- Research Institute
- Latest Research Reports
- Opinion Leaders
Secondary Research
- Annual Reports
- White Paper
- Latest Press Release
- Industry Association
- Paid Database
- Investor Presentations

Step 4 - Data Triangulation
Involves using different sources of information in order to increase the validity of a study
These sources are likely to be stakeholders in a program - participants, other researchers, program staff, other community members, and so on.
Then we put all data in single framework & apply various statistical tools to find out the dynamic on the market.
During the analysis stage, feedback from the stakeholder groups would be compared to determine areas of agreement as well as areas of divergence
