

Key Insights
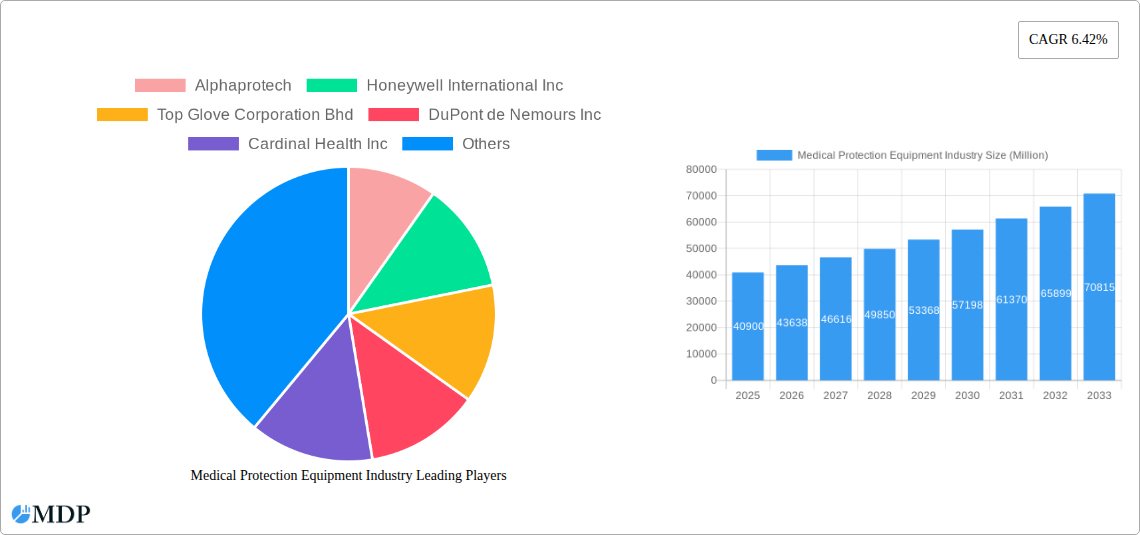
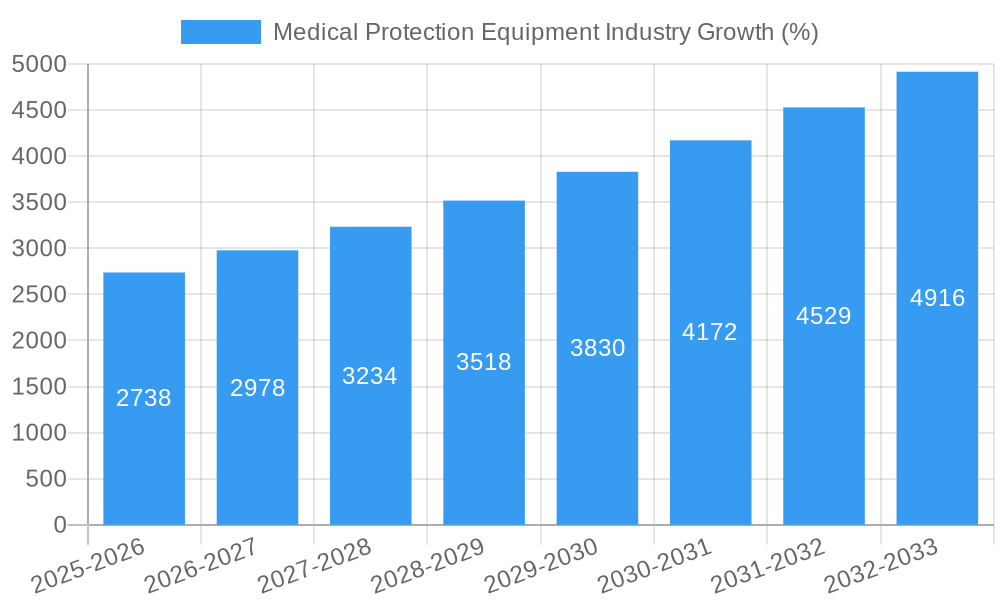
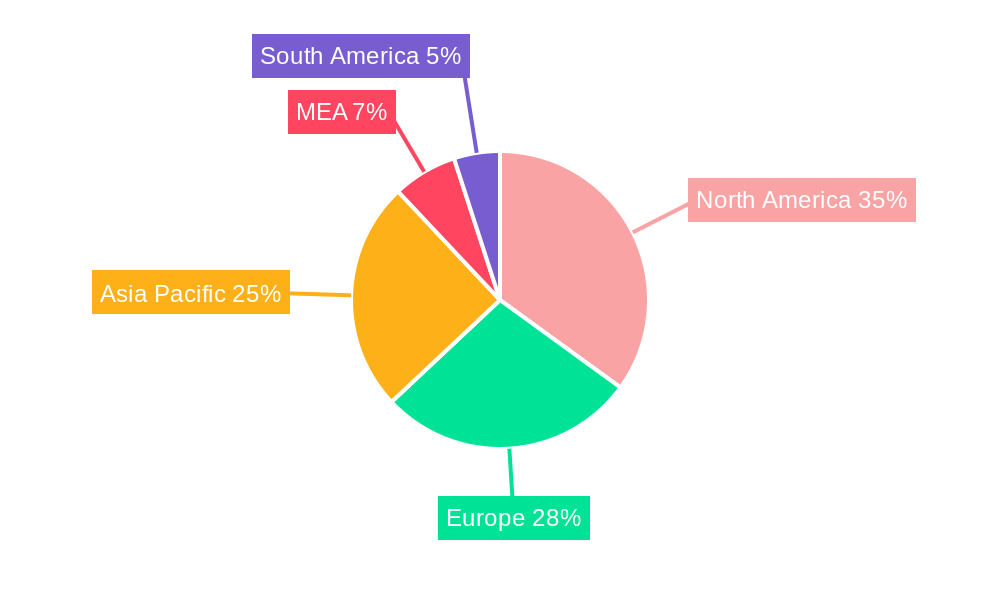
The global medical protection equipment (MPE) market, valued at $40.90 billion in 2025, is projected to experience robust growth, driven by a compound annual growth rate (CAGR) of 6.42% from 2025 to 2033. This expansion is fueled by several key factors. Firstly, the increasing prevalence of infectious diseases, including recurring outbreaks and pandemics, necessitates a heightened demand for protective gear among healthcare professionals and the general public. Secondly, stringent regulatory frameworks and safety standards are driving adoption of higher-quality, more effective MPE. Thirdly, technological advancements are leading to the development of innovative, more comfortable, and efficient protective products like advanced filtration masks and antimicrobial gowns. Finally, rising healthcare expenditure globally contributes to increased investment in medical infrastructure and supplies, further bolstering market growth. The market is segmented by product type (surgical masks, N95 respirators, gloves, gowns, face shields, and other products), usability (disposable and reusable), and end-user (hospitals and clinics, ambulatory surgical centers, diagnostic laboratories, and others). The North American and European regions currently dominate the market share, but the Asia-Pacific region is expected to witness significant growth in the coming years due to factors such as increasing population, rising healthcare expenditure, and expanding healthcare infrastructure. Competition in the market is intense, with major players like 3M, Honeywell, and Cardinal Health leading the way. However, smaller companies focusing on niche technologies or specific product segments also contribute significantly to market dynamism.
The market's growth trajectory is expected to continue its upward trend, although certain challenges exist. These include fluctuating raw material prices, potential supply chain disruptions, and the continuous emergence of new infectious agents requiring adaptation in protective equipment design. Despite these challenges, the long-term outlook for the MPE market remains positive, driven by an increasing awareness of infection control, a global push for enhanced healthcare infrastructure, and the continuous innovation in materials science and manufacturing processes within the sector. Strategic partnerships, mergers and acquisitions, and the adoption of sustainable manufacturing practices will be crucial in shaping the industry's competitive landscape and defining its future growth path. The market is anticipated to witness a considerable increase in demand for advanced products, incorporating superior filtration capabilities and enhanced comfort features.
Medical Protection Equipment Industry Market Report: 2019-2033
This comprehensive report provides a detailed analysis of the Medical Protection Equipment industry, covering market dynamics, leading players, key trends, and future growth opportunities. With a study period spanning 2019-2033, a base year of 2025, and a forecast period of 2025-2033, this report is an invaluable resource for industry stakeholders, investors, and strategic decision-makers. The report analyzes a market valued at xx Million in 2025, projected to reach xx Million by 2033, exhibiting a CAGR of xx%.
Medical Protection Equipment Industry Market Dynamics & Concentration
The Medical Protection Equipment market is characterized by a moderate level of concentration, with several key players holding significant market share. While 3M Company, Honeywell International Inc, and DuPont de Nemours Inc dominate certain segments, the market also features numerous smaller players, particularly in regional markets. Market share fluctuations are influenced by factors like innovation, regulatory changes, and supply chain dynamics. Innovation is a crucial driver, with companies constantly developing new materials and designs to enhance product efficacy and comfort. Stringent regulatory frameworks, particularly concerning safety and efficacy standards, play a significant role in shaping market dynamics. The existence of product substitutes, such as homemade face coverings (though significantly less effective), influences market competition. End-user trends, driven by increasing awareness of infection control, have fueled demand across diverse sectors. Mergers and acquisitions (M&A) activity has been notable, with xx major deals recorded between 2019 and 2024, further shaping market consolidation. For example, the acquisition of Company X by Company Y in [Year] resulted in a combined market share of xx%.
Medical Protection Equipment Industry Industry Trends & Analysis
The Medical Protection Equipment industry has experienced significant growth driven by several factors. The COVID-19 pandemic dramatically increased demand for products like surgical masks and N95 respirators, resulting in a temporary surge in market value. However, even beyond the pandemic's immediate impact, several factors continue to drive growth. Increasing healthcare spending globally, coupled with rising awareness of infection control and prevention, sustains demand for disposable and reusable protective equipment. Technological advancements, such as the development of more comfortable and effective respirators (like Optrel's P.Air Clear), are reshaping the market landscape. Consumer preferences are shifting towards more comfortable and sustainable products, with reusable options gaining traction. Competitive dynamics are fierce, characterized by price competition, innovation races, and branding strategies. The market penetration rate for N95 respirators in healthcare settings is estimated at xx% in 2025, with projected growth to xx% by 2033.
Leading Markets & Segments in Medical Protection Equipment Industry
The North American region currently holds a significant share of the global market, driven by factors like robust healthcare infrastructure, stringent regulatory environments, and high disposable incomes. Within product segments, surgical masks and gloves maintain the largest market share due to their widespread usage across healthcare settings and other industries. Disposable products continue to dominate due to cost-effectiveness and infection control needs. Key drivers for regional dominance include:
- North America: Strong healthcare infrastructure, high disposable income, and stringent regulatory standards.
- Europe: Expanding healthcare systems, focus on infection control, and increasing adoption of advanced protective equipment.
- Asia-Pacific: Rapid economic growth, growing healthcare sector, and rising awareness of hygiene practices.
The largest end-user segment remains hospitals and clinics, owing to their high volume consumption. However, ambulatory surgical centers and diagnostic laboratories are showing strong growth potential.
Medical Protection Equipment Industry Product Developments
Recent product innovations have focused on improving comfort, durability, and functionality. For instance, the introduction of electronic face masks with integrated air filtration systems showcases the integration of technology in this space. Improvements in filter materials, along with the development of reusable alternatives, aim to reduce environmental impact. Companies are also investing in superior designs that enhance breathability and reduce fogging with face shields, improving user experience and compliance. These innovations contribute to a competitive market where product differentiation and superior functionality are key drivers of success.
Key Drivers of Medical Protection Equipment Industry Growth
Several factors are propelling the growth of the Medical Protection Equipment industry. Technological advancements, specifically in filtration technology and material science, are continuously improving product performance and user experience. Rising healthcare expenditure globally, especially in developing economies, fuels increased demand for protective equipment. Stringent regulatory measures and increased awareness of infection control further contribute to market growth. For instance, the increasing adoption of infection prevention protocols in healthcare facilities is pushing demand.
Challenges in the Medical Protection Equipment Industry Market
The Medical Protection Equipment market faces various challenges. Stringent regulatory approvals can hinder product launches and increase time to market. Supply chain disruptions, especially concerning raw materials, can impact production and pricing. Intense competition, coupled with fluctuating raw material prices, puts pressure on profit margins. For example, a xx% increase in raw material costs in [Year] led to a xx% reduction in profit margins for some manufacturers.
Emerging Opportunities in Medical Protection Equipment Industry
Emerging opportunities lie in the development of advanced filtration technologies, sustainable and eco-friendly materials, and smart protective equipment integrated with sensors and data analytics. Strategic partnerships between manufacturers and healthcare providers can foster innovation and expand market reach. Expansion into emerging markets with growing healthcare sectors presents significant potential for growth.
Leading Players in the Medical Protection Equipment Industry Sector
- Alphaprotech
- Honeywell International Inc
- Top Glove Corporation Bhd
- DuPont de Nemours Inc
- Cardinal Health Inc
- 3M Company
- Hartalega Holdings Berhad
- AMD Medicom Inc
- Kimberly-Clark Corporation
- Medline Industries Inc
- Ansell Limited
Key Milestones in Medical Protection Equipment Industry Industry
- August 2021: LG Electronics launched the PuriCare Wearable Air Purifier, highlighting the integration of technology into personal protective equipment. This spurred interest in electronic air purification solutions within the broader PPE market.
- December 2022: Optrel launched the P.Air Clear N95 respirator, demonstrating innovation in improving communication and visibility while maintaining safety standards. This signals a trend towards enhanced user experience in PPE design.
Strategic Outlook for Medical Protection Equipment Industry Market
The Medical Protection Equipment industry is poised for continued growth driven by technological innovations, rising healthcare spending, and increasing awareness of infection prevention. Strategic partnerships, expansion into emerging markets, and a focus on sustainable product development will be crucial for companies to capitalize on future opportunities. The market is expected to witness further consolidation through mergers and acquisitions, leading to a more concentrated landscape. Developing innovative solutions that cater to evolving consumer preferences and address the challenges of supply chain resilience will be key to long-term success.
Medical Protection Equipment Industry Segmentation
-
1. Product
- 1.1. Surgical Masks
- 1.2. N95 Respirators
- 1.3. Gloves
- 1.4. Gowns
- 1.5. Face Shields
- 1.6. Other Products
-
2. Usability
- 2.1. Disposable
- 2.2. Reusable
-
3. End User
- 3.1. Hospitals and Clinics
- 3.2. Ambulatory Surgical Centers
- 3.3. Diagnostic Laboratories
- 3.4. Other End Users
Medical Protection Equipment Industry Segmentation By Geography
-
1. North America
- 1.1. United States
- 1.2. Canada
- 1.3. Mexico
-
2. Europe
- 2.1. Germany
- 2.2. United Kingdom
- 2.3. France
- 2.4. Italy
- 2.5. Spain
- 2.6. Rest of Europe
-
3. Asia Pacific
- 3.1. China
- 3.2. Japan
- 3.3. India
- 3.4. Australia
- 3.5. South Korea
- 3.6. Rest of Asia Pacific
-
4. Middle East and Africa
- 4.1. GCC
- 4.2. South Africa
- 4.3. Rest of Middle East and Africa
-
5. South America
- 5.1. Brazil
- 5.2. Argentina
- 5.3. Rest of South America
Medical Protection Equipment Industry REPORT HIGHLIGHTS
| Aspects | Details |
|---|---|
| Study Period | 2019-2033 |
| Base Year | 2024 |
| Estimated Year | 2025 |
| Forecast Period | 2025-2033 |
| Historical Period | 2019-2024 |
| Growth Rate | CAGR of 6.42% from 2019-2033 |
| Segmentation |
|
Table of Contents
- 1. Introduction
- 1.1. Research Scope
- 1.2. Market Segmentation
- 1.3. Research Methodology
- 1.4. Definitions and Assumptions
- 2. Executive Summary
- 2.1. Introduction
- 3. Market Dynamics
- 3.1. Introduction
- 3.2. Market Drivers
- 3.2.1. Increasing Number of Surgeries; Growing Number of Hospital Visits and Hospital Outbreaks; Rising Awareness for Maintaining Safe Hygiene Practices
- 3.3. Market Restrains
- 3.3.1. Issues Regarding Disposal and Awareness
- 3.4. Market Trends
- 3.4.1. Surgical Masks Segment Shows Lucrative Opportunity in the Medical Protective Equipment Market
- 4. Market Factor Analysis
- 4.1. Porters Five Forces
- 4.2. Supply/Value Chain
- 4.3. PESTEL analysis
- 4.4. Market Entropy
- 4.5. Patent/Trademark Analysis
- 5. Global Medical Protection Equipment Industry Analysis, Insights and Forecast, 2019-2031
- 5.1. Market Analysis, Insights and Forecast - by Product
- 5.1.1. Surgical Masks
- 5.1.2. N95 Respirators
- 5.1.3. Gloves
- 5.1.4. Gowns
- 5.1.5. Face Shields
- 5.1.6. Other Products
- 5.2. Market Analysis, Insights and Forecast - by Usability
- 5.2.1. Disposable
- 5.2.2. Reusable
- 5.3. Market Analysis, Insights and Forecast - by End User
- 5.3.1. Hospitals and Clinics
- 5.3.2. Ambulatory Surgical Centers
- 5.3.3. Diagnostic Laboratories
- 5.3.4. Other End Users
- 5.4. Market Analysis, Insights and Forecast - by Region
- 5.4.1. North America
- 5.4.2. Europe
- 5.4.3. Asia Pacific
- 5.4.4. Middle East and Africa
- 5.4.5. South America
- 5.1. Market Analysis, Insights and Forecast - by Product
- 6. North America Medical Protection Equipment Industry Analysis, Insights and Forecast, 2019-2031
- 6.1. Market Analysis, Insights and Forecast - by Product
- 6.1.1. Surgical Masks
- 6.1.2. N95 Respirators
- 6.1.3. Gloves
- 6.1.4. Gowns
- 6.1.5. Face Shields
- 6.1.6. Other Products
- 6.2. Market Analysis, Insights and Forecast - by Usability
- 6.2.1. Disposable
- 6.2.2. Reusable
- 6.3. Market Analysis, Insights and Forecast - by End User
- 6.3.1. Hospitals and Clinics
- 6.3.2. Ambulatory Surgical Centers
- 6.3.3. Diagnostic Laboratories
- 6.3.4. Other End Users
- 6.1. Market Analysis, Insights and Forecast - by Product
- 7. Europe Medical Protection Equipment Industry Analysis, Insights and Forecast, 2019-2031
- 7.1. Market Analysis, Insights and Forecast - by Product
- 7.1.1. Surgical Masks
- 7.1.2. N95 Respirators
- 7.1.3. Gloves
- 7.1.4. Gowns
- 7.1.5. Face Shields
- 7.1.6. Other Products
- 7.2. Market Analysis, Insights and Forecast - by Usability
- 7.2.1. Disposable
- 7.2.2. Reusable
- 7.3. Market Analysis, Insights and Forecast - by End User
- 7.3.1. Hospitals and Clinics
- 7.3.2. Ambulatory Surgical Centers
- 7.3.3. Diagnostic Laboratories
- 7.3.4. Other End Users
- 7.1. Market Analysis, Insights and Forecast - by Product
- 8. Asia Pacific Medical Protection Equipment Industry Analysis, Insights and Forecast, 2019-2031
- 8.1. Market Analysis, Insights and Forecast - by Product
- 8.1.1. Surgical Masks
- 8.1.2. N95 Respirators
- 8.1.3. Gloves
- 8.1.4. Gowns
- 8.1.5. Face Shields
- 8.1.6. Other Products
- 8.2. Market Analysis, Insights and Forecast - by Usability
- 8.2.1. Disposable
- 8.2.2. Reusable
- 8.3. Market Analysis, Insights and Forecast - by End User
- 8.3.1. Hospitals and Clinics
- 8.3.2. Ambulatory Surgical Centers
- 8.3.3. Diagnostic Laboratories
- 8.3.4. Other End Users
- 8.1. Market Analysis, Insights and Forecast - by Product
- 9. Middle East and Africa Medical Protection Equipment Industry Analysis, Insights and Forecast, 2019-2031
- 9.1. Market Analysis, Insights and Forecast - by Product
- 9.1.1. Surgical Masks
- 9.1.2. N95 Respirators
- 9.1.3. Gloves
- 9.1.4. Gowns
- 9.1.5. Face Shields
- 9.1.6. Other Products
- 9.2. Market Analysis, Insights and Forecast - by Usability
- 9.2.1. Disposable
- 9.2.2. Reusable
- 9.3. Market Analysis, Insights and Forecast - by End User
- 9.3.1. Hospitals and Clinics
- 9.3.2. Ambulatory Surgical Centers
- 9.3.3. Diagnostic Laboratories
- 9.3.4. Other End Users
- 9.1. Market Analysis, Insights and Forecast - by Product
- 10. South America Medical Protection Equipment Industry Analysis, Insights and Forecast, 2019-2031
- 10.1. Market Analysis, Insights and Forecast - by Product
- 10.1.1. Surgical Masks
- 10.1.2. N95 Respirators
- 10.1.3. Gloves
- 10.1.4. Gowns
- 10.1.5. Face Shields
- 10.1.6. Other Products
- 10.2. Market Analysis, Insights and Forecast - by Usability
- 10.2.1. Disposable
- 10.2.2. Reusable
- 10.3. Market Analysis, Insights and Forecast - by End User
- 10.3.1. Hospitals and Clinics
- 10.3.2. Ambulatory Surgical Centers
- 10.3.3. Diagnostic Laboratories
- 10.3.4. Other End Users
- 10.1. Market Analysis, Insights and Forecast - by Product
- 11. North America Medical Protection Equipment Industry Analysis, Insights and Forecast, 2019-2031
- 11.1. Market Analysis, Insights and Forecast - By Country/Sub-region
- 11.1.1 United States
- 11.1.2 Canada
- 11.1.3 Mexico
- 12. South America Medical Protection Equipment Industry Analysis, Insights and Forecast, 2019-2031
- 12.1. Market Analysis, Insights and Forecast - By Country/Sub-region
- 12.1.1 Brazil
- 12.1.2 Mexico
- 12.1.3 Rest of South America
- 13. Europe Medical Protection Equipment Industry Analysis, Insights and Forecast, 2019-2031
- 13.1. Market Analysis, Insights and Forecast - By Country/Sub-region
- 13.1.1 United Kingdom
- 13.1.2 Germany
- 13.1.3 France
- 13.1.4 Italy
- 13.1.5 Spain
- 13.1.6 Russia
- 13.1.7 Rest of Europe
- 14. Asia Pacific Medical Protection Equipment Industry Analysis, Insights and Forecast, 2019-2031
- 14.1. Market Analysis, Insights and Forecast - By Country/Sub-region
- 14.1.1 China
- 14.1.2 Japan
- 14.1.3 India
- 14.1.4 South Korea
- 14.1.5 Taiwan
- 14.1.6 Australia
- 14.1.7 Rest of Asia-Pacific
- 15. MEA Medical Protection Equipment Industry Analysis, Insights and Forecast, 2019-2031
- 15.1. Market Analysis, Insights and Forecast - By Country/Sub-region
- 15.1.1 Middle East
- 15.1.2 Africa
- 16. Competitive Analysis
- 16.1. Global Market Share Analysis 2024
- 16.2. Company Profiles
- 16.2.1 Alphaprotech
- 16.2.1.1. Overview
- 16.2.1.2. Products
- 16.2.1.3. SWOT Analysis
- 16.2.1.4. Recent Developments
- 16.2.1.5. Financials (Based on Availability)
- 16.2.2 Honeywell International Inc
- 16.2.2.1. Overview
- 16.2.2.2. Products
- 16.2.2.3. SWOT Analysis
- 16.2.2.4. Recent Developments
- 16.2.2.5. Financials (Based on Availability)
- 16.2.3 Top Glove Corporation Bhd
- 16.2.3.1. Overview
- 16.2.3.2. Products
- 16.2.3.3. SWOT Analysis
- 16.2.3.4. Recent Developments
- 16.2.3.5. Financials (Based on Availability)
- 16.2.4 DuPont de Nemours Inc
- 16.2.4.1. Overview
- 16.2.4.2. Products
- 16.2.4.3. SWOT Analysis
- 16.2.4.4. Recent Developments
- 16.2.4.5. Financials (Based on Availability)
- 16.2.5 Cardinal Health Inc
- 16.2.5.1. Overview
- 16.2.5.2. Products
- 16.2.5.3. SWOT Analysis
- 16.2.5.4. Recent Developments
- 16.2.5.5. Financials (Based on Availability)
- 16.2.6 3M Company
- 16.2.6.1. Overview
- 16.2.6.2. Products
- 16.2.6.3. SWOT Analysis
- 16.2.6.4. Recent Developments
- 16.2.6.5. Financials (Based on Availability)
- 16.2.7 Hartalega Holdings Berhad
- 16.2.7.1. Overview
- 16.2.7.2. Products
- 16.2.7.3. SWOT Analysis
- 16.2.7.4. Recent Developments
- 16.2.7.5. Financials (Based on Availability)
- 16.2.8 AMD Medicom Inc
- 16.2.8.1. Overview
- 16.2.8.2. Products
- 16.2.8.3. SWOT Analysis
- 16.2.8.4. Recent Developments
- 16.2.8.5. Financials (Based on Availability)
- 16.2.9 Kimberly-Clark Corporation
- 16.2.9.1. Overview
- 16.2.9.2. Products
- 16.2.9.3. SWOT Analysis
- 16.2.9.4. Recent Developments
- 16.2.9.5. Financials (Based on Availability)
- 16.2.10 Medline Industries Inc
- 16.2.10.1. Overview
- 16.2.10.2. Products
- 16.2.10.3. SWOT Analysis
- 16.2.10.4. Recent Developments
- 16.2.10.5. Financials (Based on Availability)
- 16.2.11 Ansell Limited
- 16.2.11.1. Overview
- 16.2.11.2. Products
- 16.2.11.3. SWOT Analysis
- 16.2.11.4. Recent Developments
- 16.2.11.5. Financials (Based on Availability)
- 16.2.1 Alphaprotech
List of Figures
- Figure 1: Global Medical Protection Equipment Industry Revenue Breakdown (Million, %) by Region 2024 & 2032
- Figure 2: Global Medical Protection Equipment Industry Volume Breakdown (K Units, %) by Region 2024 & 2032
- Figure 3: North America Medical Protection Equipment Industry Revenue (Million), by Country 2024 & 2032
- Figure 4: North America Medical Protection Equipment Industry Volume (K Units), by Country 2024 & 2032
- Figure 5: North America Medical Protection Equipment Industry Revenue Share (%), by Country 2024 & 2032
- Figure 6: North America Medical Protection Equipment Industry Volume Share (%), by Country 2024 & 2032
- Figure 7: South America Medical Protection Equipment Industry Revenue (Million), by Country 2024 & 2032
- Figure 8: South America Medical Protection Equipment Industry Volume (K Units), by Country 2024 & 2032
- Figure 9: South America Medical Protection Equipment Industry Revenue Share (%), by Country 2024 & 2032
- Figure 10: South America Medical Protection Equipment Industry Volume Share (%), by Country 2024 & 2032
- Figure 11: Europe Medical Protection Equipment Industry Revenue (Million), by Country 2024 & 2032
- Figure 12: Europe Medical Protection Equipment Industry Volume (K Units), by Country 2024 & 2032
- Figure 13: Europe Medical Protection Equipment Industry Revenue Share (%), by Country 2024 & 2032
- Figure 14: Europe Medical Protection Equipment Industry Volume Share (%), by Country 2024 & 2032
- Figure 15: Asia Pacific Medical Protection Equipment Industry Revenue (Million), by Country 2024 & 2032
- Figure 16: Asia Pacific Medical Protection Equipment Industry Volume (K Units), by Country 2024 & 2032
- Figure 17: Asia Pacific Medical Protection Equipment Industry Revenue Share (%), by Country 2024 & 2032
- Figure 18: Asia Pacific Medical Protection Equipment Industry Volume Share (%), by Country 2024 & 2032
- Figure 19: MEA Medical Protection Equipment Industry Revenue (Million), by Country 2024 & 2032
- Figure 20: MEA Medical Protection Equipment Industry Volume (K Units), by Country 2024 & 2032
- Figure 21: MEA Medical Protection Equipment Industry Revenue Share (%), by Country 2024 & 2032
- Figure 22: MEA Medical Protection Equipment Industry Volume Share (%), by Country 2024 & 2032
- Figure 23: North America Medical Protection Equipment Industry Revenue (Million), by Product 2024 & 2032
- Figure 24: North America Medical Protection Equipment Industry Volume (K Units), by Product 2024 & 2032
- Figure 25: North America Medical Protection Equipment Industry Revenue Share (%), by Product 2024 & 2032
- Figure 26: North America Medical Protection Equipment Industry Volume Share (%), by Product 2024 & 2032
- Figure 27: North America Medical Protection Equipment Industry Revenue (Million), by Usability 2024 & 2032
- Figure 28: North America Medical Protection Equipment Industry Volume (K Units), by Usability 2024 & 2032
- Figure 29: North America Medical Protection Equipment Industry Revenue Share (%), by Usability 2024 & 2032
- Figure 30: North America Medical Protection Equipment Industry Volume Share (%), by Usability 2024 & 2032
- Figure 31: North America Medical Protection Equipment Industry Revenue (Million), by End User 2024 & 2032
- Figure 32: North America Medical Protection Equipment Industry Volume (K Units), by End User 2024 & 2032
- Figure 33: North America Medical Protection Equipment Industry Revenue Share (%), by End User 2024 & 2032
- Figure 34: North America Medical Protection Equipment Industry Volume Share (%), by End User 2024 & 2032
- Figure 35: North America Medical Protection Equipment Industry Revenue (Million), by Country 2024 & 2032
- Figure 36: North America Medical Protection Equipment Industry Volume (K Units), by Country 2024 & 2032
- Figure 37: North America Medical Protection Equipment Industry Revenue Share (%), by Country 2024 & 2032
- Figure 38: North America Medical Protection Equipment Industry Volume Share (%), by Country 2024 & 2032
- Figure 39: Europe Medical Protection Equipment Industry Revenue (Million), by Product 2024 & 2032
- Figure 40: Europe Medical Protection Equipment Industry Volume (K Units), by Product 2024 & 2032
- Figure 41: Europe Medical Protection Equipment Industry Revenue Share (%), by Product 2024 & 2032
- Figure 42: Europe Medical Protection Equipment Industry Volume Share (%), by Product 2024 & 2032
- Figure 43: Europe Medical Protection Equipment Industry Revenue (Million), by Usability 2024 & 2032
- Figure 44: Europe Medical Protection Equipment Industry Volume (K Units), by Usability 2024 & 2032
- Figure 45: Europe Medical Protection Equipment Industry Revenue Share (%), by Usability 2024 & 2032
- Figure 46: Europe Medical Protection Equipment Industry Volume Share (%), by Usability 2024 & 2032
- Figure 47: Europe Medical Protection Equipment Industry Revenue (Million), by End User 2024 & 2032
- Figure 48: Europe Medical Protection Equipment Industry Volume (K Units), by End User 2024 & 2032
- Figure 49: Europe Medical Protection Equipment Industry Revenue Share (%), by End User 2024 & 2032
- Figure 50: Europe Medical Protection Equipment Industry Volume Share (%), by End User 2024 & 2032
- Figure 51: Europe Medical Protection Equipment Industry Revenue (Million), by Country 2024 & 2032
- Figure 52: Europe Medical Protection Equipment Industry Volume (K Units), by Country 2024 & 2032
- Figure 53: Europe Medical Protection Equipment Industry Revenue Share (%), by Country 2024 & 2032
- Figure 54: Europe Medical Protection Equipment Industry Volume Share (%), by Country 2024 & 2032
- Figure 55: Asia Pacific Medical Protection Equipment Industry Revenue (Million), by Product 2024 & 2032
- Figure 56: Asia Pacific Medical Protection Equipment Industry Volume (K Units), by Product 2024 & 2032
- Figure 57: Asia Pacific Medical Protection Equipment Industry Revenue Share (%), by Product 2024 & 2032
- Figure 58: Asia Pacific Medical Protection Equipment Industry Volume Share (%), by Product 2024 & 2032
- Figure 59: Asia Pacific Medical Protection Equipment Industry Revenue (Million), by Usability 2024 & 2032
- Figure 60: Asia Pacific Medical Protection Equipment Industry Volume (K Units), by Usability 2024 & 2032
- Figure 61: Asia Pacific Medical Protection Equipment Industry Revenue Share (%), by Usability 2024 & 2032
- Figure 62: Asia Pacific Medical Protection Equipment Industry Volume Share (%), by Usability 2024 & 2032
- Figure 63: Asia Pacific Medical Protection Equipment Industry Revenue (Million), by End User 2024 & 2032
- Figure 64: Asia Pacific Medical Protection Equipment Industry Volume (K Units), by End User 2024 & 2032
- Figure 65: Asia Pacific Medical Protection Equipment Industry Revenue Share (%), by End User 2024 & 2032
- Figure 66: Asia Pacific Medical Protection Equipment Industry Volume Share (%), by End User 2024 & 2032
- Figure 67: Asia Pacific Medical Protection Equipment Industry Revenue (Million), by Country 2024 & 2032
- Figure 68: Asia Pacific Medical Protection Equipment Industry Volume (K Units), by Country 2024 & 2032
- Figure 69: Asia Pacific Medical Protection Equipment Industry Revenue Share (%), by Country 2024 & 2032
- Figure 70: Asia Pacific Medical Protection Equipment Industry Volume Share (%), by Country 2024 & 2032
- Figure 71: Middle East and Africa Medical Protection Equipment Industry Revenue (Million), by Product 2024 & 2032
- Figure 72: Middle East and Africa Medical Protection Equipment Industry Volume (K Units), by Product 2024 & 2032
- Figure 73: Middle East and Africa Medical Protection Equipment Industry Revenue Share (%), by Product 2024 & 2032
- Figure 74: Middle East and Africa Medical Protection Equipment Industry Volume Share (%), by Product 2024 & 2032
- Figure 75: Middle East and Africa Medical Protection Equipment Industry Revenue (Million), by Usability 2024 & 2032
- Figure 76: Middle East and Africa Medical Protection Equipment Industry Volume (K Units), by Usability 2024 & 2032
- Figure 77: Middle East and Africa Medical Protection Equipment Industry Revenue Share (%), by Usability 2024 & 2032
- Figure 78: Middle East and Africa Medical Protection Equipment Industry Volume Share (%), by Usability 2024 & 2032
- Figure 79: Middle East and Africa Medical Protection Equipment Industry Revenue (Million), by End User 2024 & 2032
- Figure 80: Middle East and Africa Medical Protection Equipment Industry Volume (K Units), by End User 2024 & 2032
- Figure 81: Middle East and Africa Medical Protection Equipment Industry Revenue Share (%), by End User 2024 & 2032
- Figure 82: Middle East and Africa Medical Protection Equipment Industry Volume Share (%), by End User 2024 & 2032
- Figure 83: Middle East and Africa Medical Protection Equipment Industry Revenue (Million), by Country 2024 & 2032
- Figure 84: Middle East and Africa Medical Protection Equipment Industry Volume (K Units), by Country 2024 & 2032
- Figure 85: Middle East and Africa Medical Protection Equipment Industry Revenue Share (%), by Country 2024 & 2032
- Figure 86: Middle East and Africa Medical Protection Equipment Industry Volume Share (%), by Country 2024 & 2032
- Figure 87: South America Medical Protection Equipment Industry Revenue (Million), by Product 2024 & 2032
- Figure 88: South America Medical Protection Equipment Industry Volume (K Units), by Product 2024 & 2032
- Figure 89: South America Medical Protection Equipment Industry Revenue Share (%), by Product 2024 & 2032
- Figure 90: South America Medical Protection Equipment Industry Volume Share (%), by Product 2024 & 2032
- Figure 91: South America Medical Protection Equipment Industry Revenue (Million), by Usability 2024 & 2032
- Figure 92: South America Medical Protection Equipment Industry Volume (K Units), by Usability 2024 & 2032
- Figure 93: South America Medical Protection Equipment Industry Revenue Share (%), by Usability 2024 & 2032
- Figure 94: South America Medical Protection Equipment Industry Volume Share (%), by Usability 2024 & 2032
- Figure 95: South America Medical Protection Equipment Industry Revenue (Million), by End User 2024 & 2032
- Figure 96: South America Medical Protection Equipment Industry Volume (K Units), by End User 2024 & 2032
- Figure 97: South America Medical Protection Equipment Industry Revenue Share (%), by End User 2024 & 2032
- Figure 98: South America Medical Protection Equipment Industry Volume Share (%), by End User 2024 & 2032
- Figure 99: South America Medical Protection Equipment Industry Revenue (Million), by Country 2024 & 2032
- Figure 100: South America Medical Protection Equipment Industry Volume (K Units), by Country 2024 & 2032
- Figure 101: South America Medical Protection Equipment Industry Revenue Share (%), by Country 2024 & 2032
- Figure 102: South America Medical Protection Equipment Industry Volume Share (%), by Country 2024 & 2032
List of Tables
- Table 1: Global Medical Protection Equipment Industry Revenue Million Forecast, by Region 2019 & 2032
- Table 2: Global Medical Protection Equipment Industry Volume K Units Forecast, by Region 2019 & 2032
- Table 3: Global Medical Protection Equipment Industry Revenue Million Forecast, by Product 2019 & 2032
- Table 4: Global Medical Protection Equipment Industry Volume K Units Forecast, by Product 2019 & 2032
- Table 5: Global Medical Protection Equipment Industry Revenue Million Forecast, by Usability 2019 & 2032
- Table 6: Global Medical Protection Equipment Industry Volume K Units Forecast, by Usability 2019 & 2032
- Table 7: Global Medical Protection Equipment Industry Revenue Million Forecast, by End User 2019 & 2032
- Table 8: Global Medical Protection Equipment Industry Volume K Units Forecast, by End User 2019 & 2032
- Table 9: Global Medical Protection Equipment Industry Revenue Million Forecast, by Region 2019 & 2032
- Table 10: Global Medical Protection Equipment Industry Volume K Units Forecast, by Region 2019 & 2032
- Table 11: Global Medical Protection Equipment Industry Revenue Million Forecast, by Country 2019 & 2032
- Table 12: Global Medical Protection Equipment Industry Volume K Units Forecast, by Country 2019 & 2032
- Table 13: United States Medical Protection Equipment Industry Revenue (Million) Forecast, by Application 2019 & 2032
- Table 14: United States Medical Protection Equipment Industry Volume (K Units) Forecast, by Application 2019 & 2032
- Table 15: Canada Medical Protection Equipment Industry Revenue (Million) Forecast, by Application 2019 & 2032
- Table 16: Canada Medical Protection Equipment Industry Volume (K Units) Forecast, by Application 2019 & 2032
- Table 17: Mexico Medical Protection Equipment Industry Revenue (Million) Forecast, by Application 2019 & 2032
- Table 18: Mexico Medical Protection Equipment Industry Volume (K Units) Forecast, by Application 2019 & 2032
- Table 19: Global Medical Protection Equipment Industry Revenue Million Forecast, by Country 2019 & 2032
- Table 20: Global Medical Protection Equipment Industry Volume K Units Forecast, by Country 2019 & 2032
- Table 21: Brazil Medical Protection Equipment Industry Revenue (Million) Forecast, by Application 2019 & 2032
- Table 22: Brazil Medical Protection Equipment Industry Volume (K Units) Forecast, by Application 2019 & 2032
- Table 23: Mexico Medical Protection Equipment Industry Revenue (Million) Forecast, by Application 2019 & 2032
- Table 24: Mexico Medical Protection Equipment Industry Volume (K Units) Forecast, by Application 2019 & 2032
- Table 25: Rest of South America Medical Protection Equipment Industry Revenue (Million) Forecast, by Application 2019 & 2032
- Table 26: Rest of South America Medical Protection Equipment Industry Volume (K Units) Forecast, by Application 2019 & 2032
- Table 27: Global Medical Protection Equipment Industry Revenue Million Forecast, by Country 2019 & 2032
- Table 28: Global Medical Protection Equipment Industry Volume K Units Forecast, by Country 2019 & 2032
- Table 29: United Kingdom Medical Protection Equipment Industry Revenue (Million) Forecast, by Application 2019 & 2032
- Table 30: United Kingdom Medical Protection Equipment Industry Volume (K Units) Forecast, by Application 2019 & 2032
- Table 31: Germany Medical Protection Equipment Industry Revenue (Million) Forecast, by Application 2019 & 2032
- Table 32: Germany Medical Protection Equipment Industry Volume (K Units) Forecast, by Application 2019 & 2032
- Table 33: France Medical Protection Equipment Industry Revenue (Million) Forecast, by Application 2019 & 2032
- Table 34: France Medical Protection Equipment Industry Volume (K Units) Forecast, by Application 2019 & 2032
- Table 35: Italy Medical Protection Equipment Industry Revenue (Million) Forecast, by Application 2019 & 2032
- Table 36: Italy Medical Protection Equipment Industry Volume (K Units) Forecast, by Application 2019 & 2032
- Table 37: Spain Medical Protection Equipment Industry Revenue (Million) Forecast, by Application 2019 & 2032
- Table 38: Spain Medical Protection Equipment Industry Volume (K Units) Forecast, by Application 2019 & 2032
- Table 39: Russia Medical Protection Equipment Industry Revenue (Million) Forecast, by Application 2019 & 2032
- Table 40: Russia Medical Protection Equipment Industry Volume (K Units) Forecast, by Application 2019 & 2032
- Table 41: Rest of Europe Medical Protection Equipment Industry Revenue (Million) Forecast, by Application 2019 & 2032
- Table 42: Rest of Europe Medical Protection Equipment Industry Volume (K Units) Forecast, by Application 2019 & 2032
- Table 43: Global Medical Protection Equipment Industry Revenue Million Forecast, by Country 2019 & 2032
- Table 44: Global Medical Protection Equipment Industry Volume K Units Forecast, by Country 2019 & 2032
- Table 45: China Medical Protection Equipment Industry Revenue (Million) Forecast, by Application 2019 & 2032
- Table 46: China Medical Protection Equipment Industry Volume (K Units) Forecast, by Application 2019 & 2032
- Table 47: Japan Medical Protection Equipment Industry Revenue (Million) Forecast, by Application 2019 & 2032
- Table 48: Japan Medical Protection Equipment Industry Volume (K Units) Forecast, by Application 2019 & 2032
- Table 49: India Medical Protection Equipment Industry Revenue (Million) Forecast, by Application 2019 & 2032
- Table 50: India Medical Protection Equipment Industry Volume (K Units) Forecast, by Application 2019 & 2032
- Table 51: South Korea Medical Protection Equipment Industry Revenue (Million) Forecast, by Application 2019 & 2032
- Table 52: South Korea Medical Protection Equipment Industry Volume (K Units) Forecast, by Application 2019 & 2032
- Table 53: Taiwan Medical Protection Equipment Industry Revenue (Million) Forecast, by Application 2019 & 2032
- Table 54: Taiwan Medical Protection Equipment Industry Volume (K Units) Forecast, by Application 2019 & 2032
- Table 55: Australia Medical Protection Equipment Industry Revenue (Million) Forecast, by Application 2019 & 2032
- Table 56: Australia Medical Protection Equipment Industry Volume (K Units) Forecast, by Application 2019 & 2032
- Table 57: Rest of Asia-Pacific Medical Protection Equipment Industry Revenue (Million) Forecast, by Application 2019 & 2032
- Table 58: Rest of Asia-Pacific Medical Protection Equipment Industry Volume (K Units) Forecast, by Application 2019 & 2032
- Table 59: Global Medical Protection Equipment Industry Revenue Million Forecast, by Country 2019 & 2032
- Table 60: Global Medical Protection Equipment Industry Volume K Units Forecast, by Country 2019 & 2032
- Table 61: Middle East Medical Protection Equipment Industry Revenue (Million) Forecast, by Application 2019 & 2032
- Table 62: Middle East Medical Protection Equipment Industry Volume (K Units) Forecast, by Application 2019 & 2032
- Table 63: Africa Medical Protection Equipment Industry Revenue (Million) Forecast, by Application 2019 & 2032
- Table 64: Africa Medical Protection Equipment Industry Volume (K Units) Forecast, by Application 2019 & 2032
- Table 65: Global Medical Protection Equipment Industry Revenue Million Forecast, by Product 2019 & 2032
- Table 66: Global Medical Protection Equipment Industry Volume K Units Forecast, by Product 2019 & 2032
- Table 67: Global Medical Protection Equipment Industry Revenue Million Forecast, by Usability 2019 & 2032
- Table 68: Global Medical Protection Equipment Industry Volume K Units Forecast, by Usability 2019 & 2032
- Table 69: Global Medical Protection Equipment Industry Revenue Million Forecast, by End User 2019 & 2032
- Table 70: Global Medical Protection Equipment Industry Volume K Units Forecast, by End User 2019 & 2032
- Table 71: Global Medical Protection Equipment Industry Revenue Million Forecast, by Country 2019 & 2032
- Table 72: Global Medical Protection Equipment Industry Volume K Units Forecast, by Country 2019 & 2032
- Table 73: United States Medical Protection Equipment Industry Revenue (Million) Forecast, by Application 2019 & 2032
- Table 74: United States Medical Protection Equipment Industry Volume (K Units) Forecast, by Application 2019 & 2032
- Table 75: Canada Medical Protection Equipment Industry Revenue (Million) Forecast, by Application 2019 & 2032
- Table 76: Canada Medical Protection Equipment Industry Volume (K Units) Forecast, by Application 2019 & 2032
- Table 77: Mexico Medical Protection Equipment Industry Revenue (Million) Forecast, by Application 2019 & 2032
- Table 78: Mexico Medical Protection Equipment Industry Volume (K Units) Forecast, by Application 2019 & 2032
- Table 79: Global Medical Protection Equipment Industry Revenue Million Forecast, by Product 2019 & 2032
- Table 80: Global Medical Protection Equipment Industry Volume K Units Forecast, by Product 2019 & 2032
- Table 81: Global Medical Protection Equipment Industry Revenue Million Forecast, by Usability 2019 & 2032
- Table 82: Global Medical Protection Equipment Industry Volume K Units Forecast, by Usability 2019 & 2032
- Table 83: Global Medical Protection Equipment Industry Revenue Million Forecast, by End User 2019 & 2032
- Table 84: Global Medical Protection Equipment Industry Volume K Units Forecast, by End User 2019 & 2032
- Table 85: Global Medical Protection Equipment Industry Revenue Million Forecast, by Country 2019 & 2032
- Table 86: Global Medical Protection Equipment Industry Volume K Units Forecast, by Country 2019 & 2032
- Table 87: Germany Medical Protection Equipment Industry Revenue (Million) Forecast, by Application 2019 & 2032
- Table 88: Germany Medical Protection Equipment Industry Volume (K Units) Forecast, by Application 2019 & 2032
- Table 89: United Kingdom Medical Protection Equipment Industry Revenue (Million) Forecast, by Application 2019 & 2032
- Table 90: United Kingdom Medical Protection Equipment Industry Volume (K Units) Forecast, by Application 2019 & 2032
- Table 91: France Medical Protection Equipment Industry Revenue (Million) Forecast, by Application 2019 & 2032
- Table 92: France Medical Protection Equipment Industry Volume (K Units) Forecast, by Application 2019 & 2032
- Table 93: Italy Medical Protection Equipment Industry Revenue (Million) Forecast, by Application 2019 & 2032
- Table 94: Italy Medical Protection Equipment Industry Volume (K Units) Forecast, by Application 2019 & 2032
- Table 95: Spain Medical Protection Equipment Industry Revenue (Million) Forecast, by Application 2019 & 2032
- Table 96: Spain Medical Protection Equipment Industry Volume (K Units) Forecast, by Application 2019 & 2032
- Table 97: Rest of Europe Medical Protection Equipment Industry Revenue (Million) Forecast, by Application 2019 & 2032
- Table 98: Rest of Europe Medical Protection Equipment Industry Volume (K Units) Forecast, by Application 2019 & 2032
- Table 99: Global Medical Protection Equipment Industry Revenue Million Forecast, by Product 2019 & 2032
- Table 100: Global Medical Protection Equipment Industry Volume K Units Forecast, by Product 2019 & 2032
- Table 101: Global Medical Protection Equipment Industry Revenue Million Forecast, by Usability 2019 & 2032
- Table 102: Global Medical Protection Equipment Industry Volume K Units Forecast, by Usability 2019 & 2032
- Table 103: Global Medical Protection Equipment Industry Revenue Million Forecast, by End User 2019 & 2032
- Table 104: Global Medical Protection Equipment Industry Volume K Units Forecast, by End User 2019 & 2032
- Table 105: Global Medical Protection Equipment Industry Revenue Million Forecast, by Country 2019 & 2032
- Table 106: Global Medical Protection Equipment Industry Volume K Units Forecast, by Country 2019 & 2032
- Table 107: China Medical Protection Equipment Industry Revenue (Million) Forecast, by Application 2019 & 2032
- Table 108: China Medical Protection Equipment Industry Volume (K Units) Forecast, by Application 2019 & 2032
- Table 109: Japan Medical Protection Equipment Industry Revenue (Million) Forecast, by Application 2019 & 2032
- Table 110: Japan Medical Protection Equipment Industry Volume (K Units) Forecast, by Application 2019 & 2032
- Table 111: India Medical Protection Equipment Industry Revenue (Million) Forecast, by Application 2019 & 2032
- Table 112: India Medical Protection Equipment Industry Volume (K Units) Forecast, by Application 2019 & 2032
- Table 113: Australia Medical Protection Equipment Industry Revenue (Million) Forecast, by Application 2019 & 2032
- Table 114: Australia Medical Protection Equipment Industry Volume (K Units) Forecast, by Application 2019 & 2032
- Table 115: South Korea Medical Protection Equipment Industry Revenue (Million) Forecast, by Application 2019 & 2032
- Table 116: South Korea Medical Protection Equipment Industry Volume (K Units) Forecast, by Application 2019 & 2032
- Table 117: Rest of Asia Pacific Medical Protection Equipment Industry Revenue (Million) Forecast, by Application 2019 & 2032
- Table 118: Rest of Asia Pacific Medical Protection Equipment Industry Volume (K Units) Forecast, by Application 2019 & 2032
- Table 119: Global Medical Protection Equipment Industry Revenue Million Forecast, by Product 2019 & 2032
- Table 120: Global Medical Protection Equipment Industry Volume K Units Forecast, by Product 2019 & 2032
- Table 121: Global Medical Protection Equipment Industry Revenue Million Forecast, by Usability 2019 & 2032
- Table 122: Global Medical Protection Equipment Industry Volume K Units Forecast, by Usability 2019 & 2032
- Table 123: Global Medical Protection Equipment Industry Revenue Million Forecast, by End User 2019 & 2032
- Table 124: Global Medical Protection Equipment Industry Volume K Units Forecast, by End User 2019 & 2032
- Table 125: Global Medical Protection Equipment Industry Revenue Million Forecast, by Country 2019 & 2032
- Table 126: Global Medical Protection Equipment Industry Volume K Units Forecast, by Country 2019 & 2032
- Table 127: GCC Medical Protection Equipment Industry Revenue (Million) Forecast, by Application 2019 & 2032
- Table 128: GCC Medical Protection Equipment Industry Volume (K Units) Forecast, by Application 2019 & 2032
- Table 129: South Africa Medical Protection Equipment Industry Revenue (Million) Forecast, by Application 2019 & 2032
- Table 130: South Africa Medical Protection Equipment Industry Volume (K Units) Forecast, by Application 2019 & 2032
- Table 131: Rest of Middle East and Africa Medical Protection Equipment Industry Revenue (Million) Forecast, by Application 2019 & 2032
- Table 132: Rest of Middle East and Africa Medical Protection Equipment Industry Volume (K Units) Forecast, by Application 2019 & 2032
- Table 133: Global Medical Protection Equipment Industry Revenue Million Forecast, by Product 2019 & 2032
- Table 134: Global Medical Protection Equipment Industry Volume K Units Forecast, by Product 2019 & 2032
- Table 135: Global Medical Protection Equipment Industry Revenue Million Forecast, by Usability 2019 & 2032
- Table 136: Global Medical Protection Equipment Industry Volume K Units Forecast, by Usability 2019 & 2032
- Table 137: Global Medical Protection Equipment Industry Revenue Million Forecast, by End User 2019 & 2032
- Table 138: Global Medical Protection Equipment Industry Volume K Units Forecast, by End User 2019 & 2032
- Table 139: Global Medical Protection Equipment Industry Revenue Million Forecast, by Country 2019 & 2032
- Table 140: Global Medical Protection Equipment Industry Volume K Units Forecast, by Country 2019 & 2032
- Table 141: Brazil Medical Protection Equipment Industry Revenue (Million) Forecast, by Application 2019 & 2032
- Table 142: Brazil Medical Protection Equipment Industry Volume (K Units) Forecast, by Application 2019 & 2032
- Table 143: Argentina Medical Protection Equipment Industry Revenue (Million) Forecast, by Application 2019 & 2032
- Table 144: Argentina Medical Protection Equipment Industry Volume (K Units) Forecast, by Application 2019 & 2032
- Table 145: Rest of South America Medical Protection Equipment Industry Revenue (Million) Forecast, by Application 2019 & 2032
- Table 146: Rest of South America Medical Protection Equipment Industry Volume (K Units) Forecast, by Application 2019 & 2032
Frequently Asked Questions
1. What is the projected Compound Annual Growth Rate (CAGR) of the Medical Protection Equipment Industry?
The projected CAGR is approximately 6.42%.
2. Which companies are prominent players in the Medical Protection Equipment Industry?
Key companies in the market include Alphaprotech, Honeywell International Inc, Top Glove Corporation Bhd, DuPont de Nemours Inc, Cardinal Health Inc, 3M Company, Hartalega Holdings Berhad, AMD Medicom Inc, Kimberly-Clark Corporation, Medline Industries Inc, Ansell Limited.
3. What are the main segments of the Medical Protection Equipment Industry?
The market segments include Product, Usability, End User.
4. Can you provide details about the market size?
The market size is estimated to be USD 40.90 Million as of 2022.
5. What are some drivers contributing to market growth?
Increasing Number of Surgeries; Growing Number of Hospital Visits and Hospital Outbreaks; Rising Awareness for Maintaining Safe Hygiene Practices.
6. What are the notable trends driving market growth?
Surgical Masks Segment Shows Lucrative Opportunity in the Medical Protective Equipment Market.
7. Are there any restraints impacting market growth?
Issues Regarding Disposal and Awareness.
8. Can you provide examples of recent developments in the market?
August 2021: LG Electronics launched an electronic face mask for the people of South Korea. The mask, called the PuriCare Wearable Air Purifier, features two H13 HEPA filters and a respiratory sensor that automatically adjusts the fan speed based on the user's breathing.
9. What pricing options are available for accessing the report?
Pricing options include single-user, multi-user, and enterprise licenses priced at USD 4750, USD 5250, and USD 8750 respectively.
10. Is the market size provided in terms of value or volume?
The market size is provided in terms of value, measured in Million and volume, measured in K Units.
11. Are there any specific market keywords associated with the report?
Yes, the market keyword associated with the report is "Medical Protection Equipment Industry," which aids in identifying and referencing the specific market segment covered.
12. How do I determine which pricing option suits my needs best?
The pricing options vary based on user requirements and access needs. Individual users may opt for single-user licenses, while businesses requiring broader access may choose multi-user or enterprise licenses for cost-effective access to the report.
13. Are there any additional resources or data provided in the Medical Protection Equipment Industry report?
While the report offers comprehensive insights, it's advisable to review the specific contents or supplementary materials provided to ascertain if additional resources or data are available.
14. How can I stay updated on further developments or reports in the Medical Protection Equipment Industry?
To stay informed about further developments, trends, and reports in the Medical Protection Equipment Industry, consider subscribing to industry newsletters, following relevant companies and organizations, or regularly checking reputable industry news sources and publications.
Methodology
Step 1 - Identification of Relevant Samples Size from Population Database


Step 2 - Approaches for Defining Global Market Size (Value, Volume* & Price*)

Note*: In applicable scenarios
Step 3 - Data Sources
Primary Research
- Web Analytics
- Survey Reports
- Research Institute
- Latest Research Reports
- Opinion Leaders
Secondary Research
- Annual Reports
- White Paper
- Latest Press Release
- Industry Association
- Paid Database
- Investor Presentations

Step 4 - Data Triangulation
Involves using different sources of information in order to increase the validity of a study
These sources are likely to be stakeholders in a program - participants, other researchers, program staff, other community members, and so on.
Then we put all data in single framework & apply various statistical tools to find out the dynamic on the market.
During the analysis stage, feedback from the stakeholder groups would be compared to determine areas of agreement as well as areas of divergence
