

Key Insights
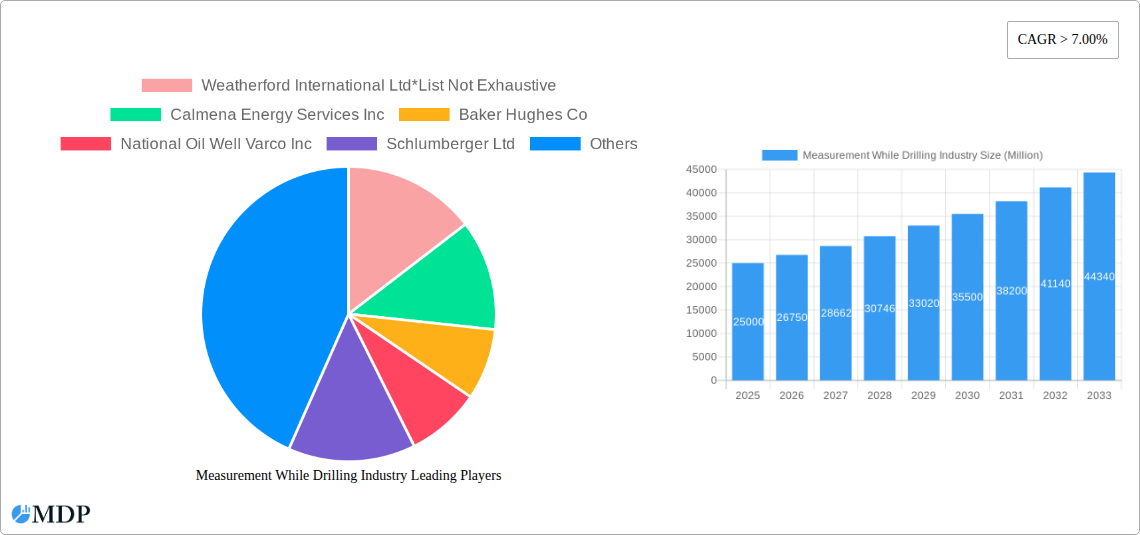
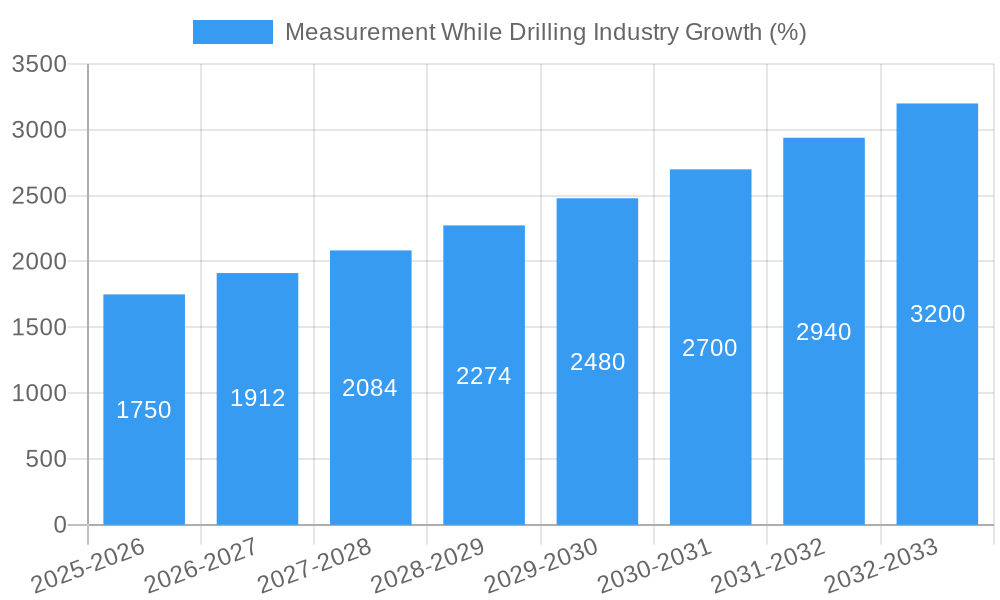
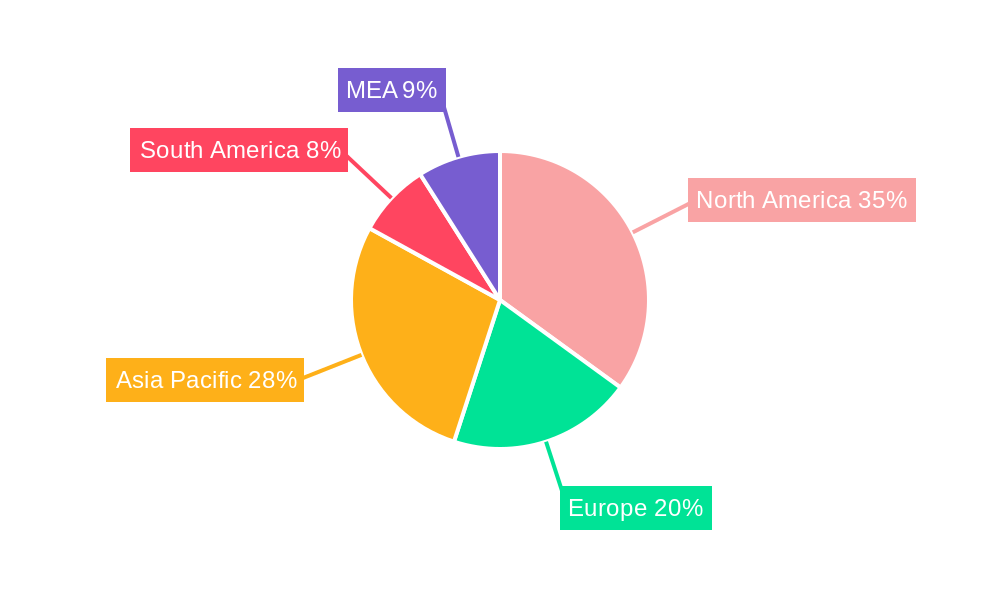
The Measurement While Drilling (MWD) industry is experiencing robust growth, driven by the increasing demand for enhanced oil and gas exploration and production efficiency. A compound annual growth rate (CAGR) exceeding 7% from 2019 to 2033 indicates a significant market expansion. This growth is fueled by several key factors: the need for real-time data acquisition to optimize drilling operations, the rising adoption of advanced drilling technologies in both onshore and offshore environments, and the increasing complexity of drilling projects requiring precise directional control. The onshore segment currently dominates the market due to its higher concentration of drilling activities; however, the offshore segment is projected to experience faster growth rates over the forecast period due to its large scale projects and higher cost of inefficiency. Major players like Weatherford, Baker Hughes, Schlumberger, and Halliburton are shaping market dynamics through technological advancements and strategic partnerships. Geographic expansion is also a prominent trend, with North America and Asia Pacific currently leading in market share. However, the Middle East and Africa regions are projected for significant growth driven by ongoing exploration and production efforts in this resource rich area.
Despite the positive outlook, challenges remain. High initial investment costs for MWD technologies can be a barrier to entry for smaller companies. Furthermore, fluctuating oil and gas prices, along with stringent regulatory compliance requirements, can impact market growth. Despite these challenges, the long-term outlook for the MWD market remains strong, underpinned by the continued need for improved drilling efficiency and reduced operational costs in the global energy sector. Technological innovation, particularly in areas like data analytics and automation, will be critical in driving further expansion and enhancing the overall value proposition of MWD systems in the coming years. Specific growth estimations within regional segments require further detailed information but will reflect the broader growth trend.
Measurement While Drilling (MWD) Industry Market Report: 2019-2033 Forecast
This comprehensive report provides an in-depth analysis of the global Measurement While Drilling (MWD) industry, offering invaluable insights for stakeholders seeking to navigate this dynamic market. Covering the period from 2019 to 2033, with a focus on 2025, this report forecasts significant growth and outlines key trends shaping the future of MWD technology. The report meticulously analyzes market dynamics, leading players, technological advancements, and emerging opportunities, providing actionable intelligence to inform strategic decision-making. The global MWD market size is estimated at $XX Billion in 2025 and projected to reach $XX Billion by 2033, exhibiting a CAGR of XX% during the forecast period (2025-2033).
Measurement While Drilling Industry Market Dynamics & Concentration
The Measurement While Drilling (MWD) market is characterized by a moderately concentrated landscape, with several major players vying for market share. The industry is experiencing significant innovation driven by the increasing demand for improved drilling efficiency and reduced operational costs. Stringent regulatory frameworks regarding safety and environmental impact influence technological advancements and operational practices. Product substitutes, while limited, are emerging from advancements in alternative drilling technologies. End-user preferences are shifting towards integrated MWD systems offering enhanced data acquisition and real-time analysis capabilities. The historical period (2019-2024) witnessed several mergers and acquisitions (M&A) activities, totaling approximately XX deals, aiming to consolidate market share and enhance technological capabilities. Key players like Schlumberger, Halliburton, and Baker Hughes dominate the market, holding a combined market share of approximately XX%. Smaller players are focusing on niche applications and geographical areas.
- Market Concentration: High, with top 5 players holding XX% market share.
- Innovation Drivers: Demand for improved efficiency, reduced costs, and enhanced safety.
- Regulatory Frameworks: Stringent safety and environmental regulations.
- M&A Activity: Approximately XX deals during 2019-2024.
- Key Players' Market Share: Schlumberger (XX%), Halliburton (XX%), Baker Hughes (XX%), and others (XX%).
Measurement While Drilling Industry Industry Trends & Analysis
The MWD industry is experiencing robust growth fueled by several key trends. The increasing demand for oil and gas globally, coupled with the exploration of unconventional reserves, is driving the adoption of advanced MWD technologies. Technological disruptions, including the integration of artificial intelligence (AI) and machine learning (ML) for data analysis, are significantly enhancing operational efficiency. The industry is witnessing a shift in consumer preferences toward integrated MWD systems that provide comprehensive data solutions and reduced operational downtime. Intense competition among major players is driving innovation and cost reduction. The market witnessed a significant expansion in the historical period with a CAGR of XX% and shows strong growth potential, with a projected market penetration rate of XX% by 2033. The rising adoption of automation and digitalization in drilling operations are expected to further propel market growth.
Leading Markets & Segments in Measurement While Drilling Industry
The offshore segment dominates the MWD market, driven by the complexity and higher costs associated with offshore drilling. This segment is projected to account for approximately XX% of the market in 2025. The onshore segment, while smaller, is experiencing steady growth, especially in regions with significant unconventional resource exploration. Key drivers for offshore dominance include:
- Higher Drilling Costs: Justifying investment in advanced MWD technologies.
- Remote Location & Difficult Conditions: MWD is essential for optimal drilling.
- Regulatory Demands: Stricter safety and environmental regulations.
- Technological Advancements: Enabling safe and efficient drilling in challenging conditions.
The Middle East and North America are leading regions in MWD adoption, supported by robust oil and gas exploration activities and significant investments in advanced drilling technologies. The Asia Pacific region is also emerging as a promising market, driven by increasing energy demand and investments in infrastructure development.
Measurement While Drilling Industry Product Developments
Recent product developments focus on enhancing data acquisition, processing, and interpretation capabilities. The integration of advanced sensors, improved data transmission systems, and real-time data analytics capabilities are key features. These innovations enable more precise drilling operations, resulting in reduced drilling time, improved well placement accuracy, and optimized reservoir management. The development of compact, ruggedized MWD tools specifically designed for challenging environments is also a significant trend. This is leading to improved market fit, particularly in harsh offshore environments and complex geological formations.
Key Drivers of Measurement While Drilling Industry Growth
Technological advancements, particularly in data analytics and automation, are key drivers of growth. The increasing demand for oil and gas, coupled with exploration of unconventional resources, fuels the need for efficient drilling technologies like MWD. Favorable government policies and financial incentives for technological upgrades in the energy sector support this growth.
Challenges in the Measurement While Drilling Industry Market
Regulatory hurdles, particularly concerning data security and environmental compliance, pose challenges. Supply chain disruptions, particularly the procurement of specialized components and sensors, can affect operational efficiency. Intense competition among established players puts pressure on pricing and margins. These factors collectively may impact the industry’s overall growth trajectory.
Emerging Opportunities in Measurement While Drilling Industry
Technological breakthroughs, such as the development of AI-powered data analytics platforms, offer significant opportunities. Strategic partnerships among MWD providers, oil companies, and technology firms can leverage synergies and accelerate innovation. Expansion into emerging markets in Asia and Africa presents significant untapped potential. Development of environmentally friendly MWD technologies can address growing concerns regarding emissions and sustainability.
Leading Players in the Measurement While Drilling Industry Sector
- Weatherford International Ltd
- Calmena Energy Services Inc
- Baker Hughes Co
- National Oil Well Varco Inc
- Schlumberger Ltd
- Gyrodata Inc
- China Oilfield Services Limited
- Halliburton Company
- Nabors Industries Limited
- Scientific Drilling International Inc
Key Milestones in Measurement While Drilling Industry Industry
- 2020: Introduction of AI-powered data analytics platform by Schlumberger.
- 2021: Acquisition of XYZ MWD company by Baker Hughes.
- 2022: Launch of a new generation of high-resolution sensors by Halliburton.
- 2023: Successful field testing of a new MWD tool designed for extreme environments.
- 2024: Implementation of new data security protocols by industry leaders.
Strategic Outlook for Measurement While Drilling Industry Market
The MWD market is poised for continued growth, driven by technological advancements, increasing energy demand, and exploration of unconventional resources. Strategic opportunities exist in developing environmentally friendly technologies and expanding into emerging markets. Companies that effectively leverage data analytics, AI, and automation will be well-positioned to capitalize on future growth. The market's future trajectory depends on sustained investment in R&D, strategic partnerships, and adaptation to evolving regulatory environments.
Measurement While Drilling Industry Segmentation
-
1. Location of Deployment
- 1.1. Onshore
- 1.2. Offshore
Measurement While Drilling Industry Segmentation By Geography
- 1. North America
- 2. Europe
- 3. Asia Pacific
- 4. South America
- 5. Middle East
Measurement While Drilling Industry REPORT HIGHLIGHTS
| Aspects | Details |
|---|---|
| Study Period | 2019-2033 |
| Base Year | 2024 |
| Estimated Year | 2025 |
| Forecast Period | 2025-2033 |
| Historical Period | 2019-2024 |
| Growth Rate | CAGR of > 7.00% from 2019-2033 |
| Segmentation |
|
Table of Contents
- 1. Introduction
- 1.1. Research Scope
- 1.2. Market Segmentation
- 1.3. Research Methodology
- 1.4. Definitions and Assumptions
- 2. Executive Summary
- 2.1. Introduction
- 3. Market Dynamics
- 3.1. Introduction
- 3.2. Market Drivers
- 3.2.1. 4.; Presence of Strict Government Regulations to Control Air Pollution
- 3.3. Market Restrains
- 3.3.1. 4.; Increasing Adoption of Renewable Energy
- 3.4. Market Trends
- 3.4.1. Offshore Oil and Gas to Dominate the Market
- 4. Market Factor Analysis
- 4.1. Porters Five Forces
- 4.2. Supply/Value Chain
- 4.3. PESTEL analysis
- 4.4. Market Entropy
- 4.5. Patent/Trademark Analysis
- 5. Global Measurement While Drilling Industry Analysis, Insights and Forecast, 2019-2031
- 5.1. Market Analysis, Insights and Forecast - by Location of Deployment
- 5.1.1. Onshore
- 5.1.2. Offshore
- 5.2. Market Analysis, Insights and Forecast - by Region
- 5.2.1. North America
- 5.2.2. Europe
- 5.2.3. Asia Pacific
- 5.2.4. South America
- 5.2.5. Middle East
- 5.1. Market Analysis, Insights and Forecast - by Location of Deployment
- 6. North America Measurement While Drilling Industry Analysis, Insights and Forecast, 2019-2031
- 6.1. Market Analysis, Insights and Forecast - by Location of Deployment
- 6.1.1. Onshore
- 6.1.2. Offshore
- 6.1. Market Analysis, Insights and Forecast - by Location of Deployment
- 7. Europe Measurement While Drilling Industry Analysis, Insights and Forecast, 2019-2031
- 7.1. Market Analysis, Insights and Forecast - by Location of Deployment
- 7.1.1. Onshore
- 7.1.2. Offshore
- 7.1. Market Analysis, Insights and Forecast - by Location of Deployment
- 8. Asia Pacific Measurement While Drilling Industry Analysis, Insights and Forecast, 2019-2031
- 8.1. Market Analysis, Insights and Forecast - by Location of Deployment
- 8.1.1. Onshore
- 8.1.2. Offshore
- 8.1. Market Analysis, Insights and Forecast - by Location of Deployment
- 9. South America Measurement While Drilling Industry Analysis, Insights and Forecast, 2019-2031
- 9.1. Market Analysis, Insights and Forecast - by Location of Deployment
- 9.1.1. Onshore
- 9.1.2. Offshore
- 9.1. Market Analysis, Insights and Forecast - by Location of Deployment
- 10. Middle East Measurement While Drilling Industry Analysis, Insights and Forecast, 2019-2031
- 10.1. Market Analysis, Insights and Forecast - by Location of Deployment
- 10.1.1. Onshore
- 10.1.2. Offshore
- 10.1. Market Analysis, Insights and Forecast - by Location of Deployment
- 11. North America Measurement While Drilling Industry Analysis, Insights and Forecast, 2019-2031
- 11.1. Market Analysis, Insights and Forecast - By Country/Sub-region
- 11.1.1 United States
- 11.1.2 Canada
- 11.1.3 Mexico
- 12. Europe Measurement While Drilling Industry Analysis, Insights and Forecast, 2019-2031
- 12.1. Market Analysis, Insights and Forecast - By Country/Sub-region
- 12.1.1 Germany
- 12.1.2 United Kingdom
- 12.1.3 France
- 12.1.4 Spain
- 12.1.5 Italy
- 12.1.6 Spain
- 12.1.7 Belgium
- 12.1.8 Netherland
- 12.1.9 Nordics
- 12.1.10 Rest of Europe
- 13. Asia Pacific Measurement While Drilling Industry Analysis, Insights and Forecast, 2019-2031
- 13.1. Market Analysis, Insights and Forecast - By Country/Sub-region
- 13.1.1 China
- 13.1.2 Japan
- 13.1.3 India
- 13.1.4 South Korea
- 13.1.5 Southeast Asia
- 13.1.6 Australia
- 13.1.7 Indonesia
- 13.1.8 Phillipes
- 13.1.9 Singapore
- 13.1.10 Thailandc
- 13.1.11 Rest of Asia Pacific
- 14. South America Measurement While Drilling Industry Analysis, Insights and Forecast, 2019-2031
- 14.1. Market Analysis, Insights and Forecast - By Country/Sub-region
- 14.1.1 Brazil
- 14.1.2 Argentina
- 14.1.3 Peru
- 14.1.4 Chile
- 14.1.5 Colombia
- 14.1.6 Ecuador
- 14.1.7 Venezuela
- 14.1.8 Rest of South America
- 15. North America Measurement While Drilling Industry Analysis, Insights and Forecast, 2019-2031
- 15.1. Market Analysis, Insights and Forecast - By Country/Sub-region
- 15.1.1 United States
- 15.1.2 Canada
- 15.1.3 Mexico
- 16. MEA Measurement While Drilling Industry Analysis, Insights and Forecast, 2019-2031
- 16.1. Market Analysis, Insights and Forecast - By Country/Sub-region
- 16.1.1 United Arab Emirates
- 16.1.2 Saudi Arabia
- 16.1.3 South Africa
- 16.1.4 Rest of Middle East and Africa
- 17. Competitive Analysis
- 17.1. Global Market Share Analysis 2024
- 17.2. Company Profiles
- 17.2.1 Weatherford International Ltd*List Not Exhaustive
- 17.2.1.1. Overview
- 17.2.1.2. Products
- 17.2.1.3. SWOT Analysis
- 17.2.1.4. Recent Developments
- 17.2.1.5. Financials (Based on Availability)
- 17.2.2 Calmena Energy Services Inc
- 17.2.2.1. Overview
- 17.2.2.2. Products
- 17.2.2.3. SWOT Analysis
- 17.2.2.4. Recent Developments
- 17.2.2.5. Financials (Based on Availability)
- 17.2.3 Baker Hughes Co
- 17.2.3.1. Overview
- 17.2.3.2. Products
- 17.2.3.3. SWOT Analysis
- 17.2.3.4. Recent Developments
- 17.2.3.5. Financials (Based on Availability)
- 17.2.4 National Oil Well Varco Inc
- 17.2.4.1. Overview
- 17.2.4.2. Products
- 17.2.4.3. SWOT Analysis
- 17.2.4.4. Recent Developments
- 17.2.4.5. Financials (Based on Availability)
- 17.2.5 Schlumberger Ltd
- 17.2.5.1. Overview
- 17.2.5.2. Products
- 17.2.5.3. SWOT Analysis
- 17.2.5.4. Recent Developments
- 17.2.5.5. Financials (Based on Availability)
- 17.2.6 Gyrodata Inc
- 17.2.6.1. Overview
- 17.2.6.2. Products
- 17.2.6.3. SWOT Analysis
- 17.2.6.4. Recent Developments
- 17.2.6.5. Financials (Based on Availability)
- 17.2.7 China Oilfield Services Limited
- 17.2.7.1. Overview
- 17.2.7.2. Products
- 17.2.7.3. SWOT Analysis
- 17.2.7.4. Recent Developments
- 17.2.7.5. Financials (Based on Availability)
- 17.2.8 Halliburton Company
- 17.2.8.1. Overview
- 17.2.8.2. Products
- 17.2.8.3. SWOT Analysis
- 17.2.8.4. Recent Developments
- 17.2.8.5. Financials (Based on Availability)
- 17.2.9 Nabors Industries Limited
- 17.2.9.1. Overview
- 17.2.9.2. Products
- 17.2.9.3. SWOT Analysis
- 17.2.9.4. Recent Developments
- 17.2.9.5. Financials (Based on Availability)
- 17.2.10 Scientific Drilling International Inc
- 17.2.10.1. Overview
- 17.2.10.2. Products
- 17.2.10.3. SWOT Analysis
- 17.2.10.4. Recent Developments
- 17.2.10.5. Financials (Based on Availability)
- 17.2.1 Weatherford International Ltd*List Not Exhaustive
List of Figures
- Figure 1: Global Measurement While Drilling Industry Revenue Breakdown (Million, %) by Region 2024 & 2032
- Figure 2: North America Measurement While Drilling Industry Revenue (Million), by Country 2024 & 2032
- Figure 3: North America Measurement While Drilling Industry Revenue Share (%), by Country 2024 & 2032
- Figure 4: Europe Measurement While Drilling Industry Revenue (Million), by Country 2024 & 2032
- Figure 5: Europe Measurement While Drilling Industry Revenue Share (%), by Country 2024 & 2032
- Figure 6: Asia Pacific Measurement While Drilling Industry Revenue (Million), by Country 2024 & 2032
- Figure 7: Asia Pacific Measurement While Drilling Industry Revenue Share (%), by Country 2024 & 2032
- Figure 8: South America Measurement While Drilling Industry Revenue (Million), by Country 2024 & 2032
- Figure 9: South America Measurement While Drilling Industry Revenue Share (%), by Country 2024 & 2032
- Figure 10: North America Measurement While Drilling Industry Revenue (Million), by Country 2024 & 2032
- Figure 11: North America Measurement While Drilling Industry Revenue Share (%), by Country 2024 & 2032
- Figure 12: MEA Measurement While Drilling Industry Revenue (Million), by Country 2024 & 2032
- Figure 13: MEA Measurement While Drilling Industry Revenue Share (%), by Country 2024 & 2032
- Figure 14: North America Measurement While Drilling Industry Revenue (Million), by Location of Deployment 2024 & 2032
- Figure 15: North America Measurement While Drilling Industry Revenue Share (%), by Location of Deployment 2024 & 2032
- Figure 16: North America Measurement While Drilling Industry Revenue (Million), by Country 2024 & 2032
- Figure 17: North America Measurement While Drilling Industry Revenue Share (%), by Country 2024 & 2032
- Figure 18: Europe Measurement While Drilling Industry Revenue (Million), by Location of Deployment 2024 & 2032
- Figure 19: Europe Measurement While Drilling Industry Revenue Share (%), by Location of Deployment 2024 & 2032
- Figure 20: Europe Measurement While Drilling Industry Revenue (Million), by Country 2024 & 2032
- Figure 21: Europe Measurement While Drilling Industry Revenue Share (%), by Country 2024 & 2032
- Figure 22: Asia Pacific Measurement While Drilling Industry Revenue (Million), by Location of Deployment 2024 & 2032
- Figure 23: Asia Pacific Measurement While Drilling Industry Revenue Share (%), by Location of Deployment 2024 & 2032
- Figure 24: Asia Pacific Measurement While Drilling Industry Revenue (Million), by Country 2024 & 2032
- Figure 25: Asia Pacific Measurement While Drilling Industry Revenue Share (%), by Country 2024 & 2032
- Figure 26: South America Measurement While Drilling Industry Revenue (Million), by Location of Deployment 2024 & 2032
- Figure 27: South America Measurement While Drilling Industry Revenue Share (%), by Location of Deployment 2024 & 2032
- Figure 28: South America Measurement While Drilling Industry Revenue (Million), by Country 2024 & 2032
- Figure 29: South America Measurement While Drilling Industry Revenue Share (%), by Country 2024 & 2032
- Figure 30: Middle East Measurement While Drilling Industry Revenue (Million), by Location of Deployment 2024 & 2032
- Figure 31: Middle East Measurement While Drilling Industry Revenue Share (%), by Location of Deployment 2024 & 2032
- Figure 32: Middle East Measurement While Drilling Industry Revenue (Million), by Country 2024 & 2032
- Figure 33: Middle East Measurement While Drilling Industry Revenue Share (%), by Country 2024 & 2032
List of Tables
- Table 1: Global Measurement While Drilling Industry Revenue Million Forecast, by Region 2019 & 2032
- Table 2: Global Measurement While Drilling Industry Revenue Million Forecast, by Location of Deployment 2019 & 2032
- Table 3: Global Measurement While Drilling Industry Revenue Million Forecast, by Region 2019 & 2032
- Table 4: Global Measurement While Drilling Industry Revenue Million Forecast, by Country 2019 & 2032
- Table 5: United States Measurement While Drilling Industry Revenue (Million) Forecast, by Application 2019 & 2032
- Table 6: Canada Measurement While Drilling Industry Revenue (Million) Forecast, by Application 2019 & 2032
- Table 7: Mexico Measurement While Drilling Industry Revenue (Million) Forecast, by Application 2019 & 2032
- Table 8: Global Measurement While Drilling Industry Revenue Million Forecast, by Country 2019 & 2032
- Table 9: Germany Measurement While Drilling Industry Revenue (Million) Forecast, by Application 2019 & 2032
- Table 10: United Kingdom Measurement While Drilling Industry Revenue (Million) Forecast, by Application 2019 & 2032
- Table 11: France Measurement While Drilling Industry Revenue (Million) Forecast, by Application 2019 & 2032
- Table 12: Spain Measurement While Drilling Industry Revenue (Million) Forecast, by Application 2019 & 2032
- Table 13: Italy Measurement While Drilling Industry Revenue (Million) Forecast, by Application 2019 & 2032
- Table 14: Spain Measurement While Drilling Industry Revenue (Million) Forecast, by Application 2019 & 2032
- Table 15: Belgium Measurement While Drilling Industry Revenue (Million) Forecast, by Application 2019 & 2032
- Table 16: Netherland Measurement While Drilling Industry Revenue (Million) Forecast, by Application 2019 & 2032
- Table 17: Nordics Measurement While Drilling Industry Revenue (Million) Forecast, by Application 2019 & 2032
- Table 18: Rest of Europe Measurement While Drilling Industry Revenue (Million) Forecast, by Application 2019 & 2032
- Table 19: Global Measurement While Drilling Industry Revenue Million Forecast, by Country 2019 & 2032
- Table 20: China Measurement While Drilling Industry Revenue (Million) Forecast, by Application 2019 & 2032
- Table 21: Japan Measurement While Drilling Industry Revenue (Million) Forecast, by Application 2019 & 2032
- Table 22: India Measurement While Drilling Industry Revenue (Million) Forecast, by Application 2019 & 2032
- Table 23: South Korea Measurement While Drilling Industry Revenue (Million) Forecast, by Application 2019 & 2032
- Table 24: Southeast Asia Measurement While Drilling Industry Revenue (Million) Forecast, by Application 2019 & 2032
- Table 25: Australia Measurement While Drilling Industry Revenue (Million) Forecast, by Application 2019 & 2032
- Table 26: Indonesia Measurement While Drilling Industry Revenue (Million) Forecast, by Application 2019 & 2032
- Table 27: Phillipes Measurement While Drilling Industry Revenue (Million) Forecast, by Application 2019 & 2032
- Table 28: Singapore Measurement While Drilling Industry Revenue (Million) Forecast, by Application 2019 & 2032
- Table 29: Thailandc Measurement While Drilling Industry Revenue (Million) Forecast, by Application 2019 & 2032
- Table 30: Rest of Asia Pacific Measurement While Drilling Industry Revenue (Million) Forecast, by Application 2019 & 2032
- Table 31: Global Measurement While Drilling Industry Revenue Million Forecast, by Country 2019 & 2032
- Table 32: Brazil Measurement While Drilling Industry Revenue (Million) Forecast, by Application 2019 & 2032
- Table 33: Argentina Measurement While Drilling Industry Revenue (Million) Forecast, by Application 2019 & 2032
- Table 34: Peru Measurement While Drilling Industry Revenue (Million) Forecast, by Application 2019 & 2032
- Table 35: Chile Measurement While Drilling Industry Revenue (Million) Forecast, by Application 2019 & 2032
- Table 36: Colombia Measurement While Drilling Industry Revenue (Million) Forecast, by Application 2019 & 2032
- Table 37: Ecuador Measurement While Drilling Industry Revenue (Million) Forecast, by Application 2019 & 2032
- Table 38: Venezuela Measurement While Drilling Industry Revenue (Million) Forecast, by Application 2019 & 2032
- Table 39: Rest of South America Measurement While Drilling Industry Revenue (Million) Forecast, by Application 2019 & 2032
- Table 40: Global Measurement While Drilling Industry Revenue Million Forecast, by Country 2019 & 2032
- Table 41: United States Measurement While Drilling Industry Revenue (Million) Forecast, by Application 2019 & 2032
- Table 42: Canada Measurement While Drilling Industry Revenue (Million) Forecast, by Application 2019 & 2032
- Table 43: Mexico Measurement While Drilling Industry Revenue (Million) Forecast, by Application 2019 & 2032
- Table 44: Global Measurement While Drilling Industry Revenue Million Forecast, by Country 2019 & 2032
- Table 45: United Arab Emirates Measurement While Drilling Industry Revenue (Million) Forecast, by Application 2019 & 2032
- Table 46: Saudi Arabia Measurement While Drilling Industry Revenue (Million) Forecast, by Application 2019 & 2032
- Table 47: South Africa Measurement While Drilling Industry Revenue (Million) Forecast, by Application 2019 & 2032
- Table 48: Rest of Middle East and Africa Measurement While Drilling Industry Revenue (Million) Forecast, by Application 2019 & 2032
- Table 49: Global Measurement While Drilling Industry Revenue Million Forecast, by Location of Deployment 2019 & 2032
- Table 50: Global Measurement While Drilling Industry Revenue Million Forecast, by Country 2019 & 2032
- Table 51: Global Measurement While Drilling Industry Revenue Million Forecast, by Location of Deployment 2019 & 2032
- Table 52: Global Measurement While Drilling Industry Revenue Million Forecast, by Country 2019 & 2032
- Table 53: Global Measurement While Drilling Industry Revenue Million Forecast, by Location of Deployment 2019 & 2032
- Table 54: Global Measurement While Drilling Industry Revenue Million Forecast, by Country 2019 & 2032
- Table 55: Global Measurement While Drilling Industry Revenue Million Forecast, by Location of Deployment 2019 & 2032
- Table 56: Global Measurement While Drilling Industry Revenue Million Forecast, by Country 2019 & 2032
- Table 57: Global Measurement While Drilling Industry Revenue Million Forecast, by Location of Deployment 2019 & 2032
- Table 58: Global Measurement While Drilling Industry Revenue Million Forecast, by Country 2019 & 2032
Frequently Asked Questions
1. What is the projected Compound Annual Growth Rate (CAGR) of the Measurement While Drilling Industry?
The projected CAGR is approximately > 7.00%.
2. Which companies are prominent players in the Measurement While Drilling Industry?
Key companies in the market include Weatherford International Ltd*List Not Exhaustive, Calmena Energy Services Inc, Baker Hughes Co, National Oil Well Varco Inc, Schlumberger Ltd, Gyrodata Inc, China Oilfield Services Limited, Halliburton Company, Nabors Industries Limited, Scientific Drilling International Inc.
3. What are the main segments of the Measurement While Drilling Industry?
The market segments include Location of Deployment.
4. Can you provide details about the market size?
The market size is estimated to be USD XX Million as of 2022.
5. What are some drivers contributing to market growth?
4.; Presence of Strict Government Regulations to Control Air Pollution.
6. What are the notable trends driving market growth?
Offshore Oil and Gas to Dominate the Market.
7. Are there any restraints impacting market growth?
4.; Increasing Adoption of Renewable Energy.
8. Can you provide examples of recent developments in the market?
N/A
9. What pricing options are available for accessing the report?
Pricing options include single-user, multi-user, and enterprise licenses priced at USD 4750, USD 5250, and USD 8750 respectively.
10. Is the market size provided in terms of value or volume?
The market size is provided in terms of value, measured in Million.
11. Are there any specific market keywords associated with the report?
Yes, the market keyword associated with the report is "Measurement While Drilling Industry," which aids in identifying and referencing the specific market segment covered.
12. How do I determine which pricing option suits my needs best?
The pricing options vary based on user requirements and access needs. Individual users may opt for single-user licenses, while businesses requiring broader access may choose multi-user or enterprise licenses for cost-effective access to the report.
13. Are there any additional resources or data provided in the Measurement While Drilling Industry report?
While the report offers comprehensive insights, it's advisable to review the specific contents or supplementary materials provided to ascertain if additional resources or data are available.
14. How can I stay updated on further developments or reports in the Measurement While Drilling Industry?
To stay informed about further developments, trends, and reports in the Measurement While Drilling Industry, consider subscribing to industry newsletters, following relevant companies and organizations, or regularly checking reputable industry news sources and publications.
Methodology
Step 1 - Identification of Relevant Samples Size from Population Database


Step 2 - Approaches for Defining Global Market Size (Value, Volume* & Price*)

Note*: In applicable scenarios
Step 3 - Data Sources
Primary Research
- Web Analytics
- Survey Reports
- Research Institute
- Latest Research Reports
- Opinion Leaders
Secondary Research
- Annual Reports
- White Paper
- Latest Press Release
- Industry Association
- Paid Database
- Investor Presentations

Step 4 - Data Triangulation
Involves using different sources of information in order to increase the validity of a study
These sources are likely to be stakeholders in a program - participants, other researchers, program staff, other community members, and so on.
Then we put all data in single framework & apply various statistical tools to find out the dynamic on the market.
During the analysis stage, feedback from the stakeholder groups would be compared to determine areas of agreement as well as areas of divergence
