

Key Insights
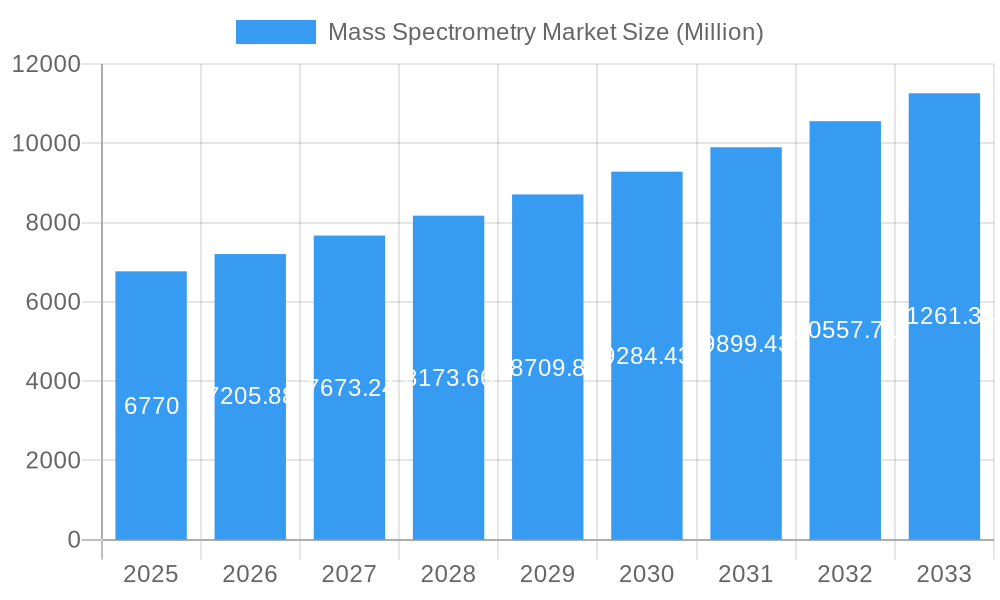
The global mass spectrometry market, currently valued at $6.77 billion in 2025, is poised for substantial growth, projected to expand at a compound annual growth rate (CAGR) of 6.25% from 2025 to 2033. This robust growth is driven by several key factors. The increasing prevalence of chronic diseases globally necessitates advanced diagnostic tools, fueling demand for mass spectrometry in pharmaceutical and biotechnology research and development. Furthermore, the growing need for precise and rapid analysis in environmental monitoring and food safety testing contributes significantly to market expansion. Technological advancements, such as the development of more sensitive and efficient hybrid mass spectrometry techniques and miniaturization for point-of-care diagnostics, are further propelling market growth. The rising adoption of FTMS (Fourier Transform Mass Spectrometry) and Time-of-Flight (TOF) technologies, especially inductively coupled plasma mass spectrometry (ICP-MS), across various industries is another significant driver.
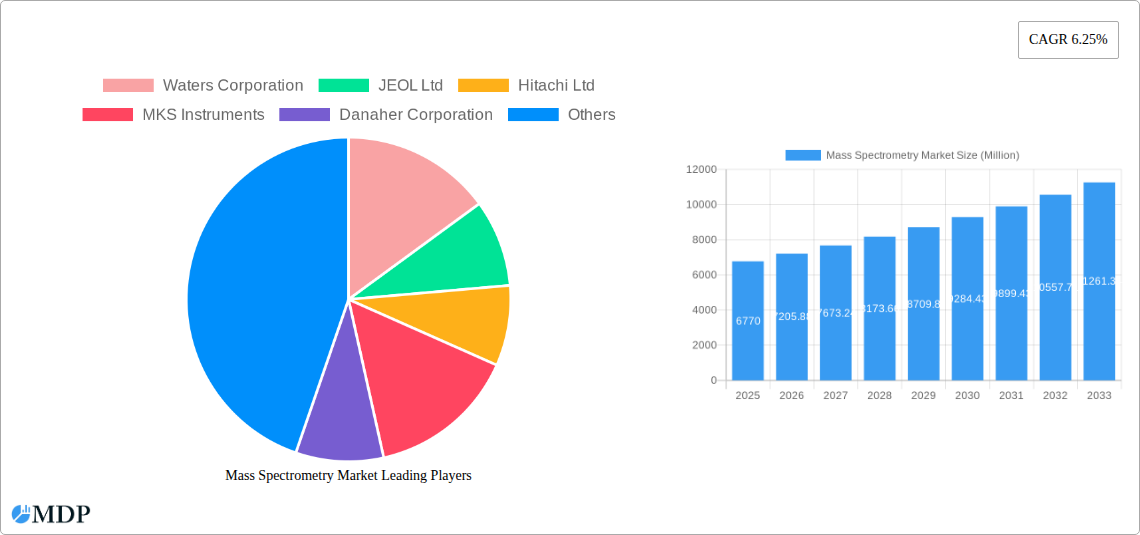
Mass Spectrometry Market Market Size (In Billion)
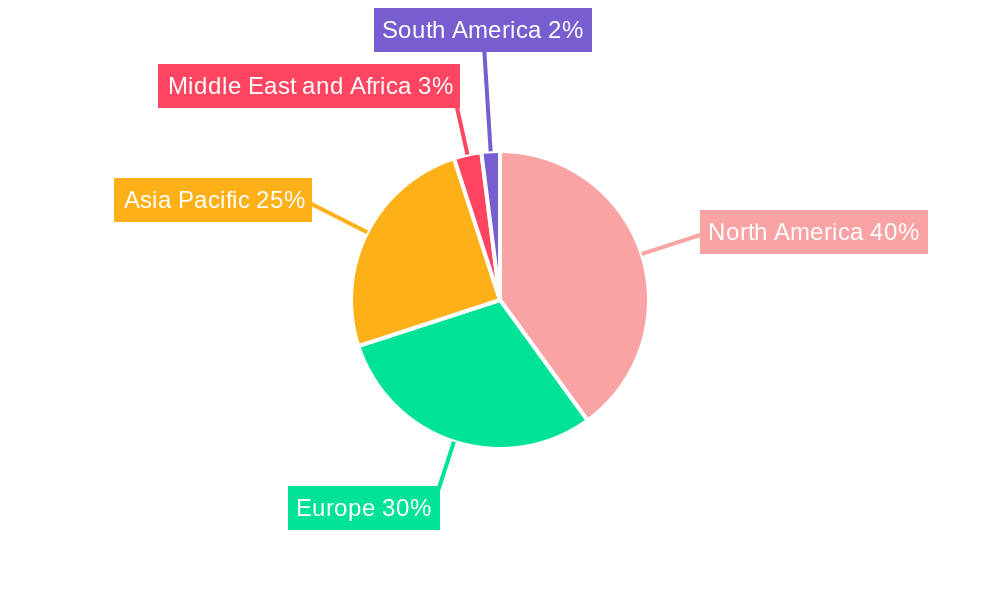
The market segmentation reveals pharmaceuticals and biotechnology as the dominant application areas, reflecting the crucial role of mass spectrometry in drug discovery, development, and quality control. However, the chemical and other application segments are also experiencing considerable growth, driven by increasing regulatory scrutiny and the need for precise chemical analysis across various sectors. Geographically, North America currently holds a significant market share, attributed to strong R&D investment and the presence of major players. However, rapidly developing economies in Asia-Pacific, particularly China and India, are expected to witness significant market expansion in the coming years, owing to increasing healthcare spending and infrastructure development. While factors such as high initial investment costs and the complexity of instrumentation could pose challenges, the overall market outlook remains positive, driven by the continuous technological advancements and increasing demand for precise analytical solutions across various industries.
Mass Spectrometry Market Company Market Share
Mass Spectrometry Market: A Comprehensive Report (2019-2033)
This in-depth report provides a comprehensive analysis of the Mass Spectrometry Market, covering market dynamics, industry trends, leading segments, key players, and future outlook. The study period spans from 2019 to 2033, with 2025 as the base and estimated year. The report offers invaluable insights for stakeholders, including manufacturers, researchers, investors, and regulatory bodies, seeking to understand and navigate this dynamic market. Projected market values are in Millions.
Mass Spectrometry Market Market Dynamics & Concentration
The global Mass Spectrometry market exhibits a moderately consolidated landscape, with key players holding significant market share. Market concentration is influenced by factors such as technological advancements, regulatory compliance, and strategic mergers and acquisitions (M&A). The historical period (2019-2024) witnessed a steady increase in M&A activity, driven by a desire to expand product portfolios and gain access to new technologies. An estimated xx Million deals were recorded during this period. Innovation is a crucial driver, with companies continually developing advanced mass spectrometry technologies, like hybrid systems and improved software for data analysis, to cater to evolving industry needs. Stringent regulatory frameworks in sectors like pharmaceuticals and food safety significantly impact market dynamics. Furthermore, the presence of substitute technologies, although limited, influences market competition. End-user trends, particularly the increasing demand for high-throughput screening in drug discovery and proteomics research, fuel market growth.
- Market Share: Top 5 players account for approximately xx% of the global market.
- M&A Activity: An estimated xx M&A deals were completed between 2019 and 2024.
- Innovation Drivers: Development of hybrid mass spectrometry, improved software for data analysis, and miniaturization of instruments.
- Regulatory Frameworks: Stringent regulations related to data integrity and instrument calibration in the pharmaceutical industry.
- Product Substitutes: Limited, but techniques like chromatography sometimes offer alternative solutions.
- End-User Trends: Growing demand for high-throughput screening and advanced proteomics analysis.
Mass Spectrometry Market Industry Trends & Analysis
The Mass Spectrometry market is experiencing robust growth, driven primarily by advancements in technology, increasing demand across various application sectors, and favorable economic conditions in key regions. The market's Compound Annual Growth Rate (CAGR) during the historical period (2019-2024) was estimated at xx%, and is projected to reach xx% during the forecast period (2025-2033). Technological disruptions, particularly in areas like miniaturization, increased sensitivity, and improved data processing capabilities, are reshaping the market. Consumer preferences are shifting towards user-friendly instruments and comprehensive software solutions, which facilitates data analysis and interpretation. Competitive dynamics are intense, with established players engaging in strategic partnerships, product launches, and acquisitions to expand their market presence. Market penetration in emerging economies is steadily increasing, driven by rising healthcare spending and the adoption of advanced analytical techniques in various industries.
Leading Markets & Segments in Mass Spectrometry Market
The North American region currently dominates the Mass Spectrometry market, driven by robust funding for research and development in the life sciences, pharmaceuticals, and chemical industries. Within the technology segments, Hybrid Mass Spectrometry holds the largest market share, due to its versatility and high performance capabilities. In applications, the Pharmaceuticals Industry is a major driver, followed closely by the Biotechnology Industry.
- Dominant Region: North America
- Dominant Technology Segment: Hybrid Mass Spectrometry
- Dominant Application Segment: Pharmaceuticals Industry
Key Drivers:
- North America: Strong R&D funding, well-established pharmaceutical and biotechnology sectors.
- Europe: Growing healthcare expenditure, increasing focus on personalized medicine.
- Asia-Pacific: Rapid economic growth, increasing adoption of advanced analytical techniques in emerging economies.
- Hybrid Mass Spectrometry: Versatility, high sensitivity, and capability to analyze a wider range of analytes.
- Pharmaceuticals Industry: High demand for advanced analytical techniques in drug discovery, development, and quality control.
Mass Spectrometry Market Product Developments
Recent product innovations showcase a strong trend towards miniaturization, increased sensitivity, and improved ease of use. Companies are focusing on developing compact, cost-effective instruments with advanced software capabilities. For example, the launch of Shimadzu's LCMS-2050 and Waters' Xevo TQ Absolute demonstrate a focus on high-speed, high-sensitivity analysis in smaller and more energy-efficient systems, meeting the increasing demands of diverse research and industrial applications. These developments offer improved analytical capabilities while addressing cost and space constraints, enhancing their market appeal.
Key Drivers of Mass Spectrometry Market Growth
Several factors drive the growth of the Mass Spectrometry market. Technological advancements, like the development of high-resolution mass spectrometers and improved software capabilities, enhance analytical power and efficiency. Increased government funding for research and development in life sciences and environmental monitoring boosts demand. Furthermore, rising healthcare expenditure and the growing need for advanced analytical techniques in various industries, such as pharmaceuticals and food safety, fuel market expansion.
Challenges in the Mass Spectrometry Market Market
The Mass Spectrometry market faces several challenges. High initial investment costs for advanced instruments can be a barrier for smaller research groups and companies. Complex data analysis procedures and the need for skilled personnel can restrict widespread adoption. Regulatory compliance requirements in specific industries, coupled with the competitive landscape and potential supply chain disruptions, also pose significant challenges. These factors collectively impact market penetration and overall growth. The estimated impact on market growth is xx%.
Emerging Opportunities in Mass Spectrometry Market
Emerging opportunities arise from technological advancements in areas such as miniaturization, improved sensitivity, and hyphenated techniques (e.g., LC-MS). Strategic partnerships between instrument manufacturers and software developers can unlock new market segments. Furthermore, expansion into emerging economies and applications in new fields, such as environmental monitoring and food safety, offer significant growth potential.
Leading Players in the Mass Spectrometry Market Sector
Key Milestones in Mass Spectrometry Market Industry
- June 2022: Shimadzu Scientific Instruments launched the LCMS-2050, a smaller, faster, and more sensitive liquid chromatography quadrupole mass spectrometer. This launch enhanced Shimadzu's competitive position by offering a more compact and efficient instrument.
- March 2022: Waters Corporation launched the Xevo TQ Absolute, a highly sensitive and compact tandem mass spectrometer. This launch significantly improved sensitivity and reduced the size and energy consumption of the instrument, strengthening Waters' market position.
Strategic Outlook for Mass Spectrometry Market Market
The Mass Spectrometry market is poised for continued growth, driven by technological innovations, increasing demand across various applications, and expansion into new markets. Strategic partnerships, product diversification, and investments in R&D will be crucial for companies seeking to gain a competitive edge. The market's future potential is substantial, particularly in emerging economies and applications requiring high sensitivity and throughput.
Mass Spectrometry Market Segmentation
-
1. Technology
-
1.1. Hybrid Mass Spectrometry
- 1.1.1. Triple Quadrupole (Tandem)
- 1.1.2. Quadrupole TOF (Q-TOF)
- 1.1.3. FTMS (Fourier Transform Mass Spectrometry)
-
1.2. Single Mass Spectrometry
- 1.2.1. ION Trap
- 1.2.2. Time-of-Flight (TOF)
- 1.3. Inductiv
-
1.1. Hybrid Mass Spectrometry
-
2. Application
- 2.1. Pharmaceuticals Industry
- 2.2. Biotechnology Industry
- 2.3. Chemical Industry
- 2.4. Other Application
Mass Spectrometry Market Segmentation By Geography
-
1. North America
- 1.1. United States
- 1.2. Canada
- 1.3. Mexico
-
2. Europe
- 2.1. Germany
- 2.2. United Kingdom
- 2.3. France
- 2.4. Italy
- 2.5. Spain
- 2.6. Rest of Europe
-
3. Asia Pacific
- 3.1. China
- 3.2. Japan
- 3.3. India
- 3.4. Australia
- 3.5. South Korea
- 3.6. Rest of Asia Pacific
-
4. Middle East and Africa
- 4.1. GCC
- 4.2. South Africa
- 4.3. Rest of Middle East and Africa
-
5. South America
- 5.1. Brazil
- 5.2. Argentina
- 5.3. Rest of South America
Mass Spectrometry Market Regional Market Share
Geographic Coverage of Mass Spectrometry Market
Mass Spectrometry Market REPORT HIGHLIGHTS
| Aspects | Details |
|---|---|
| Study Period | 2020-2034 |
| Base Year | 2025 |
| Estimated Year | 2026 |
| Forecast Period | 2026-2034 |
| Historical Period | 2020-2025 |
| Growth Rate | CAGR of 6.25% from 2020-2034 |
| Segmentation |
|
Table of Contents
- 1. Introduction
- 1.1. Research Scope
- 1.2. Market Segmentation
- 1.3. Research Objective
- 1.4. Definitions and Assumptions
- 2. Executive Summary
- 2.1. Market Snapshot
- 3. Market Dynamics
- 3.1. Market Drivers
- 3.2. Market Restrains
- 3.3. Market Trends
- 3.4. Market Opportunities
- 4. Market Factor Analysis
- 4.1. Porters Five Forces
- 4.1.1. Bargaining Power of Suppliers
- 4.1.2. Bargaining Power of Buyers
- 4.1.3. Threat of New Entrants
- 4.1.4. Threat of Substitutes
- 4.1.5. Competitive Rivalry
- 4.2. PESTEL analysis
- 4.3. BCG Analysis
- 4.3.1. Stars (High Growth, High Market Share)
- 4.3.2. Cash Cows (Low Growth, High Market Share)
- 4.3.3. Question Mark (High Growth, Low Market Share)
- 4.3.4. Dogs (Low Growth, Low Market Share)
- 4.4. Ansoff Matrix Analysis
- 4.5. Supply Chain Analysis
- 4.6. Regulatory Landscape
- 4.7. Current Market Potential and Opportunity Assessment (TAM–SAM–SOM Framework)
- 4.8. MDP Analyst Note
- 4.1. Porters Five Forces
- 5. Market Analysis, Insights and Forecast 2021-2033
- 5.1. Market Analysis, Insights and Forecast - by Technology
- 5.1.1. Hybrid Mass Spectrometry
- 5.1.1.1. Triple Quadrupole (Tandem)
- 5.1.1.2. Quadrupole TOF (Q-TOF)
- 5.1.1.3. FTMS (Fourier Transform Mass Spectrometry)
- 5.1.2. Single Mass Spectrometry
- 5.1.2.1. ION Trap
- 5.1.2.2. Time-of-Flight (TOF)
- 5.1.3. Inductiv
- 5.1.1. Hybrid Mass Spectrometry
- 5.2. Market Analysis, Insights and Forecast - by Application
- 5.2.1. Pharmaceuticals Industry
- 5.2.2. Biotechnology Industry
- 5.2.3. Chemical Industry
- 5.2.4. Other Application
- 5.3. Market Analysis, Insights and Forecast - by Region
- 5.3.1. North America
- 5.3.2. Europe
- 5.3.3. Asia Pacific
- 5.3.4. Middle East and Africa
- 5.3.5. South America
- 5.1. Market Analysis, Insights and Forecast - by Technology
- 6. Global Mass Spectrometry Market Analysis, Insights and Forecast, 2021-2033
- 6.1. Market Analysis, Insights and Forecast - by Technology
- 6.1.1. Hybrid Mass Spectrometry
- 6.1.1.1. Triple Quadrupole (Tandem)
- 6.1.1.2. Quadrupole TOF (Q-TOF)
- 6.1.1.3. FTMS (Fourier Transform Mass Spectrometry)
- 6.1.2. Single Mass Spectrometry
- 6.1.2.1. ION Trap
- 6.1.2.2. Time-of-Flight (TOF)
- 6.1.3. Inductiv
- 6.1.1. Hybrid Mass Spectrometry
- 6.2. Market Analysis, Insights and Forecast - by Application
- 6.2.1. Pharmaceuticals Industry
- 6.2.2. Biotechnology Industry
- 6.2.3. Chemical Industry
- 6.2.4. Other Application
- 6.1. Market Analysis, Insights and Forecast - by Technology
- 7. North America Mass Spectrometry Market Analysis, Insights and Forecast, 2020-2032
- 7.1. Market Analysis, Insights and Forecast - by Technology
- 7.1.1. Hybrid Mass Spectrometry
- 7.1.1.1. Triple Quadrupole (Tandem)
- 7.1.1.2. Quadrupole TOF (Q-TOF)
- 7.1.1.3. FTMS (Fourier Transform Mass Spectrometry)
- 7.1.2. Single Mass Spectrometry
- 7.1.2.1. ION Trap
- 7.1.2.2. Time-of-Flight (TOF)
- 7.1.3. Inductiv
- 7.1.1. Hybrid Mass Spectrometry
- 7.2. Market Analysis, Insights and Forecast - by Application
- 7.2.1. Pharmaceuticals Industry
- 7.2.2. Biotechnology Industry
- 7.2.3. Chemical Industry
- 7.2.4. Other Application
- 7.1. Market Analysis, Insights and Forecast - by Technology
- 8. Europe Mass Spectrometry Market Analysis, Insights and Forecast, 2020-2032
- 8.1. Market Analysis, Insights and Forecast - by Technology
- 8.1.1. Hybrid Mass Spectrometry
- 8.1.1.1. Triple Quadrupole (Tandem)
- 8.1.1.2. Quadrupole TOF (Q-TOF)
- 8.1.1.3. FTMS (Fourier Transform Mass Spectrometry)
- 8.1.2. Single Mass Spectrometry
- 8.1.2.1. ION Trap
- 8.1.2.2. Time-of-Flight (TOF)
- 8.1.3. Inductiv
- 8.1.1. Hybrid Mass Spectrometry
- 8.2. Market Analysis, Insights and Forecast - by Application
- 8.2.1. Pharmaceuticals Industry
- 8.2.2. Biotechnology Industry
- 8.2.3. Chemical Industry
- 8.2.4. Other Application
- 8.1. Market Analysis, Insights and Forecast - by Technology
- 9. Asia Pacific Mass Spectrometry Market Analysis, Insights and Forecast, 2020-2032
- 9.1. Market Analysis, Insights and Forecast - by Technology
- 9.1.1. Hybrid Mass Spectrometry
- 9.1.1.1. Triple Quadrupole (Tandem)
- 9.1.1.2. Quadrupole TOF (Q-TOF)
- 9.1.1.3. FTMS (Fourier Transform Mass Spectrometry)
- 9.1.2. Single Mass Spectrometry
- 9.1.2.1. ION Trap
- 9.1.2.2. Time-of-Flight (TOF)
- 9.1.3. Inductiv
- 9.1.1. Hybrid Mass Spectrometry
- 9.2. Market Analysis, Insights and Forecast - by Application
- 9.2.1. Pharmaceuticals Industry
- 9.2.2. Biotechnology Industry
- 9.2.3. Chemical Industry
- 9.2.4. Other Application
- 9.1. Market Analysis, Insights and Forecast - by Technology
- 10. Middle East and Africa Mass Spectrometry Market Analysis, Insights and Forecast, 2020-2032
- 10.1. Market Analysis, Insights and Forecast - by Technology
- 10.1.1. Hybrid Mass Spectrometry
- 10.1.1.1. Triple Quadrupole (Tandem)
- 10.1.1.2. Quadrupole TOF (Q-TOF)
- 10.1.1.3. FTMS (Fourier Transform Mass Spectrometry)
- 10.1.2. Single Mass Spectrometry
- 10.1.2.1. ION Trap
- 10.1.2.2. Time-of-Flight (TOF)
- 10.1.3. Inductiv
- 10.1.1. Hybrid Mass Spectrometry
- 10.2. Market Analysis, Insights and Forecast - by Application
- 10.2.1. Pharmaceuticals Industry
- 10.2.2. Biotechnology Industry
- 10.2.3. Chemical Industry
- 10.2.4. Other Application
- 10.1. Market Analysis, Insights and Forecast - by Technology
- 11. South America Mass Spectrometry Market Analysis, Insights and Forecast, 2020-2032
- 11.1. Market Analysis, Insights and Forecast - by Technology
- 11.1.1. Hybrid Mass Spectrometry
- 11.1.1.1. Triple Quadrupole (Tandem)
- 11.1.1.2. Quadrupole TOF (Q-TOF)
- 11.1.1.3. FTMS (Fourier Transform Mass Spectrometry)
- 11.1.2. Single Mass Spectrometry
- 11.1.2.1. ION Trap
- 11.1.2.2. Time-of-Flight (TOF)
- 11.1.3. Inductiv
- 11.1.1. Hybrid Mass Spectrometry
- 11.2. Market Analysis, Insights and Forecast - by Application
- 11.2.1. Pharmaceuticals Industry
- 11.2.2. Biotechnology Industry
- 11.2.3. Chemical Industry
- 11.2.4. Other Application
- 11.1. Market Analysis, Insights and Forecast - by Technology
- 12. Competitive Analysis
- 12.1. Company Profiles
- 12.1.1 Waters Corporation
- 12.1.1.1. Company Overview
- 12.1.1.2. Products
- 12.1.1.3. Company Financials
- 12.1.1.4. SWOT Analysis
- 12.1.2 JEOL Ltd
- 12.1.2.1. Company Overview
- 12.1.2.2. Products
- 12.1.2.3. Company Financials
- 12.1.2.4. SWOT Analysis
- 12.1.3 Hitachi Ltd
- 12.1.3.1. Company Overview
- 12.1.3.2. Products
- 12.1.3.3. Company Financials
- 12.1.3.4. SWOT Analysis
- 12.1.4 MKS Instruments
- 12.1.4.1. Company Overview
- 12.1.4.2. Products
- 12.1.4.3. Company Financials
- 12.1.4.4. SWOT Analysis
- 12.1.5 Danaher Corporation
- 12.1.5.1. Company Overview
- 12.1.5.2. Products
- 12.1.5.3. Company Financials
- 12.1.5.4. SWOT Analysis
- 12.1.6 LECO Corporation
- 12.1.6.1. Company Overview
- 12.1.6.2. Products
- 12.1.6.3. Company Financials
- 12.1.6.4. SWOT Analysis
- 12.1.7 PerkinElmer Inc
- 12.1.7.1. Company Overview
- 12.1.7.2. Products
- 12.1.7.3. Company Financials
- 12.1.7.4. SWOT Analysis
- 12.1.8 Thermo Fisher Scientific
- 12.1.8.1. Company Overview
- 12.1.8.2. Products
- 12.1.8.3. Company Financials
- 12.1.8.4. SWOT Analysis
- 12.1.9 Bruker Corporation
- 12.1.9.1. Company Overview
- 12.1.9.2. Products
- 12.1.9.3. Company Financials
- 12.1.9.4. SWOT Analysis
- 12.1.10 Agilent Technologies
- 12.1.10.1. Company Overview
- 12.1.10.2. Products
- 12.1.10.3. Company Financials
- 12.1.10.4. SWOT Analysis
- 12.1.11 Shimadzu Corporation
- 12.1.11.1. Company Overview
- 12.1.11.2. Products
- 12.1.11.3. Company Financials
- 12.1.11.4. SWOT Analysis
- 12.1.1 Waters Corporation
- 12.2. Market Entropy
- 12.2.1 Company's Key Areas Served
- 12.2.2 Recent Developments
- 12.3. Company Market Share Analysis 2025
- 12.3.1 Top 5 Companies Market Share Analysis
- 12.3.2 Top 3 Companies Market Share Analysis
- 12.4. List of Potential Customers
- 13. Research Methodology
List of Figures
- Figure 1: Global Mass Spectrometry Market Revenue Breakdown (Million, %) by Region 2025 & 2033
- Figure 2: Global Mass Spectrometry Market Volume Breakdown (K Unit, %) by Region 2025 & 2033
- Figure 3: North America Mass Spectrometry Market Revenue (Million), by Technology 2025 & 2033
- Figure 4: North America Mass Spectrometry Market Volume (K Unit), by Technology 2025 & 2033
- Figure 5: North America Mass Spectrometry Market Revenue Share (%), by Technology 2025 & 2033
- Figure 6: North America Mass Spectrometry Market Volume Share (%), by Technology 2025 & 2033
- Figure 7: North America Mass Spectrometry Market Revenue (Million), by Application 2025 & 2033
- Figure 8: North America Mass Spectrometry Market Volume (K Unit), by Application 2025 & 2033
- Figure 9: North America Mass Spectrometry Market Revenue Share (%), by Application 2025 & 2033
- Figure 10: North America Mass Spectrometry Market Volume Share (%), by Application 2025 & 2033
- Figure 11: North America Mass Spectrometry Market Revenue (Million), by Country 2025 & 2033
- Figure 12: North America Mass Spectrometry Market Volume (K Unit), by Country 2025 & 2033
- Figure 13: North America Mass Spectrometry Market Revenue Share (%), by Country 2025 & 2033
- Figure 14: North America Mass Spectrometry Market Volume Share (%), by Country 2025 & 2033
- Figure 15: Europe Mass Spectrometry Market Revenue (Million), by Technology 2025 & 2033
- Figure 16: Europe Mass Spectrometry Market Volume (K Unit), by Technology 2025 & 2033
- Figure 17: Europe Mass Spectrometry Market Revenue Share (%), by Technology 2025 & 2033
- Figure 18: Europe Mass Spectrometry Market Volume Share (%), by Technology 2025 & 2033
- Figure 19: Europe Mass Spectrometry Market Revenue (Million), by Application 2025 & 2033
- Figure 20: Europe Mass Spectrometry Market Volume (K Unit), by Application 2025 & 2033
- Figure 21: Europe Mass Spectrometry Market Revenue Share (%), by Application 2025 & 2033
- Figure 22: Europe Mass Spectrometry Market Volume Share (%), by Application 2025 & 2033
- Figure 23: Europe Mass Spectrometry Market Revenue (Million), by Country 2025 & 2033
- Figure 24: Europe Mass Spectrometry Market Volume (K Unit), by Country 2025 & 2033
- Figure 25: Europe Mass Spectrometry Market Revenue Share (%), by Country 2025 & 2033
- Figure 26: Europe Mass Spectrometry Market Volume Share (%), by Country 2025 & 2033
- Figure 27: Asia Pacific Mass Spectrometry Market Revenue (Million), by Technology 2025 & 2033
- Figure 28: Asia Pacific Mass Spectrometry Market Volume (K Unit), by Technology 2025 & 2033
- Figure 29: Asia Pacific Mass Spectrometry Market Revenue Share (%), by Technology 2025 & 2033
- Figure 30: Asia Pacific Mass Spectrometry Market Volume Share (%), by Technology 2025 & 2033
- Figure 31: Asia Pacific Mass Spectrometry Market Revenue (Million), by Application 2025 & 2033
- Figure 32: Asia Pacific Mass Spectrometry Market Volume (K Unit), by Application 2025 & 2033
- Figure 33: Asia Pacific Mass Spectrometry Market Revenue Share (%), by Application 2025 & 2033
- Figure 34: Asia Pacific Mass Spectrometry Market Volume Share (%), by Application 2025 & 2033
- Figure 35: Asia Pacific Mass Spectrometry Market Revenue (Million), by Country 2025 & 2033
- Figure 36: Asia Pacific Mass Spectrometry Market Volume (K Unit), by Country 2025 & 2033
- Figure 37: Asia Pacific Mass Spectrometry Market Revenue Share (%), by Country 2025 & 2033
- Figure 38: Asia Pacific Mass Spectrometry Market Volume Share (%), by Country 2025 & 2033
- Figure 39: Middle East and Africa Mass Spectrometry Market Revenue (Million), by Technology 2025 & 2033
- Figure 40: Middle East and Africa Mass Spectrometry Market Volume (K Unit), by Technology 2025 & 2033
- Figure 41: Middle East and Africa Mass Spectrometry Market Revenue Share (%), by Technology 2025 & 2033
- Figure 42: Middle East and Africa Mass Spectrometry Market Volume Share (%), by Technology 2025 & 2033
- Figure 43: Middle East and Africa Mass Spectrometry Market Revenue (Million), by Application 2025 & 2033
- Figure 44: Middle East and Africa Mass Spectrometry Market Volume (K Unit), by Application 2025 & 2033
- Figure 45: Middle East and Africa Mass Spectrometry Market Revenue Share (%), by Application 2025 & 2033
- Figure 46: Middle East and Africa Mass Spectrometry Market Volume Share (%), by Application 2025 & 2033
- Figure 47: Middle East and Africa Mass Spectrometry Market Revenue (Million), by Country 2025 & 2033
- Figure 48: Middle East and Africa Mass Spectrometry Market Volume (K Unit), by Country 2025 & 2033
- Figure 49: Middle East and Africa Mass Spectrometry Market Revenue Share (%), by Country 2025 & 2033
- Figure 50: Middle East and Africa Mass Spectrometry Market Volume Share (%), by Country 2025 & 2033
- Figure 51: South America Mass Spectrometry Market Revenue (Million), by Technology 2025 & 2033
- Figure 52: South America Mass Spectrometry Market Volume (K Unit), by Technology 2025 & 2033
- Figure 53: South America Mass Spectrometry Market Revenue Share (%), by Technology 2025 & 2033
- Figure 54: South America Mass Spectrometry Market Volume Share (%), by Technology 2025 & 2033
- Figure 55: South America Mass Spectrometry Market Revenue (Million), by Application 2025 & 2033
- Figure 56: South America Mass Spectrometry Market Volume (K Unit), by Application 2025 & 2033
- Figure 57: South America Mass Spectrometry Market Revenue Share (%), by Application 2025 & 2033
- Figure 58: South America Mass Spectrometry Market Volume Share (%), by Application 2025 & 2033
- Figure 59: South America Mass Spectrometry Market Revenue (Million), by Country 2025 & 2033
- Figure 60: South America Mass Spectrometry Market Volume (K Unit), by Country 2025 & 2033
- Figure 61: South America Mass Spectrometry Market Revenue Share (%), by Country 2025 & 2033
- Figure 62: South America Mass Spectrometry Market Volume Share (%), by Country 2025 & 2033
List of Tables
- Table 1: Global Mass Spectrometry Market Revenue Million Forecast, by Technology 2020 & 2033
- Table 2: Global Mass Spectrometry Market Volume K Unit Forecast, by Technology 2020 & 2033
- Table 3: Global Mass Spectrometry Market Revenue Million Forecast, by Application 2020 & 2033
- Table 4: Global Mass Spectrometry Market Volume K Unit Forecast, by Application 2020 & 2033
- Table 5: Global Mass Spectrometry Market Revenue Million Forecast, by Region 2020 & 2033
- Table 6: Global Mass Spectrometry Market Volume K Unit Forecast, by Region 2020 & 2033
- Table 7: Global Mass Spectrometry Market Revenue Million Forecast, by Technology 2020 & 2033
- Table 8: Global Mass Spectrometry Market Volume K Unit Forecast, by Technology 2020 & 2033
- Table 9: Global Mass Spectrometry Market Revenue Million Forecast, by Application 2020 & 2033
- Table 10: Global Mass Spectrometry Market Volume K Unit Forecast, by Application 2020 & 2033
- Table 11: Global Mass Spectrometry Market Revenue Million Forecast, by Country 2020 & 2033
- Table 12: Global Mass Spectrometry Market Volume K Unit Forecast, by Country 2020 & 2033
- Table 13: United States Mass Spectrometry Market Revenue (Million) Forecast, by Application 2020 & 2033
- Table 14: United States Mass Spectrometry Market Volume (K Unit) Forecast, by Application 2020 & 2033
- Table 15: Canada Mass Spectrometry Market Revenue (Million) Forecast, by Application 2020 & 2033
- Table 16: Canada Mass Spectrometry Market Volume (K Unit) Forecast, by Application 2020 & 2033
- Table 17: Mexico Mass Spectrometry Market Revenue (Million) Forecast, by Application 2020 & 2033
- Table 18: Mexico Mass Spectrometry Market Volume (K Unit) Forecast, by Application 2020 & 2033
- Table 19: Global Mass Spectrometry Market Revenue Million Forecast, by Technology 2020 & 2033
- Table 20: Global Mass Spectrometry Market Volume K Unit Forecast, by Technology 2020 & 2033
- Table 21: Global Mass Spectrometry Market Revenue Million Forecast, by Application 2020 & 2033
- Table 22: Global Mass Spectrometry Market Volume K Unit Forecast, by Application 2020 & 2033
- Table 23: Global Mass Spectrometry Market Revenue Million Forecast, by Country 2020 & 2033
- Table 24: Global Mass Spectrometry Market Volume K Unit Forecast, by Country 2020 & 2033
- Table 25: Germany Mass Spectrometry Market Revenue (Million) Forecast, by Application 2020 & 2033
- Table 26: Germany Mass Spectrometry Market Volume (K Unit) Forecast, by Application 2020 & 2033
- Table 27: United Kingdom Mass Spectrometry Market Revenue (Million) Forecast, by Application 2020 & 2033
- Table 28: United Kingdom Mass Spectrometry Market Volume (K Unit) Forecast, by Application 2020 & 2033
- Table 29: France Mass Spectrometry Market Revenue (Million) Forecast, by Application 2020 & 2033
- Table 30: France Mass Spectrometry Market Volume (K Unit) Forecast, by Application 2020 & 2033
- Table 31: Italy Mass Spectrometry Market Revenue (Million) Forecast, by Application 2020 & 2033
- Table 32: Italy Mass Spectrometry Market Volume (K Unit) Forecast, by Application 2020 & 2033
- Table 33: Spain Mass Spectrometry Market Revenue (Million) Forecast, by Application 2020 & 2033
- Table 34: Spain Mass Spectrometry Market Volume (K Unit) Forecast, by Application 2020 & 2033
- Table 35: Rest of Europe Mass Spectrometry Market Revenue (Million) Forecast, by Application 2020 & 2033
- Table 36: Rest of Europe Mass Spectrometry Market Volume (K Unit) Forecast, by Application 2020 & 2033
- Table 37: Global Mass Spectrometry Market Revenue Million Forecast, by Technology 2020 & 2033
- Table 38: Global Mass Spectrometry Market Volume K Unit Forecast, by Technology 2020 & 2033
- Table 39: Global Mass Spectrometry Market Revenue Million Forecast, by Application 2020 & 2033
- Table 40: Global Mass Spectrometry Market Volume K Unit Forecast, by Application 2020 & 2033
- Table 41: Global Mass Spectrometry Market Revenue Million Forecast, by Country 2020 & 2033
- Table 42: Global Mass Spectrometry Market Volume K Unit Forecast, by Country 2020 & 2033
- Table 43: China Mass Spectrometry Market Revenue (Million) Forecast, by Application 2020 & 2033
- Table 44: China Mass Spectrometry Market Volume (K Unit) Forecast, by Application 2020 & 2033
- Table 45: Japan Mass Spectrometry Market Revenue (Million) Forecast, by Application 2020 & 2033
- Table 46: Japan Mass Spectrometry Market Volume (K Unit) Forecast, by Application 2020 & 2033
- Table 47: India Mass Spectrometry Market Revenue (Million) Forecast, by Application 2020 & 2033
- Table 48: India Mass Spectrometry Market Volume (K Unit) Forecast, by Application 2020 & 2033
- Table 49: Australia Mass Spectrometry Market Revenue (Million) Forecast, by Application 2020 & 2033
- Table 50: Australia Mass Spectrometry Market Volume (K Unit) Forecast, by Application 2020 & 2033
- Table 51: South Korea Mass Spectrometry Market Revenue (Million) Forecast, by Application 2020 & 2033
- Table 52: South Korea Mass Spectrometry Market Volume (K Unit) Forecast, by Application 2020 & 2033
- Table 53: Rest of Asia Pacific Mass Spectrometry Market Revenue (Million) Forecast, by Application 2020 & 2033
- Table 54: Rest of Asia Pacific Mass Spectrometry Market Volume (K Unit) Forecast, by Application 2020 & 2033
- Table 55: Global Mass Spectrometry Market Revenue Million Forecast, by Technology 2020 & 2033
- Table 56: Global Mass Spectrometry Market Volume K Unit Forecast, by Technology 2020 & 2033
- Table 57: Global Mass Spectrometry Market Revenue Million Forecast, by Application 2020 & 2033
- Table 58: Global Mass Spectrometry Market Volume K Unit Forecast, by Application 2020 & 2033
- Table 59: Global Mass Spectrometry Market Revenue Million Forecast, by Country 2020 & 2033
- Table 60: Global Mass Spectrometry Market Volume K Unit Forecast, by Country 2020 & 2033
- Table 61: GCC Mass Spectrometry Market Revenue (Million) Forecast, by Application 2020 & 2033
- Table 62: GCC Mass Spectrometry Market Volume (K Unit) Forecast, by Application 2020 & 2033
- Table 63: South Africa Mass Spectrometry Market Revenue (Million) Forecast, by Application 2020 & 2033
- Table 64: South Africa Mass Spectrometry Market Volume (K Unit) Forecast, by Application 2020 & 2033
- Table 65: Rest of Middle East and Africa Mass Spectrometry Market Revenue (Million) Forecast, by Application 2020 & 2033
- Table 66: Rest of Middle East and Africa Mass Spectrometry Market Volume (K Unit) Forecast, by Application 2020 & 2033
- Table 67: Global Mass Spectrometry Market Revenue Million Forecast, by Technology 2020 & 2033
- Table 68: Global Mass Spectrometry Market Volume K Unit Forecast, by Technology 2020 & 2033
- Table 69: Global Mass Spectrometry Market Revenue Million Forecast, by Application 2020 & 2033
- Table 70: Global Mass Spectrometry Market Volume K Unit Forecast, by Application 2020 & 2033
- Table 71: Global Mass Spectrometry Market Revenue Million Forecast, by Country 2020 & 2033
- Table 72: Global Mass Spectrometry Market Volume K Unit Forecast, by Country 2020 & 2033
- Table 73: Brazil Mass Spectrometry Market Revenue (Million) Forecast, by Application 2020 & 2033
- Table 74: Brazil Mass Spectrometry Market Volume (K Unit) Forecast, by Application 2020 & 2033
- Table 75: Argentina Mass Spectrometry Market Revenue (Million) Forecast, by Application 2020 & 2033
- Table 76: Argentina Mass Spectrometry Market Volume (K Unit) Forecast, by Application 2020 & 2033
- Table 77: Rest of South America Mass Spectrometry Market Revenue (Million) Forecast, by Application 2020 & 2033
- Table 78: Rest of South America Mass Spectrometry Market Volume (K Unit) Forecast, by Application 2020 & 2033
Frequently Asked Questions
1. What is the projected Compound Annual Growth Rate (CAGR) of the Mass Spectrometry Market?
The projected CAGR is approximately 6.25%.
2. Which companies are prominent players in the Mass Spectrometry Market?
Key companies in the market include Waters Corporation, JEOL Ltd, Hitachi Ltd, MKS Instruments, Danaher Corporation, LECO Corporation, PerkinElmer Inc, Thermo Fisher Scientific, Bruker Corporation, Agilent Technologies, Shimadzu Corporation.
3. What are the main segments of the Mass Spectrometry Market?
The market segments include Technology, Application.
4. Can you provide details about the market size?
The market size is estimated to be USD 6.77 Million as of 2022.
5. What are some drivers contributing to market growth?
Technological Advancements; Growing Concerns Over Food Safety; Increasing R&D Expenditure by Private and Government Research Organizations.
6. What are the notable trends driving market growth?
The Triple Quadrupole (Tandem) Segment is Expected to Hold a Significant Market Share.
7. Are there any restraints impacting market growth?
High Costs of Instruments; Lack of Skilled Professionals.
8. Can you provide examples of recent developments in the market?
In June 2022, Shimadzu Scientific Instruments launched the LCMS-2050 liquid chromatography quadrupole mass spectrometer that features a significantly reduced size, while providing high-speed and high-sensitivity analysis.
9. What pricing options are available for accessing the report?
Pricing options include single-user, multi-user, and enterprise licenses priced at USD 4750, USD 5250, and USD 8750 respectively.
10. Is the market size provided in terms of value or volume?
The market size is provided in terms of value, measured in Million and volume, measured in K Unit.
11. Are there any specific market keywords associated with the report?
Yes, the market keyword associated with the report is "Mass Spectrometry Market," which aids in identifying and referencing the specific market segment covered.
12. How do I determine which pricing option suits my needs best?
The pricing options vary based on user requirements and access needs. Individual users may opt for single-user licenses, while businesses requiring broader access may choose multi-user or enterprise licenses for cost-effective access to the report.
13. Are there any additional resources or data provided in the Mass Spectrometry Market report?
While the report offers comprehensive insights, it's advisable to review the specific contents or supplementary materials provided to ascertain if additional resources or data are available.
14. How can I stay updated on further developments or reports in the Mass Spectrometry Market?
To stay informed about further developments, trends, and reports in the Mass Spectrometry Market, consider subscribing to industry newsletters, following relevant companies and organizations, or regularly checking reputable industry news sources and publications.
Methodology
Step 1 - Identification of Relevant Samples Size from Population Database


Step 2 - Approaches for Defining Global Market Size (Value, Volume* & Price*)

Note*: In applicable scenarios
Step 3 - Data Sources
Primary Research
- Web Analytics
- Survey Reports
- Research Institute
- Latest Research Reports
- Opinion Leaders
Secondary Research
- Annual Reports
- White Paper
- Latest Press Release
- Industry Association
- Paid Database
- Investor Presentations

Step 4 - Data Triangulation
Involves using different sources of information in order to increase the validity of a study
These sources are likely to be stakeholders in a program - participants, other researchers, program staff, other community members, and so on.
Then we put all data in single framework & apply various statistical tools to find out the dynamic on the market.
During the analysis stage, feedback from the stakeholder groups would be compared to determine areas of agreement as well as areas of divergence