

Key Insights
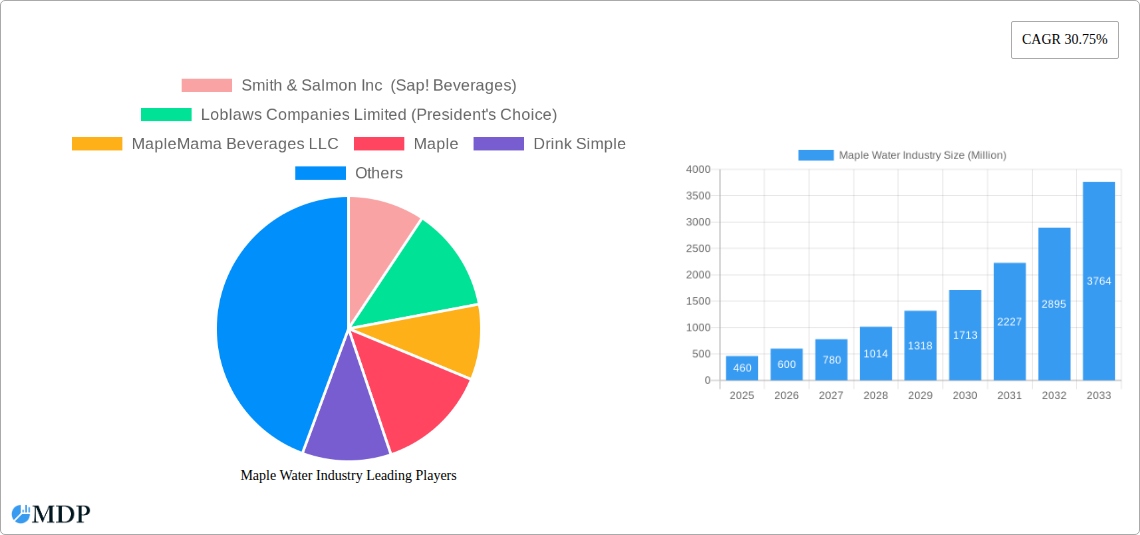
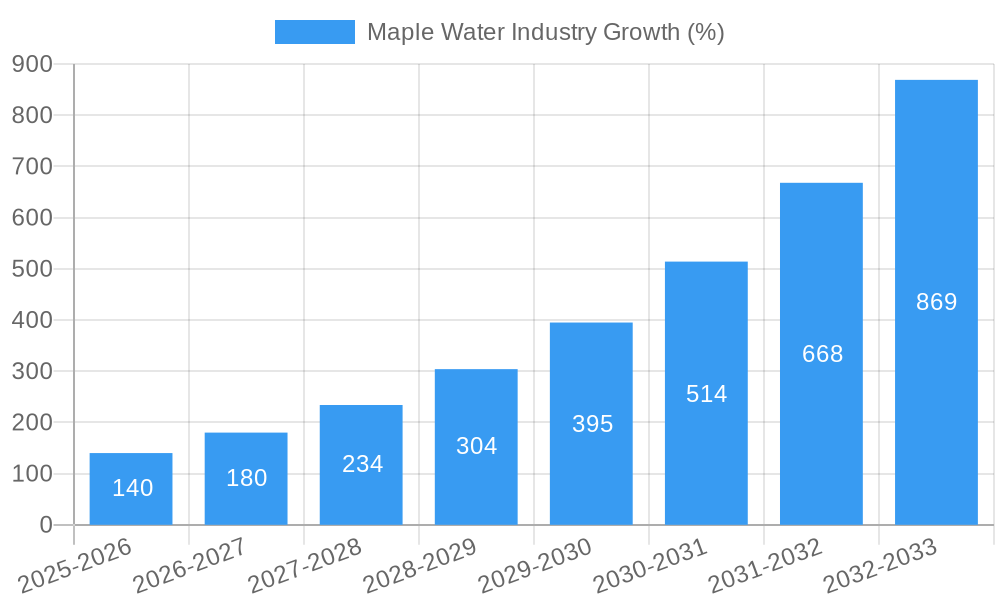
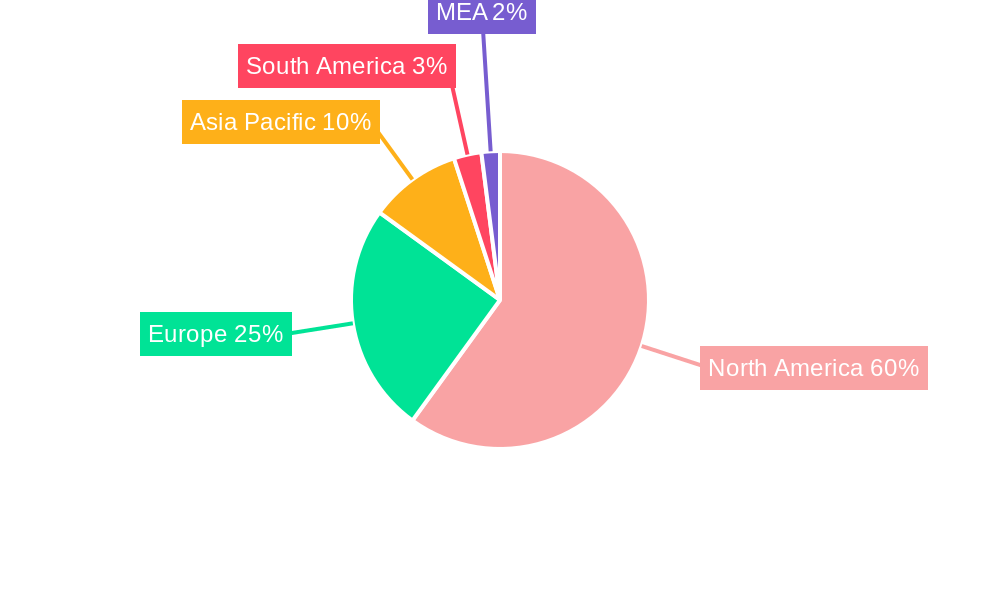
The maple water market, currently valued at $0.46 billion in 2025, is experiencing robust growth, projected to expand at a Compound Annual Growth Rate (CAGR) of 30.75% from 2025 to 2033. This significant expansion is driven by several key factors. The increasing consumer awareness of health and wellness is a primary driver, with maple water's naturally occurring electrolytes and antioxidants appealing to health-conscious individuals seeking healthier alternatives to sugary beverages. Furthermore, the growing popularity of plant-based and functional beverages is fueling demand. The diverse range of product offerings, including flavored and unflavored varieties packaged in bottles, cartons, and other formats, caters to a broad consumer base. Distribution channels are diversifying, with strong presence in supermarkets, convenience stores, specialty stores, and the rapidly expanding online retail sector. North America currently dominates the market, fueled by strong consumer adoption in the United States and Canada, but significant growth potential exists in Asia-Pacific and Europe as awareness increases. While challenges remain, such as potential price sensitivity and seasonal production constraints, the market's strong fundamentals suggest sustained growth.
The competitive landscape is dynamic, with both established players like Loblaws Companies Limited and emerging brands like MapleMama Beverages LLC vying for market share. The industry is marked by innovation in product development, focusing on unique flavors and convenient packaging. The focus on sustainability and ethically sourced maple sap is also gaining traction among environmentally conscious consumers. The continued expansion of distribution networks, particularly online channels, will be crucial for future growth. The market's future trajectory is positive, indicating significant opportunities for growth and investment. The increasing availability of maple water across diverse retail channels combined with successful marketing campaigns highlighting its health benefits will ensure its continued market penetration.
Maple Water Industry: A Comprehensive Market Report (2019-2033)
This in-depth report provides a comprehensive analysis of the global maple water industry, offering invaluable insights for stakeholders seeking to navigate this dynamic market. The study period covers 2019-2033, with a base year of 2025 and a forecast period spanning 2025-2033. The report leverages extensive data analysis to uncover key trends, challenges, and opportunities shaping the industry’s future. Expect detailed analysis of market size (projected to reach xx Million by 2033), competitive landscape, and segment-specific growth drivers. This report is essential for strategic decision-making and informed investment in this burgeoning sector.
Maple Water Industry Market Dynamics & Concentration
The global maple water market, while still relatively nascent, is experiencing significant growth fueled by increasing consumer awareness of health and wellness. Market concentration is moderate, with several key players vying for market share. The estimated market size in 2025 is xx Million, projected to reach xx Million by 2033, representing a CAGR of xx%. Innovation drives growth, with new product variations (flavored and unflavored) and packaging options continuously emerging. Regulatory frameworks surrounding food and beverage products significantly impact market dynamics. The presence of substitute beverages, such as coconut water and other fruit juices, necessitates continuous product differentiation. End-user trends reveal a preference for natural, healthy, and convenient options, driving demand for ready-to-drink maple water.
- Market Share (2025): Smith & Salmon Inc (Sap! Beverages) holds an estimated xx% market share, followed by Loblaws Companies Limited (President's Choice) at xx%. Other major players such as MapleMama Beverages LLC, and Asarasi each account for a significant portion of the remaining market share.
- M&A Activity (2019-2024): The industry witnessed approximately xx M&A deals during this period, largely driven by consolidation efforts among smaller players.
Maple Water Industry Industry Trends & Analysis
The maple water industry is characterized by robust growth driven by several key factors. Rising consumer demand for healthier alternatives to sugary drinks fuels market expansion. Technological advancements in extraction and processing methods enhance product quality and efficiency, driving down costs and improving scalability. The shift towards natural and minimally processed foods aligns perfectly with the inherent qualities of maple water. Competitive dynamics are shaped by intense innovation, strategic partnerships, and brand building efforts. The increasing adoption of online retail channels presents new growth avenues. The market is also witnessing a rise in the variety of product offerings such as flavored maple water.
- CAGR (2025-2033): xx%
- Market Penetration (2025): xx%
Leading Markets & Segments in Maple Water Industry
North America, specifically the United States and Canada, currently dominate the maple water market due to readily available resources and high consumer awareness. Within product types, unflavored maple water currently holds a larger market share, but flavored varieties are experiencing rapid growth. Bottles are the predominant packaging type, but cartons/Tetra Pak are gaining traction due to sustainability concerns. Supermarkets/hypermarkets account for the lion's share of distribution channels, though online retail is rapidly expanding.
Key Drivers for North American Dominance:
- Abundant maple tree resources.
- High consumer demand for healthy beverages.
- Established distribution networks.
- Strong brand recognition for maple products.
Segment-Specific Growth: Flavored maple water demonstrates the fastest growth due to evolving consumer preferences and increased product innovation. Cartons/Tetra Pak packaging is experiencing increased adoption owing to cost-effectiveness and sustainability.
Maple Water Industry Product Developments
Recent innovations include enhanced filtration techniques, resulting in higher-quality and clearer products. The introduction of flavored varieties caters to broader consumer tastes and preferences. Functional maple water, infused with added vitamins or minerals, is also gaining traction, expanding the product’s health benefits and market appeal. These developments contribute to stronger competitive advantages, particularly for brands that prioritize taste, purity, and enhanced functionality.
Key Drivers of Maple Water Industry Growth
The maple water industry’s growth is propelled by several key factors. The rising global awareness of healthy and natural beverages is a major catalyst. Technological advancements in maple sap harvesting and processing are increasing efficiency and output. Government support for sustainable agriculture and environmentally friendly practices encourages growth and adoption of maple water as a healthy alternative.
Challenges in the Maple Water Industry Market
Significant challenges include seasonal harvesting limitations impacting consistent supply. Maintaining product consistency and quality requires strict quality control measures. The industry faces competition from established beverage categories, necessitating strategic differentiation and strong branding. These factors can impact profitability and constrain market expansion.
Emerging Opportunities in Maple Water Industry
Emerging opportunities abound in expanding into new geographic markets with strong potential for consumer adoption, particularly in Asia and Europe. Strategic partnerships with food and beverage companies to develop co-branded products or expand distribution networks will open new revenue streams. Further product innovation, like functional additions or unique flavor profiles, will enhance market competitiveness and attract diverse consumer segments.
Leading Players in the Maple Water Industry Sector
- Smith & Salmon Inc (Sap! Beverages)
- Loblaws Companies Limited (President's Choice)
- MapleMama Beverages LLC
- Maple
- Drink Simple
- Lower Valley Beverage Co (sapsucker)
- Kiki Maple Water
- Feronia Forests LLC (Vertical Water)
- Pure Maple Water Company Ltd
- Asarasi
Key Milestones in Maple Water Industry Industry
- 2019: First significant investment in maple water processing technology.
- 2021: Launch of several new flavored maple water products.
- 2023: Increased focus on sustainable packaging options.
- 2024: Key strategic partnership between a major beverage company and a maple water producer.
Strategic Outlook for Maple Water Industry Market
The future of the maple water industry appears promising, with considerable potential for sustained growth. Expanding into new markets, particularly those with increasing demand for healthy and natural beverages, presents lucrative opportunities. Strategic partnerships, product innovation, and a focus on sustainable practices will be key to achieving long-term success in this dynamic market. Further research into the health benefits of maple water will reinforce its position as a premium, functional beverage.
Maple Water Industry Segmentation
-
1. Product Type
- 1.1. Flavored
- 1.2. Unflavored
-
2. Packaging Type
- 2.1. Bottles
- 2.2. Cartons/Tetra Pak
- 2.3. Other Packaging Types
-
3. Distribution Channel
- 3.1. Supermarkets/Hypermarkets
- 3.2. Convenience Stores
- 3.3. Specialty Stores
- 3.4. Online Retail Stores
- 3.5. Other Distribution Channels
Maple Water Industry Segmentation By Geography
-
1. North America
- 1.1. United States
- 1.2. Canada
- 1.3. Mexico
- 1.4. Rest of North America
-
2. Europe
- 2.1. Germany
- 2.2. United Kingdom
- 2.3. France
- 2.4. Italy
- 2.5. Spain
- 2.6. Rest of Europe
-
3. Asia Pacific
- 3.1. China
- 3.2. India
- 3.3. Australia
- 3.4. Japan
-
4. Rest of the World
- 4.1. South America
- 4.2. Middle East and Africa
Maple Water Industry REPORT HIGHLIGHTS
| Aspects | Details |
|---|---|
| Study Period | 2019-2033 |
| Base Year | 2024 |
| Estimated Year | 2025 |
| Forecast Period | 2025-2033 |
| Historical Period | 2019-2024 |
| Growth Rate | CAGR of 30.75% from 2019-2033 |
| Segmentation |
|
Table of Contents
- 1. Introduction
- 1.1. Research Scope
- 1.2. Market Segmentation
- 1.3. Research Methodology
- 1.4. Definitions and Assumptions
- 2. Executive Summary
- 2.1. Introduction
- 3. Market Dynamics
- 3.1. Introduction
- 3.2. Market Drivers
- 3.2.1. Popularization of Adventure Sports and Expedition; Suitability of the Freeze-Dried Technique for Heat Sensitive Food Products
- 3.3. Market Restrains
- 3.3.1. High Cost Associated with the Freeze-Drying Technology
- 3.4. Market Trends
- 3.4.1. Value-added Hydration is Evolving Consumer Preferences in the Maple Water Market
- 4. Market Factor Analysis
- 4.1. Porters Five Forces
- 4.2. Supply/Value Chain
- 4.3. PESTEL analysis
- 4.4. Market Entropy
- 4.5. Patent/Trademark Analysis
- 5. Global Maple Water Industry Analysis, Insights and Forecast, 2019-2031
- 5.1. Market Analysis, Insights and Forecast - by Product Type
- 5.1.1. Flavored
- 5.1.2. Unflavored
- 5.2. Market Analysis, Insights and Forecast - by Packaging Type
- 5.2.1. Bottles
- 5.2.2. Cartons/Tetra Pak
- 5.2.3. Other Packaging Types
- 5.3. Market Analysis, Insights and Forecast - by Distribution Channel
- 5.3.1. Supermarkets/Hypermarkets
- 5.3.2. Convenience Stores
- 5.3.3. Specialty Stores
- 5.3.4. Online Retail Stores
- 5.3.5. Other Distribution Channels
- 5.4. Market Analysis, Insights and Forecast - by Region
- 5.4.1. North America
- 5.4.2. Europe
- 5.4.3. Asia Pacific
- 5.4.4. Rest of the World
- 5.1. Market Analysis, Insights and Forecast - by Product Type
- 6. North America Maple Water Industry Analysis, Insights and Forecast, 2019-2031
- 6.1. Market Analysis, Insights and Forecast - by Product Type
- 6.1.1. Flavored
- 6.1.2. Unflavored
- 6.2. Market Analysis, Insights and Forecast - by Packaging Type
- 6.2.1. Bottles
- 6.2.2. Cartons/Tetra Pak
- 6.2.3. Other Packaging Types
- 6.3. Market Analysis, Insights and Forecast - by Distribution Channel
- 6.3.1. Supermarkets/Hypermarkets
- 6.3.2. Convenience Stores
- 6.3.3. Specialty Stores
- 6.3.4. Online Retail Stores
- 6.3.5. Other Distribution Channels
- 6.1. Market Analysis, Insights and Forecast - by Product Type
- 7. Europe Maple Water Industry Analysis, Insights and Forecast, 2019-2031
- 7.1. Market Analysis, Insights and Forecast - by Product Type
- 7.1.1. Flavored
- 7.1.2. Unflavored
- 7.2. Market Analysis, Insights and Forecast - by Packaging Type
- 7.2.1. Bottles
- 7.2.2. Cartons/Tetra Pak
- 7.2.3. Other Packaging Types
- 7.3. Market Analysis, Insights and Forecast - by Distribution Channel
- 7.3.1. Supermarkets/Hypermarkets
- 7.3.2. Convenience Stores
- 7.3.3. Specialty Stores
- 7.3.4. Online Retail Stores
- 7.3.5. Other Distribution Channels
- 7.1. Market Analysis, Insights and Forecast - by Product Type
- 8. Asia Pacific Maple Water Industry Analysis, Insights and Forecast, 2019-2031
- 8.1. Market Analysis, Insights and Forecast - by Product Type
- 8.1.1. Flavored
- 8.1.2. Unflavored
- 8.2. Market Analysis, Insights and Forecast - by Packaging Type
- 8.2.1. Bottles
- 8.2.2. Cartons/Tetra Pak
- 8.2.3. Other Packaging Types
- 8.3. Market Analysis, Insights and Forecast - by Distribution Channel
- 8.3.1. Supermarkets/Hypermarkets
- 8.3.2. Convenience Stores
- 8.3.3. Specialty Stores
- 8.3.4. Online Retail Stores
- 8.3.5. Other Distribution Channels
- 8.1. Market Analysis, Insights and Forecast - by Product Type
- 9. Rest of the World Maple Water Industry Analysis, Insights and Forecast, 2019-2031
- 9.1. Market Analysis, Insights and Forecast - by Product Type
- 9.1.1. Flavored
- 9.1.2. Unflavored
- 9.2. Market Analysis, Insights and Forecast - by Packaging Type
- 9.2.1. Bottles
- 9.2.2. Cartons/Tetra Pak
- 9.2.3. Other Packaging Types
- 9.3. Market Analysis, Insights and Forecast - by Distribution Channel
- 9.3.1. Supermarkets/Hypermarkets
- 9.3.2. Convenience Stores
- 9.3.3. Specialty Stores
- 9.3.4. Online Retail Stores
- 9.3.5. Other Distribution Channels
- 9.1. Market Analysis, Insights and Forecast - by Product Type
- 10. North America Maple Water Industry Analysis, Insights and Forecast, 2019-2031
- 10.1. Market Analysis, Insights and Forecast - By Country/Sub-region
- 10.1.1 United States
- 10.1.2 Canada
- 10.1.3 Mexico
- 11. Europe Maple Water Industry Analysis, Insights and Forecast, 2019-2031
- 11.1. Market Analysis, Insights and Forecast - By Country/Sub-region
- 11.1.1 Germany
- 11.1.2 United Kingdom
- 11.1.3 France
- 11.1.4 Spain
- 11.1.5 Italy
- 11.1.6 Spain
- 11.1.7 Belgium
- 11.1.8 Netherland
- 11.1.9 Nordics
- 11.1.10 Rest of Europe
- 12. Asia Pacific Maple Water Industry Analysis, Insights and Forecast, 2019-2031
- 12.1. Market Analysis, Insights and Forecast - By Country/Sub-region
- 12.1.1 China
- 12.1.2 Japan
- 12.1.3 India
- 12.1.4 South Korea
- 12.1.5 Southeast Asia
- 12.1.6 Australia
- 12.1.7 Indonesia
- 12.1.8 Phillipes
- 12.1.9 Singapore
- 12.1.10 Thailandc
- 12.1.11 Rest of Asia Pacific
- 13. South America Maple Water Industry Analysis, Insights and Forecast, 2019-2031
- 13.1. Market Analysis, Insights and Forecast - By Country/Sub-region
- 13.1.1 Brazil
- 13.1.2 Argentina
- 13.1.3 Peru
- 13.1.4 Chile
- 13.1.5 Colombia
- 13.1.6 Ecuador
- 13.1.7 Venezuela
- 13.1.8 Rest of South America
- 14. North America Maple Water Industry Analysis, Insights and Forecast, 2019-2031
- 14.1. Market Analysis, Insights and Forecast - By Country/Sub-region
- 14.1.1 United States
- 14.1.2 Canada
- 14.1.3 Mexico
- 15. MEA Maple Water Industry Analysis, Insights and Forecast, 2019-2031
- 15.1. Market Analysis, Insights and Forecast - By Country/Sub-region
- 15.1.1 United Arab Emirates
- 15.1.2 Saudi Arabia
- 15.1.3 South Africa
- 15.1.4 Rest of Middle East and Africa
- 16. Competitive Analysis
- 16.1. Global Market Share Analysis 2024
- 16.2. Company Profiles
- 16.2.1 Smith & Salmon Inc (Sap! Beverages)
- 16.2.1.1. Overview
- 16.2.1.2. Products
- 16.2.1.3. SWOT Analysis
- 16.2.1.4. Recent Developments
- 16.2.1.5. Financials (Based on Availability)
- 16.2.2 Loblaws Companies Limited (President's Choice)
- 16.2.2.1. Overview
- 16.2.2.2. Products
- 16.2.2.3. SWOT Analysis
- 16.2.2.4. Recent Developments
- 16.2.2.5. Financials (Based on Availability)
- 16.2.3 MapleMama Beverages LLC
- 16.2.3.1. Overview
- 16.2.3.2. Products
- 16.2.3.3. SWOT Analysis
- 16.2.3.4. Recent Developments
- 16.2.3.5. Financials (Based on Availability)
- 16.2.4 Maple
- 16.2.4.1. Overview
- 16.2.4.2. Products
- 16.2.4.3. SWOT Analysis
- 16.2.4.4. Recent Developments
- 16.2.4.5. Financials (Based on Availability)
- 16.2.5 Drink Simple
- 16.2.5.1. Overview
- 16.2.5.2. Products
- 16.2.5.3. SWOT Analysis
- 16.2.5.4. Recent Developments
- 16.2.5.5. Financials (Based on Availability)
- 16.2.6 Lower Valley Beverage Co(sapsucker)*List Not Exhaustive
- 16.2.6.1. Overview
- 16.2.6.2. Products
- 16.2.6.3. SWOT Analysis
- 16.2.6.4. Recent Developments
- 16.2.6.5. Financials (Based on Availability)
- 16.2.7 Kiki Maple Water
- 16.2.7.1. Overview
- 16.2.7.2. Products
- 16.2.7.3. SWOT Analysis
- 16.2.7.4. Recent Developments
- 16.2.7.5. Financials (Based on Availability)
- 16.2.8 Feronia Forests LLC (Vertical Water)
- 16.2.8.1. Overview
- 16.2.8.2. Products
- 16.2.8.3. SWOT Analysis
- 16.2.8.4. Recent Developments
- 16.2.8.5. Financials (Based on Availability)
- 16.2.9 Pure Maple Water Company Ltd
- 16.2.9.1. Overview
- 16.2.9.2. Products
- 16.2.9.3. SWOT Analysis
- 16.2.9.4. Recent Developments
- 16.2.9.5. Financials (Based on Availability)
- 16.2.10 Asarasi
- 16.2.10.1. Overview
- 16.2.10.2. Products
- 16.2.10.3. SWOT Analysis
- 16.2.10.4. Recent Developments
- 16.2.10.5. Financials (Based on Availability)
- 16.2.1 Smith & Salmon Inc (Sap! Beverages)
List of Figures
- Figure 1: Global Maple Water Industry Revenue Breakdown (Million, %) by Region 2024 & 2032
- Figure 2: North America Maple Water Industry Revenue (Million), by Country 2024 & 2032
- Figure 3: North America Maple Water Industry Revenue Share (%), by Country 2024 & 2032
- Figure 4: Europe Maple Water Industry Revenue (Million), by Country 2024 & 2032
- Figure 5: Europe Maple Water Industry Revenue Share (%), by Country 2024 & 2032
- Figure 6: Asia Pacific Maple Water Industry Revenue (Million), by Country 2024 & 2032
- Figure 7: Asia Pacific Maple Water Industry Revenue Share (%), by Country 2024 & 2032
- Figure 8: South America Maple Water Industry Revenue (Million), by Country 2024 & 2032
- Figure 9: South America Maple Water Industry Revenue Share (%), by Country 2024 & 2032
- Figure 10: North America Maple Water Industry Revenue (Million), by Country 2024 & 2032
- Figure 11: North America Maple Water Industry Revenue Share (%), by Country 2024 & 2032
- Figure 12: MEA Maple Water Industry Revenue (Million), by Country 2024 & 2032
- Figure 13: MEA Maple Water Industry Revenue Share (%), by Country 2024 & 2032
- Figure 14: North America Maple Water Industry Revenue (Million), by Product Type 2024 & 2032
- Figure 15: North America Maple Water Industry Revenue Share (%), by Product Type 2024 & 2032
- Figure 16: North America Maple Water Industry Revenue (Million), by Packaging Type 2024 & 2032
- Figure 17: North America Maple Water Industry Revenue Share (%), by Packaging Type 2024 & 2032
- Figure 18: North America Maple Water Industry Revenue (Million), by Distribution Channel 2024 & 2032
- Figure 19: North America Maple Water Industry Revenue Share (%), by Distribution Channel 2024 & 2032
- Figure 20: North America Maple Water Industry Revenue (Million), by Country 2024 & 2032
- Figure 21: North America Maple Water Industry Revenue Share (%), by Country 2024 & 2032
- Figure 22: Europe Maple Water Industry Revenue (Million), by Product Type 2024 & 2032
- Figure 23: Europe Maple Water Industry Revenue Share (%), by Product Type 2024 & 2032
- Figure 24: Europe Maple Water Industry Revenue (Million), by Packaging Type 2024 & 2032
- Figure 25: Europe Maple Water Industry Revenue Share (%), by Packaging Type 2024 & 2032
- Figure 26: Europe Maple Water Industry Revenue (Million), by Distribution Channel 2024 & 2032
- Figure 27: Europe Maple Water Industry Revenue Share (%), by Distribution Channel 2024 & 2032
- Figure 28: Europe Maple Water Industry Revenue (Million), by Country 2024 & 2032
- Figure 29: Europe Maple Water Industry Revenue Share (%), by Country 2024 & 2032
- Figure 30: Asia Pacific Maple Water Industry Revenue (Million), by Product Type 2024 & 2032
- Figure 31: Asia Pacific Maple Water Industry Revenue Share (%), by Product Type 2024 & 2032
- Figure 32: Asia Pacific Maple Water Industry Revenue (Million), by Packaging Type 2024 & 2032
- Figure 33: Asia Pacific Maple Water Industry Revenue Share (%), by Packaging Type 2024 & 2032
- Figure 34: Asia Pacific Maple Water Industry Revenue (Million), by Distribution Channel 2024 & 2032
- Figure 35: Asia Pacific Maple Water Industry Revenue Share (%), by Distribution Channel 2024 & 2032
- Figure 36: Asia Pacific Maple Water Industry Revenue (Million), by Country 2024 & 2032
- Figure 37: Asia Pacific Maple Water Industry Revenue Share (%), by Country 2024 & 2032
- Figure 38: Rest of the World Maple Water Industry Revenue (Million), by Product Type 2024 & 2032
- Figure 39: Rest of the World Maple Water Industry Revenue Share (%), by Product Type 2024 & 2032
- Figure 40: Rest of the World Maple Water Industry Revenue (Million), by Packaging Type 2024 & 2032
- Figure 41: Rest of the World Maple Water Industry Revenue Share (%), by Packaging Type 2024 & 2032
- Figure 42: Rest of the World Maple Water Industry Revenue (Million), by Distribution Channel 2024 & 2032
- Figure 43: Rest of the World Maple Water Industry Revenue Share (%), by Distribution Channel 2024 & 2032
- Figure 44: Rest of the World Maple Water Industry Revenue (Million), by Country 2024 & 2032
- Figure 45: Rest of the World Maple Water Industry Revenue Share (%), by Country 2024 & 2032
List of Tables
- Table 1: Global Maple Water Industry Revenue Million Forecast, by Region 2019 & 2032
- Table 2: Global Maple Water Industry Revenue Million Forecast, by Product Type 2019 & 2032
- Table 3: Global Maple Water Industry Revenue Million Forecast, by Packaging Type 2019 & 2032
- Table 4: Global Maple Water Industry Revenue Million Forecast, by Distribution Channel 2019 & 2032
- Table 5: Global Maple Water Industry Revenue Million Forecast, by Region 2019 & 2032
- Table 6: Global Maple Water Industry Revenue Million Forecast, by Country 2019 & 2032
- Table 7: United States Maple Water Industry Revenue (Million) Forecast, by Application 2019 & 2032
- Table 8: Canada Maple Water Industry Revenue (Million) Forecast, by Application 2019 & 2032
- Table 9: Mexico Maple Water Industry Revenue (Million) Forecast, by Application 2019 & 2032
- Table 10: Global Maple Water Industry Revenue Million Forecast, by Country 2019 & 2032
- Table 11: Germany Maple Water Industry Revenue (Million) Forecast, by Application 2019 & 2032
- Table 12: United Kingdom Maple Water Industry Revenue (Million) Forecast, by Application 2019 & 2032
- Table 13: France Maple Water Industry Revenue (Million) Forecast, by Application 2019 & 2032
- Table 14: Spain Maple Water Industry Revenue (Million) Forecast, by Application 2019 & 2032
- Table 15: Italy Maple Water Industry Revenue (Million) Forecast, by Application 2019 & 2032
- Table 16: Spain Maple Water Industry Revenue (Million) Forecast, by Application 2019 & 2032
- Table 17: Belgium Maple Water Industry Revenue (Million) Forecast, by Application 2019 & 2032
- Table 18: Netherland Maple Water Industry Revenue (Million) Forecast, by Application 2019 & 2032
- Table 19: Nordics Maple Water Industry Revenue (Million) Forecast, by Application 2019 & 2032
- Table 20: Rest of Europe Maple Water Industry Revenue (Million) Forecast, by Application 2019 & 2032
- Table 21: Global Maple Water Industry Revenue Million Forecast, by Country 2019 & 2032
- Table 22: China Maple Water Industry Revenue (Million) Forecast, by Application 2019 & 2032
- Table 23: Japan Maple Water Industry Revenue (Million) Forecast, by Application 2019 & 2032
- Table 24: India Maple Water Industry Revenue (Million) Forecast, by Application 2019 & 2032
- Table 25: South Korea Maple Water Industry Revenue (Million) Forecast, by Application 2019 & 2032
- Table 26: Southeast Asia Maple Water Industry Revenue (Million) Forecast, by Application 2019 & 2032
- Table 27: Australia Maple Water Industry Revenue (Million) Forecast, by Application 2019 & 2032
- Table 28: Indonesia Maple Water Industry Revenue (Million) Forecast, by Application 2019 & 2032
- Table 29: Phillipes Maple Water Industry Revenue (Million) Forecast, by Application 2019 & 2032
- Table 30: Singapore Maple Water Industry Revenue (Million) Forecast, by Application 2019 & 2032
- Table 31: Thailandc Maple Water Industry Revenue (Million) Forecast, by Application 2019 & 2032
- Table 32: Rest of Asia Pacific Maple Water Industry Revenue (Million) Forecast, by Application 2019 & 2032
- Table 33: Global Maple Water Industry Revenue Million Forecast, by Country 2019 & 2032
- Table 34: Brazil Maple Water Industry Revenue (Million) Forecast, by Application 2019 & 2032
- Table 35: Argentina Maple Water Industry Revenue (Million) Forecast, by Application 2019 & 2032
- Table 36: Peru Maple Water Industry Revenue (Million) Forecast, by Application 2019 & 2032
- Table 37: Chile Maple Water Industry Revenue (Million) Forecast, by Application 2019 & 2032
- Table 38: Colombia Maple Water Industry Revenue (Million) Forecast, by Application 2019 & 2032
- Table 39: Ecuador Maple Water Industry Revenue (Million) Forecast, by Application 2019 & 2032
- Table 40: Venezuela Maple Water Industry Revenue (Million) Forecast, by Application 2019 & 2032
- Table 41: Rest of South America Maple Water Industry Revenue (Million) Forecast, by Application 2019 & 2032
- Table 42: Global Maple Water Industry Revenue Million Forecast, by Country 2019 & 2032
- Table 43: United States Maple Water Industry Revenue (Million) Forecast, by Application 2019 & 2032
- Table 44: Canada Maple Water Industry Revenue (Million) Forecast, by Application 2019 & 2032
- Table 45: Mexico Maple Water Industry Revenue (Million) Forecast, by Application 2019 & 2032
- Table 46: Global Maple Water Industry Revenue Million Forecast, by Country 2019 & 2032
- Table 47: United Arab Emirates Maple Water Industry Revenue (Million) Forecast, by Application 2019 & 2032
- Table 48: Saudi Arabia Maple Water Industry Revenue (Million) Forecast, by Application 2019 & 2032
- Table 49: South Africa Maple Water Industry Revenue (Million) Forecast, by Application 2019 & 2032
- Table 50: Rest of Middle East and Africa Maple Water Industry Revenue (Million) Forecast, by Application 2019 & 2032
- Table 51: Global Maple Water Industry Revenue Million Forecast, by Product Type 2019 & 2032
- Table 52: Global Maple Water Industry Revenue Million Forecast, by Packaging Type 2019 & 2032
- Table 53: Global Maple Water Industry Revenue Million Forecast, by Distribution Channel 2019 & 2032
- Table 54: Global Maple Water Industry Revenue Million Forecast, by Country 2019 & 2032
- Table 55: United States Maple Water Industry Revenue (Million) Forecast, by Application 2019 & 2032
- Table 56: Canada Maple Water Industry Revenue (Million) Forecast, by Application 2019 & 2032
- Table 57: Mexico Maple Water Industry Revenue (Million) Forecast, by Application 2019 & 2032
- Table 58: Rest of North America Maple Water Industry Revenue (Million) Forecast, by Application 2019 & 2032
- Table 59: Global Maple Water Industry Revenue Million Forecast, by Product Type 2019 & 2032
- Table 60: Global Maple Water Industry Revenue Million Forecast, by Packaging Type 2019 & 2032
- Table 61: Global Maple Water Industry Revenue Million Forecast, by Distribution Channel 2019 & 2032
- Table 62: Global Maple Water Industry Revenue Million Forecast, by Country 2019 & 2032
- Table 63: Germany Maple Water Industry Revenue (Million) Forecast, by Application 2019 & 2032
- Table 64: United Kingdom Maple Water Industry Revenue (Million) Forecast, by Application 2019 & 2032
- Table 65: France Maple Water Industry Revenue (Million) Forecast, by Application 2019 & 2032
- Table 66: Italy Maple Water Industry Revenue (Million) Forecast, by Application 2019 & 2032
- Table 67: Spain Maple Water Industry Revenue (Million) Forecast, by Application 2019 & 2032
- Table 68: Rest of Europe Maple Water Industry Revenue (Million) Forecast, by Application 2019 & 2032
- Table 69: Global Maple Water Industry Revenue Million Forecast, by Product Type 2019 & 2032
- Table 70: Global Maple Water Industry Revenue Million Forecast, by Packaging Type 2019 & 2032
- Table 71: Global Maple Water Industry Revenue Million Forecast, by Distribution Channel 2019 & 2032
- Table 72: Global Maple Water Industry Revenue Million Forecast, by Country 2019 & 2032
- Table 73: China Maple Water Industry Revenue (Million) Forecast, by Application 2019 & 2032
- Table 74: India Maple Water Industry Revenue (Million) Forecast, by Application 2019 & 2032
- Table 75: Australia Maple Water Industry Revenue (Million) Forecast, by Application 2019 & 2032
- Table 76: Japan Maple Water Industry Revenue (Million) Forecast, by Application 2019 & 2032
- Table 77: Global Maple Water Industry Revenue Million Forecast, by Product Type 2019 & 2032
- Table 78: Global Maple Water Industry Revenue Million Forecast, by Packaging Type 2019 & 2032
- Table 79: Global Maple Water Industry Revenue Million Forecast, by Distribution Channel 2019 & 2032
- Table 80: Global Maple Water Industry Revenue Million Forecast, by Country 2019 & 2032
- Table 81: South America Maple Water Industry Revenue (Million) Forecast, by Application 2019 & 2032
- Table 82: Middle East and Africa Maple Water Industry Revenue (Million) Forecast, by Application 2019 & 2032
Frequently Asked Questions
1. What is the projected Compound Annual Growth Rate (CAGR) of the Maple Water Industry?
The projected CAGR is approximately 30.75%.
2. Which companies are prominent players in the Maple Water Industry?
Key companies in the market include Smith & Salmon Inc (Sap! Beverages), Loblaws Companies Limited (President's Choice), MapleMama Beverages LLC, Maple, Drink Simple, Lower Valley Beverage Co(sapsucker)*List Not Exhaustive, Kiki Maple Water, Feronia Forests LLC (Vertical Water), Pure Maple Water Company Ltd, Asarasi.
3. What are the main segments of the Maple Water Industry?
The market segments include Product Type, Packaging Type, Distribution Channel.
4. Can you provide details about the market size?
The market size is estimated to be USD 0.46 Million as of 2022.
5. What are some drivers contributing to market growth?
Popularization of Adventure Sports and Expedition; Suitability of the Freeze-Dried Technique for Heat Sensitive Food Products.
6. What are the notable trends driving market growth?
Value-added Hydration is Evolving Consumer Preferences in the Maple Water Market.
7. Are there any restraints impacting market growth?
High Cost Associated with the Freeze-Drying Technology.
8. Can you provide examples of recent developments in the market?
N/A
9. What pricing options are available for accessing the report?
Pricing options include single-user, multi-user, and enterprise licenses priced at USD 4750, USD 5250, and USD 8750 respectively.
10. Is the market size provided in terms of value or volume?
The market size is provided in terms of value, measured in Million.
11. Are there any specific market keywords associated with the report?
Yes, the market keyword associated with the report is "Maple Water Industry," which aids in identifying and referencing the specific market segment covered.
12. How do I determine which pricing option suits my needs best?
The pricing options vary based on user requirements and access needs. Individual users may opt for single-user licenses, while businesses requiring broader access may choose multi-user or enterprise licenses for cost-effective access to the report.
13. Are there any additional resources or data provided in the Maple Water Industry report?
While the report offers comprehensive insights, it's advisable to review the specific contents or supplementary materials provided to ascertain if additional resources or data are available.
14. How can I stay updated on further developments or reports in the Maple Water Industry?
To stay informed about further developments, trends, and reports in the Maple Water Industry, consider subscribing to industry newsletters, following relevant companies and organizations, or regularly checking reputable industry news sources and publications.
Methodology
Step 1 - Identification of Relevant Samples Size from Population Database


Step 2 - Approaches for Defining Global Market Size (Value, Volume* & Price*)

Note*: In applicable scenarios
Step 3 - Data Sources
Primary Research
- Web Analytics
- Survey Reports
- Research Institute
- Latest Research Reports
- Opinion Leaders
Secondary Research
- Annual Reports
- White Paper
- Latest Press Release
- Industry Association
- Paid Database
- Investor Presentations

Step 4 - Data Triangulation
Involves using different sources of information in order to increase the validity of a study
These sources are likely to be stakeholders in a program - participants, other researchers, program staff, other community members, and so on.
Then we put all data in single framework & apply various statistical tools to find out the dynamic on the market.
During the analysis stage, feedback from the stakeholder groups would be compared to determine areas of agreement as well as areas of divergence
