

Key Insights
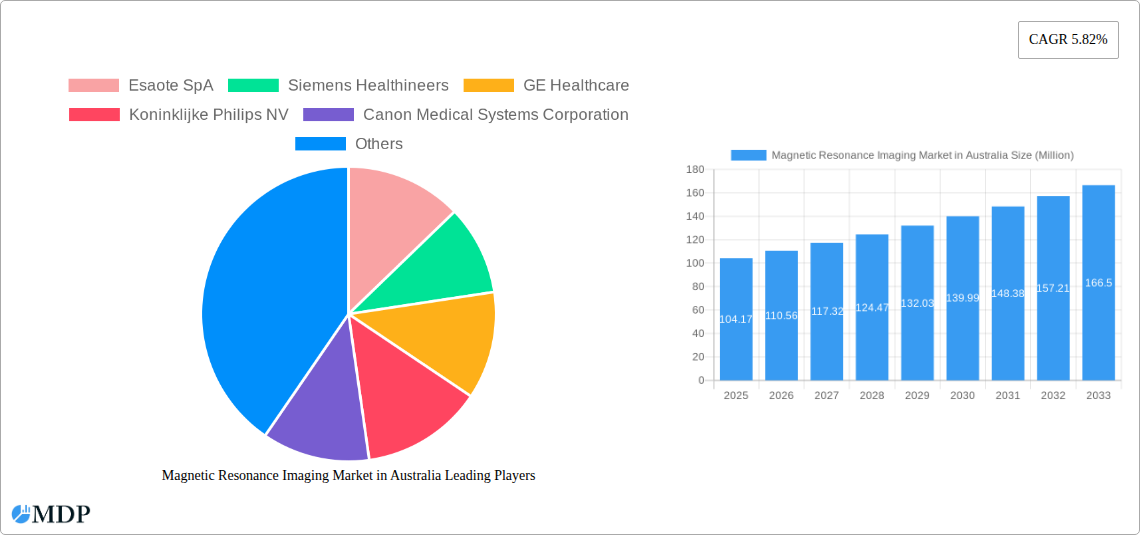
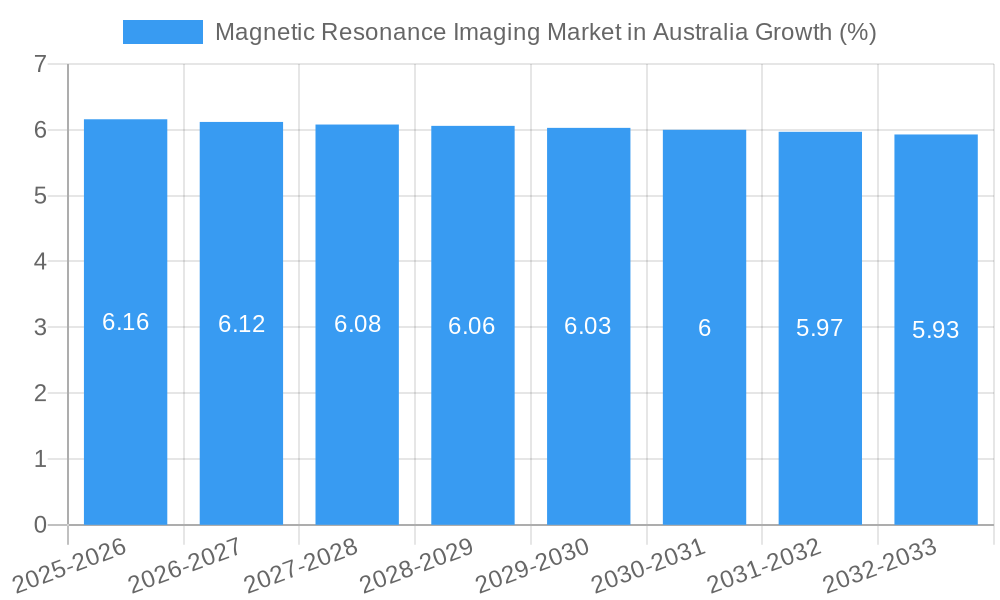
The Australian Magnetic Resonance Imaging (MRI) market, valued at $104.17 million in 2025, is projected to experience robust growth, driven by a rising prevalence of chronic diseases necessitating advanced diagnostic imaging, technological advancements leading to faster scan times and improved image quality, and increasing government initiatives promoting healthcare infrastructure development. The market's Compound Annual Growth Rate (CAGR) of 5.82% from 2019 to 2024 suggests a continued upward trajectory. This growth is further fueled by the increasing adoption of high-field and ultra-high-field MRI systems, offering superior image resolution and diagnostic capabilities. Specific application areas such as oncology, neurology, and cardiology are key contributors to this growth, as these fields increasingly rely on MRI for precise diagnosis and treatment planning. The market is segmented by MRI system type (closed vs. open), field strength (low, high, very high, ultra-high), and application area, with high-field and ultra-high-field systems and oncology applications expected to show the most significant growth. Competition in the market is intense, with major players like Siemens Healthineers, GE Healthcare, and Philips vying for market share through innovation and strategic partnerships.
The forecast period from 2025 to 2033 anticipates sustained expansion, potentially exceeding $104.17 million due to continued technological advancements, aging population driving higher demand for diagnostic services, and improved healthcare access. Factors that could restrain growth include high equipment costs, limited reimbursement policies, and the need for specialized personnel to operate and interpret MRI scans. However, the overall trend indicates a positive outlook for the Australian MRI market, with opportunities for growth across all segments, especially those leveraging innovative technologies and addressing unmet diagnostic needs. The continued expansion of private healthcare facilities and increased investment in public healthcare infrastructure will further bolster market growth in the coming years.
Magnetic Resonance Imaging (MRI) Market in Australia: A Comprehensive Report (2019-2033)
This comprehensive report provides an in-depth analysis of the Magnetic Resonance Imaging (MRI) market in Australia, offering invaluable insights for stakeholders across the healthcare and medical technology sectors. Covering the period from 2019 to 2033, with a focus on 2025, this report dissects market dynamics, trends, leading segments, and key players, providing a clear roadmap for future growth and strategic decision-making. The Australian MRI market is projected to reach xx Million by 2033, showcasing significant growth potential.
Magnetic Resonance Imaging Market in Australia Market Dynamics & Concentration
The Australian MRI market exhibits a moderately concentrated landscape, dominated by a handful of global players. Market share is largely determined by technological innovation, regulatory compliance, and strong distribution networks. The market is characterized by continuous innovation, with companies investing heavily in advanced MRI technologies like ultra-high field systems and AI-powered image analysis. Stringent regulatory frameworks, primarily overseen by the Therapeutic Goods Administration (TGA), influence product approvals and market entry. While limited, the presence of substitute imaging modalities (e.g., CT scans) exerts competitive pressure. End-user trends, driven by rising prevalence of chronic diseases and aging population, fuel demand for advanced imaging solutions. M&A activities in the sector remain moderate; however, the past five years have witnessed approximately xx M&A deals, primarily focused on strategic acquisitions to expand market reach and technological capabilities.
- Market Concentration: Moderately concentrated, with top 5 players holding approximately xx% market share.
- Innovation Drivers: Advanced MRI technologies (e.g., ultra-high field, AI-powered), improved image quality, faster scan times.
- Regulatory Framework: TGA regulations govern product approval and market access.
- Product Substitutes: CT scans, Ultrasound, X-ray.
- End-User Trends: Growing demand from hospitals, private clinics, and diagnostic imaging centers due to rising prevalence of chronic diseases.
- M&A Activity: Approximately xx M&A deals in the last five years.
Magnetic Resonance Imaging Market in Australia Industry Trends & Analysis
The Australian MRI market is experiencing robust growth, driven by factors such as increasing prevalence of chronic diseases, rising healthcare expenditure, government initiatives promoting healthcare infrastructure development, and technological advancements resulting in improved image quality and faster scan times. The market exhibits a compound annual growth rate (CAGR) of xx% during the historical period (2019-2024) and is projected to maintain a CAGR of xx% during the forecast period (2025-2033). Market penetration of advanced MRI technologies, such as ultra-high-field systems, remains relatively low but is expected to grow substantially in the coming years. Technological disruptions, particularly in the areas of AI-driven image analysis and cloud-based platforms, are reshaping the competitive landscape. Consumer preference for minimally invasive and faster procedures drives adoption of innovative MRI systems. Competitive dynamics are characterized by intense rivalry among major players, focusing on product differentiation, technological advancements, and strategic partnerships.
Leading Markets & Segments in Magnetic Resonance Imaging Market in Australia
The Australian MRI market demonstrates strong growth across all segments, with significant regional variations. While data on specific regional dominance is limited, major metropolitan areas like Sydney and Melbourne likely represent the largest markets due to higher concentration of healthcare facilities and population density.
Architecture: Closed MRI systems currently dominate the market due to superior image quality, however, open MRI systems are gaining traction, particularly in applications involving claustrophobic patients.
Field Strength: High-field MRI systems (1.5T and 3T) currently hold the largest market share due to their superior imaging capabilities. However, the adoption of very high-field and ultra-high-field systems is expected to increase significantly in the forecast period.
Application: Oncology, neurology, and musculoskeletal applications represent major segments, driven by the high prevalence of related diseases. Cardiology and gastroenterology applications are also showing promising growth.
- Key Drivers (All Segments): Government funding for healthcare infrastructure, increasing prevalence of chronic diseases, technological advancements.
Magnetic Resonance Imaging Market in Australia Product Developments
Recent product developments focus on enhancing image quality, reducing scan times, improving patient comfort (e.g., open MRI systems), and integrating AI for automated image analysis and diagnostic support. Manufacturers are emphasizing modular designs and adaptable systems to cater to diverse clinical needs and budget constraints. This trend aligns with growing demand for efficient and high-quality diagnostic services.
Key Drivers of Magnetic Resonance Imaging Market in Australia Growth
Several factors are driving the growth of the Australian MRI market:
- Technological advancements: Introduction of advanced MRI technologies, AI-powered image analysis, and improved patient comfort features.
- Rising prevalence of chronic diseases: Increasing rates of cancer, neurological disorders, and musculoskeletal issues.
- Government initiatives: Increased healthcare spending and investments in healthcare infrastructure.
Challenges in the Magnetic Resonance Imaging Market in Australia Market
The Australian MRI market faces challenges including:
- High cost of MRI systems: Limiting accessibility for smaller hospitals and clinics.
- Stringent regulatory approvals: Delaying market entry for new technologies.
- Competition from alternative imaging modalities: CT scans, Ultrasound.
- Skilled radiologist shortages: Impacting the efficiency and availability of MRI services.
Emerging Opportunities in Magnetic Resonance Imaging Market in Australia
Significant opportunities exist for growth, particularly within emerging technologies like AI-driven diagnostics, improved workflow optimization, and expansion into underserved rural areas. Strategic collaborations and partnerships between manufacturers, healthcare providers, and technology companies will be crucial to capitalizing on these opportunities. Furthermore, the integration of MRI with other imaging modalities and telehealth platforms holds great potential.
Leading Players in the Magnetic Resonance Imaging Market in Australia Sector
- Esaote SpA
- Siemens Healthineers
- GE Healthcare
- Koninklijke Philips NV
- Canon Medical Systems Corporation
- Sonologic Inc
- United Imaging Healthcare Co Ltd
- Fujifilm Holdings Corporation
Key Milestones in Magnetic Resonance Imaging Market in Australia Industry
- March 2022: Siemens MRI scanner installed at North Eastern Community Hospital, South Australia. This expansion increases MRI access in the region.
- April 2021: Philips installs cutting-edge digital imaging technologies at Westmead Hospital, Sydney, including Ingenia MR-OR intraoperative devices. This installation improves the speed and efficiency of neurosurgical procedures in Australia and New Zealand.
Strategic Outlook for Magnetic Resonance Imaging Market in Australia Market
The Australian MRI market presents significant long-term growth potential. Strategic investments in advanced technologies, expansion into underserved regions, and collaborations to optimize workflows will be key to success. The increasing focus on preventative healthcare and early disease detection will further drive demand for high-quality MRI services. Players focusing on innovative solutions, efficient service delivery, and strong partnerships are poised to capture significant market share.
Magnetic Resonance Imaging Market in Australia Segmentation
-
1. Architecture
- 1.1. Closed MRI Systems
- 1.2. Open MRI Systems
-
2. Field Strength
- 2.1. Low Field MRI Systems
- 2.2. High Field MRI Systems
- 2.3. Very Hig
-
3. Application
- 3.1. Oncology
- 3.2. Neurology
- 3.3. Cardiology
- 3.4. Gastroenterology
- 3.5. Musculoskeletal
- 3.6. Other Applications
Magnetic Resonance Imaging Market in Australia Segmentation By Geography
-
1. North America
- 1.1. United States
- 1.2. Canada
- 1.3. Mexico
-
2. South America
- 2.1. Brazil
- 2.2. Argentina
- 2.3. Rest of South America
-
3. Europe
- 3.1. United Kingdom
- 3.2. Germany
- 3.3. France
- 3.4. Italy
- 3.5. Spain
- 3.6. Russia
- 3.7. Benelux
- 3.8. Nordics
- 3.9. Rest of Europe
-
4. Middle East & Africa
- 4.1. Turkey
- 4.2. Israel
- 4.3. GCC
- 4.4. North Africa
- 4.5. South Africa
- 4.6. Rest of Middle East & Africa
-
5. Asia Pacific
- 5.1. China
- 5.2. India
- 5.3. Japan
- 5.4. South Korea
- 5.5. ASEAN
- 5.6. Oceania
- 5.7. Rest of Asia Pacific
Magnetic Resonance Imaging Market in Australia REPORT HIGHLIGHTS
| Aspects | Details |
|---|---|
| Study Period | 2019-2033 |
| Base Year | 2024 |
| Estimated Year | 2025 |
| Forecast Period | 2025-2033 |
| Historical Period | 2019-2024 |
| Growth Rate | CAGR of 5.82% from 2019-2033 |
| Segmentation |
|
Table of Contents
- 1. Introduction
- 1.1. Research Scope
- 1.2. Market Segmentation
- 1.3. Research Methodology
- 1.4. Definitions and Assumptions
- 2. Executive Summary
- 2.1. Introduction
- 3. Market Dynamics
- 3.1. Introduction
- 3.2. Market Drivers
- 3.2.1. Introduction of Hybrid MRI Systems; Availability of Universal Health Coverage
- 3.3. Market Restrains
- 3.3.1. High Cost of MRI Systems
- 3.4. Market Trends
- 3.4.1. Neurology is Expected to Witness Steady Growth Over the Forecast Period
- 4. Market Factor Analysis
- 4.1. Porters Five Forces
- 4.2. Supply/Value Chain
- 4.3. PESTEL analysis
- 4.4. Market Entropy
- 4.5. Patent/Trademark Analysis
- 5. Global Magnetic Resonance Imaging Market in Australia Analysis, Insights and Forecast, 2019-2031
- 5.1. Market Analysis, Insights and Forecast - by Architecture
- 5.1.1. Closed MRI Systems
- 5.1.2. Open MRI Systems
- 5.2. Market Analysis, Insights and Forecast - by Field Strength
- 5.2.1. Low Field MRI Systems
- 5.2.2. High Field MRI Systems
- 5.2.3. Very Hig
- 5.3. Market Analysis, Insights and Forecast - by Application
- 5.3.1. Oncology
- 5.3.2. Neurology
- 5.3.3. Cardiology
- 5.3.4. Gastroenterology
- 5.3.5. Musculoskeletal
- 5.3.6. Other Applications
- 5.4. Market Analysis, Insights and Forecast - by Region
- 5.4.1. North America
- 5.4.2. South America
- 5.4.3. Europe
- 5.4.4. Middle East & Africa
- 5.4.5. Asia Pacific
- 5.1. Market Analysis, Insights and Forecast - by Architecture
- 6. North America Magnetic Resonance Imaging Market in Australia Analysis, Insights and Forecast, 2019-2031
- 6.1. Market Analysis, Insights and Forecast - by Architecture
- 6.1.1. Closed MRI Systems
- 6.1.2. Open MRI Systems
- 6.2. Market Analysis, Insights and Forecast - by Field Strength
- 6.2.1. Low Field MRI Systems
- 6.2.2. High Field MRI Systems
- 6.2.3. Very Hig
- 6.3. Market Analysis, Insights and Forecast - by Application
- 6.3.1. Oncology
- 6.3.2. Neurology
- 6.3.3. Cardiology
- 6.3.4. Gastroenterology
- 6.3.5. Musculoskeletal
- 6.3.6. Other Applications
- 6.1. Market Analysis, Insights and Forecast - by Architecture
- 7. South America Magnetic Resonance Imaging Market in Australia Analysis, Insights and Forecast, 2019-2031
- 7.1. Market Analysis, Insights and Forecast - by Architecture
- 7.1.1. Closed MRI Systems
- 7.1.2. Open MRI Systems
- 7.2. Market Analysis, Insights and Forecast - by Field Strength
- 7.2.1. Low Field MRI Systems
- 7.2.2. High Field MRI Systems
- 7.2.3. Very Hig
- 7.3. Market Analysis, Insights and Forecast - by Application
- 7.3.1. Oncology
- 7.3.2. Neurology
- 7.3.3. Cardiology
- 7.3.4. Gastroenterology
- 7.3.5. Musculoskeletal
- 7.3.6. Other Applications
- 7.1. Market Analysis, Insights and Forecast - by Architecture
- 8. Europe Magnetic Resonance Imaging Market in Australia Analysis, Insights and Forecast, 2019-2031
- 8.1. Market Analysis, Insights and Forecast - by Architecture
- 8.1.1. Closed MRI Systems
- 8.1.2. Open MRI Systems
- 8.2. Market Analysis, Insights and Forecast - by Field Strength
- 8.2.1. Low Field MRI Systems
- 8.2.2. High Field MRI Systems
- 8.2.3. Very Hig
- 8.3. Market Analysis, Insights and Forecast - by Application
- 8.3.1. Oncology
- 8.3.2. Neurology
- 8.3.3. Cardiology
- 8.3.4. Gastroenterology
- 8.3.5. Musculoskeletal
- 8.3.6. Other Applications
- 8.1. Market Analysis, Insights and Forecast - by Architecture
- 9. Middle East & Africa Magnetic Resonance Imaging Market in Australia Analysis, Insights and Forecast, 2019-2031
- 9.1. Market Analysis, Insights and Forecast - by Architecture
- 9.1.1. Closed MRI Systems
- 9.1.2. Open MRI Systems
- 9.2. Market Analysis, Insights and Forecast - by Field Strength
- 9.2.1. Low Field MRI Systems
- 9.2.2. High Field MRI Systems
- 9.2.3. Very Hig
- 9.3. Market Analysis, Insights and Forecast - by Application
- 9.3.1. Oncology
- 9.3.2. Neurology
- 9.3.3. Cardiology
- 9.3.4. Gastroenterology
- 9.3.5. Musculoskeletal
- 9.3.6. Other Applications
- 9.1. Market Analysis, Insights and Forecast - by Architecture
- 10. Asia Pacific Magnetic Resonance Imaging Market in Australia Analysis, Insights and Forecast, 2019-2031
- 10.1. Market Analysis, Insights and Forecast - by Architecture
- 10.1.1. Closed MRI Systems
- 10.1.2. Open MRI Systems
- 10.2. Market Analysis, Insights and Forecast - by Field Strength
- 10.2.1. Low Field MRI Systems
- 10.2.2. High Field MRI Systems
- 10.2.3. Very Hig
- 10.3. Market Analysis, Insights and Forecast - by Application
- 10.3.1. Oncology
- 10.3.2. Neurology
- 10.3.3. Cardiology
- 10.3.4. Gastroenterology
- 10.3.5. Musculoskeletal
- 10.3.6. Other Applications
- 10.1. Market Analysis, Insights and Forecast - by Architecture
- 11. Competitive Analysis
- 11.1. Global Market Share Analysis 2024
- 11.2. Company Profiles
- 11.2.1 Esaote SpA
- 11.2.1.1. Overview
- 11.2.1.2. Products
- 11.2.1.3. SWOT Analysis
- 11.2.1.4. Recent Developments
- 11.2.1.5. Financials (Based on Availability)
- 11.2.2 Siemens Healthineers
- 11.2.2.1. Overview
- 11.2.2.2. Products
- 11.2.2.3. SWOT Analysis
- 11.2.2.4. Recent Developments
- 11.2.2.5. Financials (Based on Availability)
- 11.2.3 GE Healthcare
- 11.2.3.1. Overview
- 11.2.3.2. Products
- 11.2.3.3. SWOT Analysis
- 11.2.3.4. Recent Developments
- 11.2.3.5. Financials (Based on Availability)
- 11.2.4 Koninklijke Philips NV
- 11.2.4.1. Overview
- 11.2.4.2. Products
- 11.2.4.3. SWOT Analysis
- 11.2.4.4. Recent Developments
- 11.2.4.5. Financials (Based on Availability)
- 11.2.5 Canon Medical Systems Corporation
- 11.2.5.1. Overview
- 11.2.5.2. Products
- 11.2.5.3. SWOT Analysis
- 11.2.5.4. Recent Developments
- 11.2.5.5. Financials (Based on Availability)
- 11.2.6 Sonologic Inc
- 11.2.6.1. Overview
- 11.2.6.2. Products
- 11.2.6.3. SWOT Analysis
- 11.2.6.4. Recent Developments
- 11.2.6.5. Financials (Based on Availability)
- 11.2.7 United Imaging Healthcare Co Ltd
- 11.2.7.1. Overview
- 11.2.7.2. Products
- 11.2.7.3. SWOT Analysis
- 11.2.7.4. Recent Developments
- 11.2.7.5. Financials (Based on Availability)
- 11.2.8 Fujifilm Holdings Corporation
- 11.2.8.1. Overview
- 11.2.8.2. Products
- 11.2.8.3. SWOT Analysis
- 11.2.8.4. Recent Developments
- 11.2.8.5. Financials (Based on Availability)
- 11.2.1 Esaote SpA
List of Figures
- Figure 1: Global Magnetic Resonance Imaging Market in Australia Revenue Breakdown (Million, %) by Region 2024 & 2032
- Figure 2: Australia Magnetic Resonance Imaging Market in Australia Revenue (Million), by Country 2024 & 2032
- Figure 3: Australia Magnetic Resonance Imaging Market in Australia Revenue Share (%), by Country 2024 & 2032
- Figure 4: North America Magnetic Resonance Imaging Market in Australia Revenue (Million), by Architecture 2024 & 2032
- Figure 5: North America Magnetic Resonance Imaging Market in Australia Revenue Share (%), by Architecture 2024 & 2032
- Figure 6: North America Magnetic Resonance Imaging Market in Australia Revenue (Million), by Field Strength 2024 & 2032
- Figure 7: North America Magnetic Resonance Imaging Market in Australia Revenue Share (%), by Field Strength 2024 & 2032
- Figure 8: North America Magnetic Resonance Imaging Market in Australia Revenue (Million), by Application 2024 & 2032
- Figure 9: North America Magnetic Resonance Imaging Market in Australia Revenue Share (%), by Application 2024 & 2032
- Figure 10: North America Magnetic Resonance Imaging Market in Australia Revenue (Million), by Country 2024 & 2032
- Figure 11: North America Magnetic Resonance Imaging Market in Australia Revenue Share (%), by Country 2024 & 2032
- Figure 12: South America Magnetic Resonance Imaging Market in Australia Revenue (Million), by Architecture 2024 & 2032
- Figure 13: South America Magnetic Resonance Imaging Market in Australia Revenue Share (%), by Architecture 2024 & 2032
- Figure 14: South America Magnetic Resonance Imaging Market in Australia Revenue (Million), by Field Strength 2024 & 2032
- Figure 15: South America Magnetic Resonance Imaging Market in Australia Revenue Share (%), by Field Strength 2024 & 2032
- Figure 16: South America Magnetic Resonance Imaging Market in Australia Revenue (Million), by Application 2024 & 2032
- Figure 17: South America Magnetic Resonance Imaging Market in Australia Revenue Share (%), by Application 2024 & 2032
- Figure 18: South America Magnetic Resonance Imaging Market in Australia Revenue (Million), by Country 2024 & 2032
- Figure 19: South America Magnetic Resonance Imaging Market in Australia Revenue Share (%), by Country 2024 & 2032
- Figure 20: Europe Magnetic Resonance Imaging Market in Australia Revenue (Million), by Architecture 2024 & 2032
- Figure 21: Europe Magnetic Resonance Imaging Market in Australia Revenue Share (%), by Architecture 2024 & 2032
- Figure 22: Europe Magnetic Resonance Imaging Market in Australia Revenue (Million), by Field Strength 2024 & 2032
- Figure 23: Europe Magnetic Resonance Imaging Market in Australia Revenue Share (%), by Field Strength 2024 & 2032
- Figure 24: Europe Magnetic Resonance Imaging Market in Australia Revenue (Million), by Application 2024 & 2032
- Figure 25: Europe Magnetic Resonance Imaging Market in Australia Revenue Share (%), by Application 2024 & 2032
- Figure 26: Europe Magnetic Resonance Imaging Market in Australia Revenue (Million), by Country 2024 & 2032
- Figure 27: Europe Magnetic Resonance Imaging Market in Australia Revenue Share (%), by Country 2024 & 2032
- Figure 28: Middle East & Africa Magnetic Resonance Imaging Market in Australia Revenue (Million), by Architecture 2024 & 2032
- Figure 29: Middle East & Africa Magnetic Resonance Imaging Market in Australia Revenue Share (%), by Architecture 2024 & 2032
- Figure 30: Middle East & Africa Magnetic Resonance Imaging Market in Australia Revenue (Million), by Field Strength 2024 & 2032
- Figure 31: Middle East & Africa Magnetic Resonance Imaging Market in Australia Revenue Share (%), by Field Strength 2024 & 2032
- Figure 32: Middle East & Africa Magnetic Resonance Imaging Market in Australia Revenue (Million), by Application 2024 & 2032
- Figure 33: Middle East & Africa Magnetic Resonance Imaging Market in Australia Revenue Share (%), by Application 2024 & 2032
- Figure 34: Middle East & Africa Magnetic Resonance Imaging Market in Australia Revenue (Million), by Country 2024 & 2032
- Figure 35: Middle East & Africa Magnetic Resonance Imaging Market in Australia Revenue Share (%), by Country 2024 & 2032
- Figure 36: Asia Pacific Magnetic Resonance Imaging Market in Australia Revenue (Million), by Architecture 2024 & 2032
- Figure 37: Asia Pacific Magnetic Resonance Imaging Market in Australia Revenue Share (%), by Architecture 2024 & 2032
- Figure 38: Asia Pacific Magnetic Resonance Imaging Market in Australia Revenue (Million), by Field Strength 2024 & 2032
- Figure 39: Asia Pacific Magnetic Resonance Imaging Market in Australia Revenue Share (%), by Field Strength 2024 & 2032
- Figure 40: Asia Pacific Magnetic Resonance Imaging Market in Australia Revenue (Million), by Application 2024 & 2032
- Figure 41: Asia Pacific Magnetic Resonance Imaging Market in Australia Revenue Share (%), by Application 2024 & 2032
- Figure 42: Asia Pacific Magnetic Resonance Imaging Market in Australia Revenue (Million), by Country 2024 & 2032
- Figure 43: Asia Pacific Magnetic Resonance Imaging Market in Australia Revenue Share (%), by Country 2024 & 2032
List of Tables
- Table 1: Global Magnetic Resonance Imaging Market in Australia Revenue Million Forecast, by Region 2019 & 2032
- Table 2: Global Magnetic Resonance Imaging Market in Australia Revenue Million Forecast, by Architecture 2019 & 2032
- Table 3: Global Magnetic Resonance Imaging Market in Australia Revenue Million Forecast, by Field Strength 2019 & 2032
- Table 4: Global Magnetic Resonance Imaging Market in Australia Revenue Million Forecast, by Application 2019 & 2032
- Table 5: Global Magnetic Resonance Imaging Market in Australia Revenue Million Forecast, by Region 2019 & 2032
- Table 6: Global Magnetic Resonance Imaging Market in Australia Revenue Million Forecast, by Country 2019 & 2032
- Table 7: Global Magnetic Resonance Imaging Market in Australia Revenue Million Forecast, by Architecture 2019 & 2032
- Table 8: Global Magnetic Resonance Imaging Market in Australia Revenue Million Forecast, by Field Strength 2019 & 2032
- Table 9: Global Magnetic Resonance Imaging Market in Australia Revenue Million Forecast, by Application 2019 & 2032
- Table 10: Global Magnetic Resonance Imaging Market in Australia Revenue Million Forecast, by Country 2019 & 2032
- Table 11: United States Magnetic Resonance Imaging Market in Australia Revenue (Million) Forecast, by Application 2019 & 2032
- Table 12: Canada Magnetic Resonance Imaging Market in Australia Revenue (Million) Forecast, by Application 2019 & 2032
- Table 13: Mexico Magnetic Resonance Imaging Market in Australia Revenue (Million) Forecast, by Application 2019 & 2032
- Table 14: Global Magnetic Resonance Imaging Market in Australia Revenue Million Forecast, by Architecture 2019 & 2032
- Table 15: Global Magnetic Resonance Imaging Market in Australia Revenue Million Forecast, by Field Strength 2019 & 2032
- Table 16: Global Magnetic Resonance Imaging Market in Australia Revenue Million Forecast, by Application 2019 & 2032
- Table 17: Global Magnetic Resonance Imaging Market in Australia Revenue Million Forecast, by Country 2019 & 2032
- Table 18: Brazil Magnetic Resonance Imaging Market in Australia Revenue (Million) Forecast, by Application 2019 & 2032
- Table 19: Argentina Magnetic Resonance Imaging Market in Australia Revenue (Million) Forecast, by Application 2019 & 2032
- Table 20: Rest of South America Magnetic Resonance Imaging Market in Australia Revenue (Million) Forecast, by Application 2019 & 2032
- Table 21: Global Magnetic Resonance Imaging Market in Australia Revenue Million Forecast, by Architecture 2019 & 2032
- Table 22: Global Magnetic Resonance Imaging Market in Australia Revenue Million Forecast, by Field Strength 2019 & 2032
- Table 23: Global Magnetic Resonance Imaging Market in Australia Revenue Million Forecast, by Application 2019 & 2032
- Table 24: Global Magnetic Resonance Imaging Market in Australia Revenue Million Forecast, by Country 2019 & 2032
- Table 25: United Kingdom Magnetic Resonance Imaging Market in Australia Revenue (Million) Forecast, by Application 2019 & 2032
- Table 26: Germany Magnetic Resonance Imaging Market in Australia Revenue (Million) Forecast, by Application 2019 & 2032
- Table 27: France Magnetic Resonance Imaging Market in Australia Revenue (Million) Forecast, by Application 2019 & 2032
- Table 28: Italy Magnetic Resonance Imaging Market in Australia Revenue (Million) Forecast, by Application 2019 & 2032
- Table 29: Spain Magnetic Resonance Imaging Market in Australia Revenue (Million) Forecast, by Application 2019 & 2032
- Table 30: Russia Magnetic Resonance Imaging Market in Australia Revenue (Million) Forecast, by Application 2019 & 2032
- Table 31: Benelux Magnetic Resonance Imaging Market in Australia Revenue (Million) Forecast, by Application 2019 & 2032
- Table 32: Nordics Magnetic Resonance Imaging Market in Australia Revenue (Million) Forecast, by Application 2019 & 2032
- Table 33: Rest of Europe Magnetic Resonance Imaging Market in Australia Revenue (Million) Forecast, by Application 2019 & 2032
- Table 34: Global Magnetic Resonance Imaging Market in Australia Revenue Million Forecast, by Architecture 2019 & 2032
- Table 35: Global Magnetic Resonance Imaging Market in Australia Revenue Million Forecast, by Field Strength 2019 & 2032
- Table 36: Global Magnetic Resonance Imaging Market in Australia Revenue Million Forecast, by Application 2019 & 2032
- Table 37: Global Magnetic Resonance Imaging Market in Australia Revenue Million Forecast, by Country 2019 & 2032
- Table 38: Turkey Magnetic Resonance Imaging Market in Australia Revenue (Million) Forecast, by Application 2019 & 2032
- Table 39: Israel Magnetic Resonance Imaging Market in Australia Revenue (Million) Forecast, by Application 2019 & 2032
- Table 40: GCC Magnetic Resonance Imaging Market in Australia Revenue (Million) Forecast, by Application 2019 & 2032
- Table 41: North Africa Magnetic Resonance Imaging Market in Australia Revenue (Million) Forecast, by Application 2019 & 2032
- Table 42: South Africa Magnetic Resonance Imaging Market in Australia Revenue (Million) Forecast, by Application 2019 & 2032
- Table 43: Rest of Middle East & Africa Magnetic Resonance Imaging Market in Australia Revenue (Million) Forecast, by Application 2019 & 2032
- Table 44: Global Magnetic Resonance Imaging Market in Australia Revenue Million Forecast, by Architecture 2019 & 2032
- Table 45: Global Magnetic Resonance Imaging Market in Australia Revenue Million Forecast, by Field Strength 2019 & 2032
- Table 46: Global Magnetic Resonance Imaging Market in Australia Revenue Million Forecast, by Application 2019 & 2032
- Table 47: Global Magnetic Resonance Imaging Market in Australia Revenue Million Forecast, by Country 2019 & 2032
- Table 48: China Magnetic Resonance Imaging Market in Australia Revenue (Million) Forecast, by Application 2019 & 2032
- Table 49: India Magnetic Resonance Imaging Market in Australia Revenue (Million) Forecast, by Application 2019 & 2032
- Table 50: Japan Magnetic Resonance Imaging Market in Australia Revenue (Million) Forecast, by Application 2019 & 2032
- Table 51: South Korea Magnetic Resonance Imaging Market in Australia Revenue (Million) Forecast, by Application 2019 & 2032
- Table 52: ASEAN Magnetic Resonance Imaging Market in Australia Revenue (Million) Forecast, by Application 2019 & 2032
- Table 53: Oceania Magnetic Resonance Imaging Market in Australia Revenue (Million) Forecast, by Application 2019 & 2032
- Table 54: Rest of Asia Pacific Magnetic Resonance Imaging Market in Australia Revenue (Million) Forecast, by Application 2019 & 2032
Frequently Asked Questions
1. What is the projected Compound Annual Growth Rate (CAGR) of the Magnetic Resonance Imaging Market in Australia?
The projected CAGR is approximately 5.82%.
2. Which companies are prominent players in the Magnetic Resonance Imaging Market in Australia?
Key companies in the market include Esaote SpA, Siemens Healthineers, GE Healthcare, Koninklijke Philips NV, Canon Medical Systems Corporation, Sonologic Inc, United Imaging Healthcare Co Ltd, Fujifilm Holdings Corporation.
3. What are the main segments of the Magnetic Resonance Imaging Market in Australia?
The market segments include Architecture, Field Strength, Application.
4. Can you provide details about the market size?
The market size is estimated to be USD 104.17 Million as of 2022.
5. What are some drivers contributing to market growth?
Introduction of Hybrid MRI Systems; Availability of Universal Health Coverage.
6. What are the notable trends driving market growth?
Neurology is Expected to Witness Steady Growth Over the Forecast Period.
7. Are there any restraints impacting market growth?
High Cost of MRI Systems.
8. Can you provide examples of recent developments in the market?
In March 2022, Siemens MRI Scanner was installed at North Eastern Community Hospital in the Benson Radiology department in South Australia.
9. What pricing options are available for accessing the report?
Pricing options include single-user, multi-user, and enterprise licenses priced at USD 3800, USD 4500, and USD 5800 respectively.
10. Is the market size provided in terms of value or volume?
The market size is provided in terms of value, measured in Million.
11. Are there any specific market keywords associated with the report?
Yes, the market keyword associated with the report is "Magnetic Resonance Imaging Market in Australia," which aids in identifying and referencing the specific market segment covered.
12. How do I determine which pricing option suits my needs best?
The pricing options vary based on user requirements and access needs. Individual users may opt for single-user licenses, while businesses requiring broader access may choose multi-user or enterprise licenses for cost-effective access to the report.
13. Are there any additional resources or data provided in the Magnetic Resonance Imaging Market in Australia report?
While the report offers comprehensive insights, it's advisable to review the specific contents or supplementary materials provided to ascertain if additional resources or data are available.
14. How can I stay updated on further developments or reports in the Magnetic Resonance Imaging Market in Australia?
To stay informed about further developments, trends, and reports in the Magnetic Resonance Imaging Market in Australia, consider subscribing to industry newsletters, following relevant companies and organizations, or regularly checking reputable industry news sources and publications.
Methodology
Step 1 - Identification of Relevant Samples Size from Population Database


Step 2 - Approaches for Defining Global Market Size (Value, Volume* & Price*)

Note*: In applicable scenarios
Step 3 - Data Sources
Primary Research
- Web Analytics
- Survey Reports
- Research Institute
- Latest Research Reports
- Opinion Leaders
Secondary Research
- Annual Reports
- White Paper
- Latest Press Release
- Industry Association
- Paid Database
- Investor Presentations

Step 4 - Data Triangulation
Involves using different sources of information in order to increase the validity of a study
These sources are likely to be stakeholders in a program - participants, other researchers, program staff, other community members, and so on.
Then we put all data in single framework & apply various statistical tools to find out the dynamic on the market.
During the analysis stage, feedback from the stakeholder groups would be compared to determine areas of agreement as well as areas of divergence
