

Key Insights
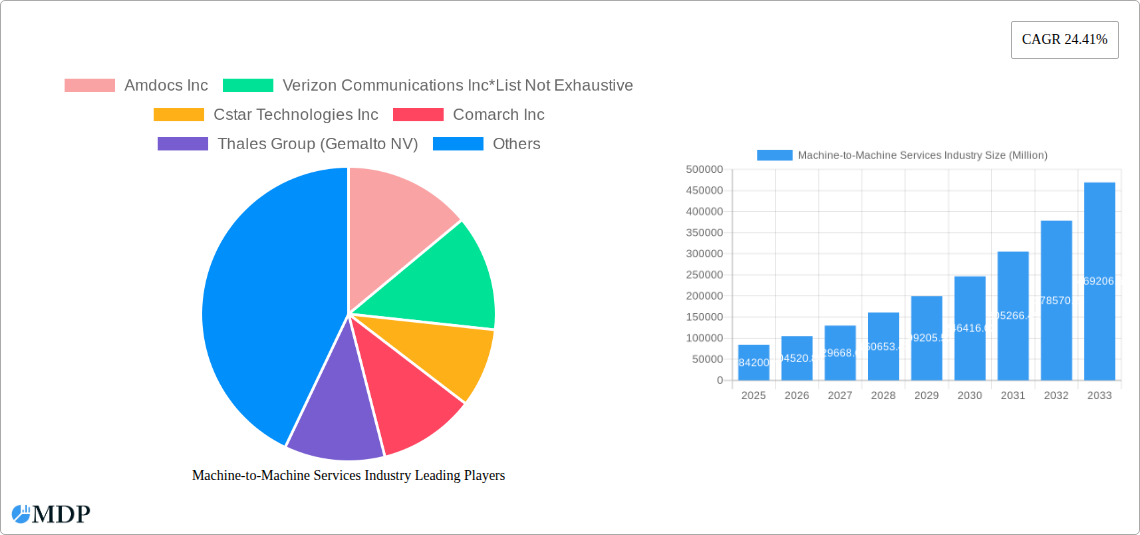
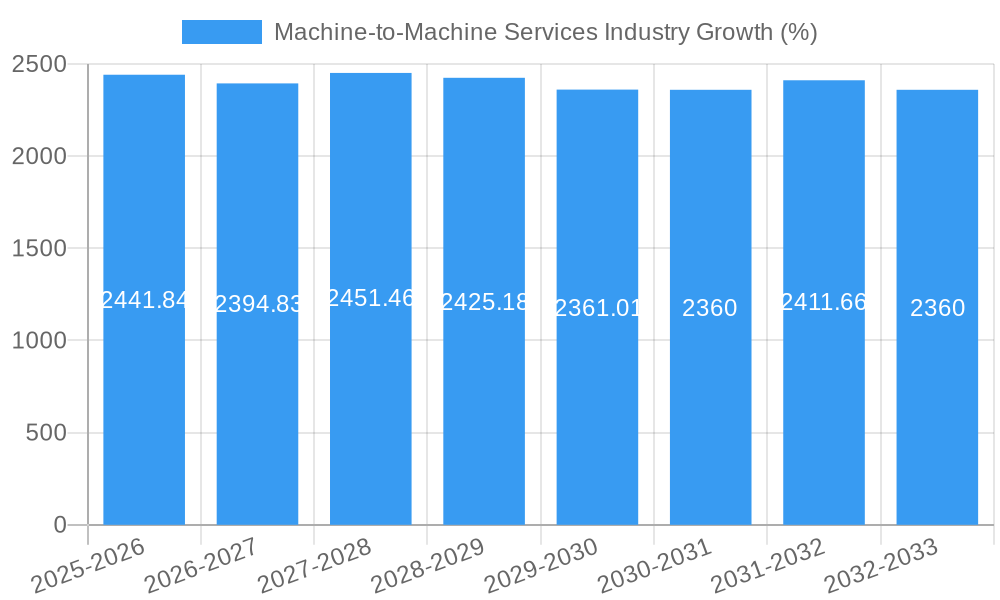
The Machine-to-Machine (M2M) services market is experiencing robust growth, projected to reach \$84.20 billion in 2025 and expanding at a Compound Annual Growth Rate (CAGR) of 24.41%. This significant expansion is driven by several key factors. The increasing adoption of IoT devices across diverse sectors like retail, banking, healthcare, and automotive is fueling the demand for reliable and efficient M2M communication solutions. Businesses are leveraging M2M technology to improve operational efficiency, enhance customer experience, and gain valuable real-time insights from connected devices. Furthermore, advancements in technologies like 5G and edge computing are enabling more sophisticated and scalable M2M applications, contributing to market growth. The market is segmented by service type (managed and professional services) and end-user industry, with each sector exhibiting unique growth trajectories. North America and Europe currently hold significant market share, but the Asia-Pacific region is anticipated to experience substantial growth in the coming years, driven by increasing digitalization and infrastructure development. While challenges such as data security concerns and interoperability issues exist, ongoing technological innovation and increasing government support for IoT initiatives are mitigating these obstacles.
The competitive landscape is characterized by a mix of established telecommunication giants, technology providers, and specialized M2M solution vendors. Companies like Amdocs, Verizon, and Cisco are actively investing in developing and deploying advanced M2M solutions. The market is witnessing increasing consolidation, with strategic partnerships and acquisitions shaping the industry structure. The forecast period (2025-2033) promises sustained growth, driven by continued technological advancements, expanding IoT applications, and increasing demand for connected devices in various industries. The long-term outlook remains positive, underpinned by the transformative potential of M2M communication in enabling smart cities, industrial automation, and enhanced connectivity across various sectors. This growth is likely to be particularly pronounced in regions with rapidly developing digital infrastructure and a growing middle class with increased disposable income.
Machine-to-Machine (M2M) Services Market Report: 2019-2033
This comprehensive report provides a detailed analysis of the global Machine-to-Machine (M2M) Services market, offering invaluable insights for industry stakeholders, investors, and businesses seeking to navigate this rapidly evolving landscape. With a study period spanning 2019-2033, a base year of 2025, and a forecast period of 2025-2033, this report delivers a complete picture of past performance, current trends, and future projections, revealing lucrative opportunities and potential challenges. The report value is xx Million.
Machine-to-Machine Services Industry Market Dynamics & Concentration
The global M2M services market exhibits a moderately concentrated structure, with a handful of major players holding significant market share. However, the landscape is dynamic, fueled by continuous innovation, strategic mergers and acquisitions (M&A), and evolving regulatory frameworks. Market concentration is further influenced by the increasing adoption of IoT technologies across various industry verticals. The historical period (2019-2024) witnessed approximately xx M&A deals, contributing to market consolidation. The predicted market share for the top 5 players in 2025 is estimated at xx%.
- Innovation Drivers: Advancements in 5G, AI, and edge computing are key catalysts, enabling sophisticated M2M applications and improved network efficiency.
- Regulatory Frameworks: Government regulations related to data privacy, security, and network infrastructure significantly impact market growth and investment decisions.
- Product Substitutes: The emergence of alternative communication technologies and cloud-based solutions necessitates continuous innovation and adaptation.
- End-User Trends: The increasing demand for connected devices across various sectors, including automotive, healthcare, and industrial automation, drives substantial market growth.
- M&A Activities: Consolidation through M&A activities is a prominent trend, enhancing market concentration and fostering innovation.
Machine-to-Machine Services Industry Trends & Analysis
The M2M services market is characterized by robust growth, driven by the proliferation of IoT devices and the increasing digitization across diverse sectors. The market experienced a Compound Annual Growth Rate (CAGR) of xx% during the historical period (2019-2024) and is projected to maintain a CAGR of xx% during the forecast period (2025-2033). This growth is underpinned by several key factors:
- Technological Disruptions: 5G deployment, advancements in AI and machine learning, and the rise of edge computing are transforming the capabilities and applications of M2M services.
- Market Growth Drivers: The increasing demand for real-time data analysis, remote monitoring, and automation across various industries fuels market expansion.
- Consumer Preferences: Businesses are increasingly prioritizing efficient, secure, and scalable M2M solutions to enhance operational efficiency and reduce costs.
- Competitive Dynamics: Intense competition among established players and emerging entrants drives innovation and price optimization. Market penetration by 2025 is expected to reach xx%.
Leading Markets & Segments in Machine-to-Machine Services Industry
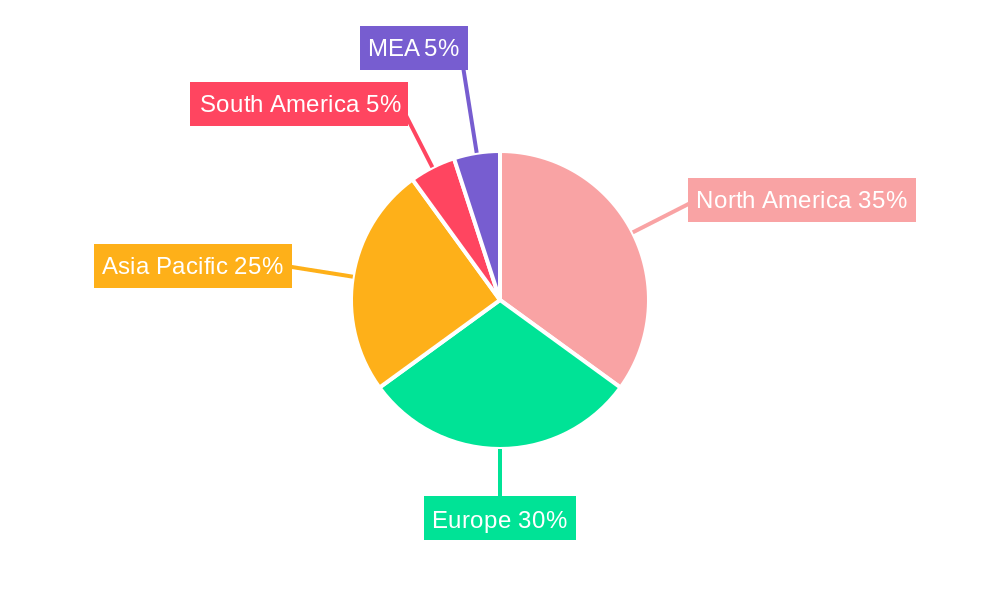
The North American region currently dominates the M2M services market, driven by factors such as robust technological infrastructure, high adoption of IoT devices, and substantial investments in digital transformation initiatives. The Telecom and IT industry segment exhibits the highest market share, followed by the Automotive and Healthcare sectors.
Key Drivers by Segment:
- By Type:
- Managed Services: High demand for outsourced M2M management solutions.
- Professional Services: Growing need for specialized expertise in M2M implementation and integration.
- By End User:
- Telecom and IT Industry: High adoption rates due to the intrinsic nature of their operations.
- Automotive: Increased use of connected car technology and autonomous vehicles.
- Healthcare: Remote patient monitoring, connected medical devices, and telemedicine solutions.
- Retail: Inventory management, supply chain optimization, and smart retail solutions.
- Banking and Financial Institution: Secure and reliable M2M connectivity for ATM networks and financial transactions.
- Oil and Gas: Remote monitoring of pipelines, equipment, and facilities.
- Transportation: Smart transportation systems and logistics optimization solutions.
Regional Dominance: North America's dominance is attributed to:
- Advanced technological infrastructure and high internet penetration.
- Early adoption of IoT technologies and strong government support for digital transformation.
- High spending capacity across various industry verticals.
Machine-to-Machine Services Industry Product Developments
Recent advancements in M2M services have focused on enhancing security, scalability, and interoperability. The integration of AI, machine learning, and cloud computing technologies is driving the development of intelligent M2M solutions capable of real-time data analysis and predictive maintenance. The market is witnessing a proliferation of embedded SIM (eSIM) technologies and Low Power Wide Area Networks (LPWANs) for enhanced connectivity and reduced power consumption. These developments enhance the market fit by catering to the growing demand for cost-effective, efficient, and secure M2M solutions.
Key Drivers of Machine-to-Machine Services Industry Growth
Several factors contribute to the sustained growth of the M2M services market:
- Technological advancements: 5G deployment, AI, and edge computing are pivotal in enabling new M2M applications and improving network efficiency.
- Increasing IoT adoption: The rising adoption of connected devices across various industries fuels the demand for M2M services.
- Government initiatives and supportive regulatory frameworks: Many governments promote digitalization and the use of IoT technology.
Challenges in the Machine-to-Machine Services Industry Market
The M2M services market faces several challenges:
- Security concerns: The increasing number of connected devices elevates security risks, requiring robust security measures.
- Data privacy regulations: Stringent data privacy regulations necessitate compliance efforts.
- Interoperability issues: Ensuring seamless communication between various devices and platforms remains a challenge.
Emerging Opportunities in Machine-to-Machine Services Industry
The future of M2M services holds immense potential, driven by:
- The expansion of 5G networks and increased IoT device connectivity.
- The development of advanced analytics and AI-powered solutions enabling enhanced data insights and automation.
- Strategic collaborations between technology providers and industry verticals to create tailored M2M solutions.
Leading Players in the Machine-to-Machine Services Industry Sector
- Amdocs Inc
- Verizon Communications Inc
- Cstar Technologies Inc
- Comarch Inc
- Thales Group (Gemalto NV)
- Huawei Technologies Co Ltd
- Rogers Communications Inc
- Cisco System Inc
- International Business Machine Corporation
- Nokia Corp (Alcatel-Lucent S A )
- EE Ltd
- Intel Corporation
Key Milestones in Machine-to-Machine Services Industry Industry
- November 2023: Ericsson launched an intelligent, cloud-native transport controller using AI and machine learning for optimized mobile transport networks. This significantly improves network efficiency for CSPs.
- February 2023: A5G Networks partnered with Intel® Smart Edge, providing a user-friendly edge computing platform for deploying edge networks and multi-access edge computing (MEC). This simplifies edge computing adoption.
- June 2022: STMicroelectronics launched the ST4SIM-201 eSIM for M2M communication, compliant with 5G standards and offering flexible remote provisioning. This boosts 5G M2M adoption.
- June 2022: M2M Germany collaborated with Wattsense, expanding its services for building digitization using IoT sensor networks and M2M communication. This demonstrates the growth of M2M in smart buildings.
Strategic Outlook for Machine-to-Machine Services Industry Market
The M2M services market is poised for substantial growth, driven by the convergence of technological advancements, increasing IoT adoption, and the expanding digitalization across various industry sectors. Strategic partnerships, focused investments in R&D, and expansion into emerging markets present lucrative opportunities for market players. The focus on AI-powered solutions and enhanced security features will be crucial for sustained growth and market leadership.
Machine-to-Machine Services Industry Segmentation
-
1. Type
- 1.1. Managed Service
- 1.2. Professional Service
-
2. End User
- 2.1. Retail
- 2.2. Banking and Financial Institution
- 2.3. Telecom and IT Industry
- 2.4. Healthcare
- 2.5. Automotive
- 2.6. Oil and Gas
- 2.7. Transportation
Machine-to-Machine Services Industry Segmentation By Geography
- 1. North America
- 2. Europe
- 3. Asia Pacific
- 4. Latin America
- 5. Middle East
Machine-to-Machine Services Industry REPORT HIGHLIGHTS
| Aspects | Details |
|---|---|
| Study Period | 2019-2033 |
| Base Year | 2024 |
| Estimated Year | 2025 |
| Forecast Period | 2025-2033 |
| Historical Period | 2019-2024 |
| Growth Rate | CAGR of 24.41% from 2019-2033 |
| Segmentation |
|
Table of Contents
- 1. Introduction
- 1.1. Research Scope
- 1.2. Market Segmentation
- 1.3. Research Methodology
- 1.4. Definitions and Assumptions
- 2. Executive Summary
- 2.1. Introduction
- 3. Market Dynamics
- 3.1. Introduction
- 3.2. Market Drivers
- 3.2.1. Rapid Technological Advancements; Increasing Number of Connected Devices
- 3.3. Market Restrains
- 3.3.1. Lack of Standardization; Huge Delivery Cost
- 3.4. Market Trends
- 3.4.1. Telecom Industry to Witness Significant Growth Among Other End-user Verticals
- 4. Market Factor Analysis
- 4.1. Porters Five Forces
- 4.2. Supply/Value Chain
- 4.3. PESTEL analysis
- 4.4. Market Entropy
- 4.5. Patent/Trademark Analysis
- 5. Global Machine-to-Machine Services Industry Analysis, Insights and Forecast, 2019-2031
- 5.1. Market Analysis, Insights and Forecast - by Type
- 5.1.1. Managed Service
- 5.1.2. Professional Service
- 5.2. Market Analysis, Insights and Forecast - by End User
- 5.2.1. Retail
- 5.2.2. Banking and Financial Institution
- 5.2.3. Telecom and IT Industry
- 5.2.4. Healthcare
- 5.2.5. Automotive
- 5.2.6. Oil and Gas
- 5.2.7. Transportation
- 5.3. Market Analysis, Insights and Forecast - by Region
- 5.3.1. North America
- 5.3.2. Europe
- 5.3.3. Asia Pacific
- 5.3.4. Latin America
- 5.3.5. Middle East
- 5.1. Market Analysis, Insights and Forecast - by Type
- 6. North America Machine-to-Machine Services Industry Analysis, Insights and Forecast, 2019-2031
- 6.1. Market Analysis, Insights and Forecast - by Type
- 6.1.1. Managed Service
- 6.1.2. Professional Service
- 6.2. Market Analysis, Insights and Forecast - by End User
- 6.2.1. Retail
- 6.2.2. Banking and Financial Institution
- 6.2.3. Telecom and IT Industry
- 6.2.4. Healthcare
- 6.2.5. Automotive
- 6.2.6. Oil and Gas
- 6.2.7. Transportation
- 6.1. Market Analysis, Insights and Forecast - by Type
- 7. Europe Machine-to-Machine Services Industry Analysis, Insights and Forecast, 2019-2031
- 7.1. Market Analysis, Insights and Forecast - by Type
- 7.1.1. Managed Service
- 7.1.2. Professional Service
- 7.2. Market Analysis, Insights and Forecast - by End User
- 7.2.1. Retail
- 7.2.2. Banking and Financial Institution
- 7.2.3. Telecom and IT Industry
- 7.2.4. Healthcare
- 7.2.5. Automotive
- 7.2.6. Oil and Gas
- 7.2.7. Transportation
- 7.1. Market Analysis, Insights and Forecast - by Type
- 8. Asia Pacific Machine-to-Machine Services Industry Analysis, Insights and Forecast, 2019-2031
- 8.1. Market Analysis, Insights and Forecast - by Type
- 8.1.1. Managed Service
- 8.1.2. Professional Service
- 8.2. Market Analysis, Insights and Forecast - by End User
- 8.2.1. Retail
- 8.2.2. Banking and Financial Institution
- 8.2.3. Telecom and IT Industry
- 8.2.4. Healthcare
- 8.2.5. Automotive
- 8.2.6. Oil and Gas
- 8.2.7. Transportation
- 8.1. Market Analysis, Insights and Forecast - by Type
- 9. Latin America Machine-to-Machine Services Industry Analysis, Insights and Forecast, 2019-2031
- 9.1. Market Analysis, Insights and Forecast - by Type
- 9.1.1. Managed Service
- 9.1.2. Professional Service
- 9.2. Market Analysis, Insights and Forecast - by End User
- 9.2.1. Retail
- 9.2.2. Banking and Financial Institution
- 9.2.3. Telecom and IT Industry
- 9.2.4. Healthcare
- 9.2.5. Automotive
- 9.2.6. Oil and Gas
- 9.2.7. Transportation
- 9.1. Market Analysis, Insights and Forecast - by Type
- 10. Middle East Machine-to-Machine Services Industry Analysis, Insights and Forecast, 2019-2031
- 10.1. Market Analysis, Insights and Forecast - by Type
- 10.1.1. Managed Service
- 10.1.2. Professional Service
- 10.2. Market Analysis, Insights and Forecast - by End User
- 10.2.1. Retail
- 10.2.2. Banking and Financial Institution
- 10.2.3. Telecom and IT Industry
- 10.2.4. Healthcare
- 10.2.5. Automotive
- 10.2.6. Oil and Gas
- 10.2.7. Transportation
- 10.1. Market Analysis, Insights and Forecast - by Type
- 11. North America Machine-to-Machine Services Industry Analysis, Insights and Forecast, 2019-2031
- 11.1. Market Analysis, Insights and Forecast - By Country/Sub-region
- 11.1.1 United States
- 11.1.2 Canada
- 11.1.3 Mexico
- 12. Europe Machine-to-Machine Services Industry Analysis, Insights and Forecast, 2019-2031
- 12.1. Market Analysis, Insights and Forecast - By Country/Sub-region
- 12.1.1 Germany
- 12.1.2 United Kingdom
- 12.1.3 France
- 12.1.4 Spain
- 12.1.5 Italy
- 12.1.6 Spain
- 12.1.7 Belgium
- 12.1.8 Netherland
- 12.1.9 Nordics
- 12.1.10 Rest of Europe
- 13. Asia Pacific Machine-to-Machine Services Industry Analysis, Insights and Forecast, 2019-2031
- 13.1. Market Analysis, Insights and Forecast - By Country/Sub-region
- 13.1.1 China
- 13.1.2 Japan
- 13.1.3 India
- 13.1.4 South Korea
- 13.1.5 Southeast Asia
- 13.1.6 Australia
- 13.1.7 Indonesia
- 13.1.8 Phillipes
- 13.1.9 Singapore
- 13.1.10 Thailandc
- 13.1.11 Rest of Asia Pacific
- 14. South America Machine-to-Machine Services Industry Analysis, Insights and Forecast, 2019-2031
- 14.1. Market Analysis, Insights and Forecast - By Country/Sub-region
- 14.1.1 Brazil
- 14.1.2 Argentina
- 14.1.3 Peru
- 14.1.4 Chile
- 14.1.5 Colombia
- 14.1.6 Ecuador
- 14.1.7 Venezuela
- 14.1.8 Rest of South America
- 15. North America Machine-to-Machine Services Industry Analysis, Insights and Forecast, 2019-2031
- 15.1. Market Analysis, Insights and Forecast - By Country/Sub-region
- 15.1.1 United States
- 15.1.2 Canada
- 15.1.3 Mexico
- 16. MEA Machine-to-Machine Services Industry Analysis, Insights and Forecast, 2019-2031
- 16.1. Market Analysis, Insights and Forecast - By Country/Sub-region
- 16.1.1 United Arab Emirates
- 16.1.2 Saudi Arabia
- 16.1.3 South Africa
- 16.1.4 Rest of Middle East and Africa
- 17. Competitive Analysis
- 17.1. Global Market Share Analysis 2024
- 17.2. Company Profiles
- 17.2.1 Amdocs Inc
- 17.2.1.1. Overview
- 17.2.1.2. Products
- 17.2.1.3. SWOT Analysis
- 17.2.1.4. Recent Developments
- 17.2.1.5. Financials (Based on Availability)
- 17.2.2 Verizon Communications Inc*List Not Exhaustive
- 17.2.2.1. Overview
- 17.2.2.2. Products
- 17.2.2.3. SWOT Analysis
- 17.2.2.4. Recent Developments
- 17.2.2.5. Financials (Based on Availability)
- 17.2.3 Cstar Technologies Inc
- 17.2.3.1. Overview
- 17.2.3.2. Products
- 17.2.3.3. SWOT Analysis
- 17.2.3.4. Recent Developments
- 17.2.3.5. Financials (Based on Availability)
- 17.2.4 Comarch Inc
- 17.2.4.1. Overview
- 17.2.4.2. Products
- 17.2.4.3. SWOT Analysis
- 17.2.4.4. Recent Developments
- 17.2.4.5. Financials (Based on Availability)
- 17.2.5 Thales Group (Gemalto NV)
- 17.2.5.1. Overview
- 17.2.5.2. Products
- 17.2.5.3. SWOT Analysis
- 17.2.5.4. Recent Developments
- 17.2.5.5. Financials (Based on Availability)
- 17.2.6 Huawei Technologies Co Ltd
- 17.2.6.1. Overview
- 17.2.6.2. Products
- 17.2.6.3. SWOT Analysis
- 17.2.6.4. Recent Developments
- 17.2.6.5. Financials (Based on Availability)
- 17.2.7 Rogers Communications Inc
- 17.2.7.1. Overview
- 17.2.7.2. Products
- 17.2.7.3. SWOT Analysis
- 17.2.7.4. Recent Developments
- 17.2.7.5. Financials (Based on Availability)
- 17.2.8 Cisco System Inc
- 17.2.8.1. Overview
- 17.2.8.2. Products
- 17.2.8.3. SWOT Analysis
- 17.2.8.4. Recent Developments
- 17.2.8.5. Financials (Based on Availability)
- 17.2.9 International Business Machine Corporation
- 17.2.9.1. Overview
- 17.2.9.2. Products
- 17.2.9.3. SWOT Analysis
- 17.2.9.4. Recent Developments
- 17.2.9.5. Financials (Based on Availability)
- 17.2.10 Nokia Corp (Alcatel-Lucent S A )
- 17.2.10.1. Overview
- 17.2.10.2. Products
- 17.2.10.3. SWOT Analysis
- 17.2.10.4. Recent Developments
- 17.2.10.5. Financials (Based on Availability)
- 17.2.11 EE Ltd
- 17.2.11.1. Overview
- 17.2.11.2. Products
- 17.2.11.3. SWOT Analysis
- 17.2.11.4. Recent Developments
- 17.2.11.5. Financials (Based on Availability)
- 17.2.12 Intel Corporation
- 17.2.12.1. Overview
- 17.2.12.2. Products
- 17.2.12.3. SWOT Analysis
- 17.2.12.4. Recent Developments
- 17.2.12.5. Financials (Based on Availability)
- 17.2.1 Amdocs Inc
List of Figures
- Figure 1: Global Machine-to-Machine Services Industry Revenue Breakdown (Million, %) by Region 2024 & 2032
- Figure 2: North America Machine-to-Machine Services Industry Revenue (Million), by Country 2024 & 2032
- Figure 3: North America Machine-to-Machine Services Industry Revenue Share (%), by Country 2024 & 2032
- Figure 4: Europe Machine-to-Machine Services Industry Revenue (Million), by Country 2024 & 2032
- Figure 5: Europe Machine-to-Machine Services Industry Revenue Share (%), by Country 2024 & 2032
- Figure 6: Asia Pacific Machine-to-Machine Services Industry Revenue (Million), by Country 2024 & 2032
- Figure 7: Asia Pacific Machine-to-Machine Services Industry Revenue Share (%), by Country 2024 & 2032
- Figure 8: South America Machine-to-Machine Services Industry Revenue (Million), by Country 2024 & 2032
- Figure 9: South America Machine-to-Machine Services Industry Revenue Share (%), by Country 2024 & 2032
- Figure 10: North America Machine-to-Machine Services Industry Revenue (Million), by Country 2024 & 2032
- Figure 11: North America Machine-to-Machine Services Industry Revenue Share (%), by Country 2024 & 2032
- Figure 12: MEA Machine-to-Machine Services Industry Revenue (Million), by Country 2024 & 2032
- Figure 13: MEA Machine-to-Machine Services Industry Revenue Share (%), by Country 2024 & 2032
- Figure 14: North America Machine-to-Machine Services Industry Revenue (Million), by Type 2024 & 2032
- Figure 15: North America Machine-to-Machine Services Industry Revenue Share (%), by Type 2024 & 2032
- Figure 16: North America Machine-to-Machine Services Industry Revenue (Million), by End User 2024 & 2032
- Figure 17: North America Machine-to-Machine Services Industry Revenue Share (%), by End User 2024 & 2032
- Figure 18: North America Machine-to-Machine Services Industry Revenue (Million), by Country 2024 & 2032
- Figure 19: North America Machine-to-Machine Services Industry Revenue Share (%), by Country 2024 & 2032
- Figure 20: Europe Machine-to-Machine Services Industry Revenue (Million), by Type 2024 & 2032
- Figure 21: Europe Machine-to-Machine Services Industry Revenue Share (%), by Type 2024 & 2032
- Figure 22: Europe Machine-to-Machine Services Industry Revenue (Million), by End User 2024 & 2032
- Figure 23: Europe Machine-to-Machine Services Industry Revenue Share (%), by End User 2024 & 2032
- Figure 24: Europe Machine-to-Machine Services Industry Revenue (Million), by Country 2024 & 2032
- Figure 25: Europe Machine-to-Machine Services Industry Revenue Share (%), by Country 2024 & 2032
- Figure 26: Asia Pacific Machine-to-Machine Services Industry Revenue (Million), by Type 2024 & 2032
- Figure 27: Asia Pacific Machine-to-Machine Services Industry Revenue Share (%), by Type 2024 & 2032
- Figure 28: Asia Pacific Machine-to-Machine Services Industry Revenue (Million), by End User 2024 & 2032
- Figure 29: Asia Pacific Machine-to-Machine Services Industry Revenue Share (%), by End User 2024 & 2032
- Figure 30: Asia Pacific Machine-to-Machine Services Industry Revenue (Million), by Country 2024 & 2032
- Figure 31: Asia Pacific Machine-to-Machine Services Industry Revenue Share (%), by Country 2024 & 2032
- Figure 32: Latin America Machine-to-Machine Services Industry Revenue (Million), by Type 2024 & 2032
- Figure 33: Latin America Machine-to-Machine Services Industry Revenue Share (%), by Type 2024 & 2032
- Figure 34: Latin America Machine-to-Machine Services Industry Revenue (Million), by End User 2024 & 2032
- Figure 35: Latin America Machine-to-Machine Services Industry Revenue Share (%), by End User 2024 & 2032
- Figure 36: Latin America Machine-to-Machine Services Industry Revenue (Million), by Country 2024 & 2032
- Figure 37: Latin America Machine-to-Machine Services Industry Revenue Share (%), by Country 2024 & 2032
- Figure 38: Middle East Machine-to-Machine Services Industry Revenue (Million), by Type 2024 & 2032
- Figure 39: Middle East Machine-to-Machine Services Industry Revenue Share (%), by Type 2024 & 2032
- Figure 40: Middle East Machine-to-Machine Services Industry Revenue (Million), by End User 2024 & 2032
- Figure 41: Middle East Machine-to-Machine Services Industry Revenue Share (%), by End User 2024 & 2032
- Figure 42: Middle East Machine-to-Machine Services Industry Revenue (Million), by Country 2024 & 2032
- Figure 43: Middle East Machine-to-Machine Services Industry Revenue Share (%), by Country 2024 & 2032
List of Tables
- Table 1: Global Machine-to-Machine Services Industry Revenue Million Forecast, by Region 2019 & 2032
- Table 2: Global Machine-to-Machine Services Industry Revenue Million Forecast, by Type 2019 & 2032
- Table 3: Global Machine-to-Machine Services Industry Revenue Million Forecast, by End User 2019 & 2032
- Table 4: Global Machine-to-Machine Services Industry Revenue Million Forecast, by Region 2019 & 2032
- Table 5: Global Machine-to-Machine Services Industry Revenue Million Forecast, by Country 2019 & 2032
- Table 6: United States Machine-to-Machine Services Industry Revenue (Million) Forecast, by Application 2019 & 2032
- Table 7: Canada Machine-to-Machine Services Industry Revenue (Million) Forecast, by Application 2019 & 2032
- Table 8: Mexico Machine-to-Machine Services Industry Revenue (Million) Forecast, by Application 2019 & 2032
- Table 9: Global Machine-to-Machine Services Industry Revenue Million Forecast, by Country 2019 & 2032
- Table 10: Germany Machine-to-Machine Services Industry Revenue (Million) Forecast, by Application 2019 & 2032
- Table 11: United Kingdom Machine-to-Machine Services Industry Revenue (Million) Forecast, by Application 2019 & 2032
- Table 12: France Machine-to-Machine Services Industry Revenue (Million) Forecast, by Application 2019 & 2032
- Table 13: Spain Machine-to-Machine Services Industry Revenue (Million) Forecast, by Application 2019 & 2032
- Table 14: Italy Machine-to-Machine Services Industry Revenue (Million) Forecast, by Application 2019 & 2032
- Table 15: Spain Machine-to-Machine Services Industry Revenue (Million) Forecast, by Application 2019 & 2032
- Table 16: Belgium Machine-to-Machine Services Industry Revenue (Million) Forecast, by Application 2019 & 2032
- Table 17: Netherland Machine-to-Machine Services Industry Revenue (Million) Forecast, by Application 2019 & 2032
- Table 18: Nordics Machine-to-Machine Services Industry Revenue (Million) Forecast, by Application 2019 & 2032
- Table 19: Rest of Europe Machine-to-Machine Services Industry Revenue (Million) Forecast, by Application 2019 & 2032
- Table 20: Global Machine-to-Machine Services Industry Revenue Million Forecast, by Country 2019 & 2032
- Table 21: China Machine-to-Machine Services Industry Revenue (Million) Forecast, by Application 2019 & 2032
- Table 22: Japan Machine-to-Machine Services Industry Revenue (Million) Forecast, by Application 2019 & 2032
- Table 23: India Machine-to-Machine Services Industry Revenue (Million) Forecast, by Application 2019 & 2032
- Table 24: South Korea Machine-to-Machine Services Industry Revenue (Million) Forecast, by Application 2019 & 2032
- Table 25: Southeast Asia Machine-to-Machine Services Industry Revenue (Million) Forecast, by Application 2019 & 2032
- Table 26: Australia Machine-to-Machine Services Industry Revenue (Million) Forecast, by Application 2019 & 2032
- Table 27: Indonesia Machine-to-Machine Services Industry Revenue (Million) Forecast, by Application 2019 & 2032
- Table 28: Phillipes Machine-to-Machine Services Industry Revenue (Million) Forecast, by Application 2019 & 2032
- Table 29: Singapore Machine-to-Machine Services Industry Revenue (Million) Forecast, by Application 2019 & 2032
- Table 30: Thailandc Machine-to-Machine Services Industry Revenue (Million) Forecast, by Application 2019 & 2032
- Table 31: Rest of Asia Pacific Machine-to-Machine Services Industry Revenue (Million) Forecast, by Application 2019 & 2032
- Table 32: Global Machine-to-Machine Services Industry Revenue Million Forecast, by Country 2019 & 2032
- Table 33: Brazil Machine-to-Machine Services Industry Revenue (Million) Forecast, by Application 2019 & 2032
- Table 34: Argentina Machine-to-Machine Services Industry Revenue (Million) Forecast, by Application 2019 & 2032
- Table 35: Peru Machine-to-Machine Services Industry Revenue (Million) Forecast, by Application 2019 & 2032
- Table 36: Chile Machine-to-Machine Services Industry Revenue (Million) Forecast, by Application 2019 & 2032
- Table 37: Colombia Machine-to-Machine Services Industry Revenue (Million) Forecast, by Application 2019 & 2032
- Table 38: Ecuador Machine-to-Machine Services Industry Revenue (Million) Forecast, by Application 2019 & 2032
- Table 39: Venezuela Machine-to-Machine Services Industry Revenue (Million) Forecast, by Application 2019 & 2032
- Table 40: Rest of South America Machine-to-Machine Services Industry Revenue (Million) Forecast, by Application 2019 & 2032
- Table 41: Global Machine-to-Machine Services Industry Revenue Million Forecast, by Country 2019 & 2032
- Table 42: United States Machine-to-Machine Services Industry Revenue (Million) Forecast, by Application 2019 & 2032
- Table 43: Canada Machine-to-Machine Services Industry Revenue (Million) Forecast, by Application 2019 & 2032
- Table 44: Mexico Machine-to-Machine Services Industry Revenue (Million) Forecast, by Application 2019 & 2032
- Table 45: Global Machine-to-Machine Services Industry Revenue Million Forecast, by Country 2019 & 2032
- Table 46: United Arab Emirates Machine-to-Machine Services Industry Revenue (Million) Forecast, by Application 2019 & 2032
- Table 47: Saudi Arabia Machine-to-Machine Services Industry Revenue (Million) Forecast, by Application 2019 & 2032
- Table 48: South Africa Machine-to-Machine Services Industry Revenue (Million) Forecast, by Application 2019 & 2032
- Table 49: Rest of Middle East and Africa Machine-to-Machine Services Industry Revenue (Million) Forecast, by Application 2019 & 2032
- Table 50: Global Machine-to-Machine Services Industry Revenue Million Forecast, by Type 2019 & 2032
- Table 51: Global Machine-to-Machine Services Industry Revenue Million Forecast, by End User 2019 & 2032
- Table 52: Global Machine-to-Machine Services Industry Revenue Million Forecast, by Country 2019 & 2032
- Table 53: Global Machine-to-Machine Services Industry Revenue Million Forecast, by Type 2019 & 2032
- Table 54: Global Machine-to-Machine Services Industry Revenue Million Forecast, by End User 2019 & 2032
- Table 55: Global Machine-to-Machine Services Industry Revenue Million Forecast, by Country 2019 & 2032
- Table 56: Global Machine-to-Machine Services Industry Revenue Million Forecast, by Type 2019 & 2032
- Table 57: Global Machine-to-Machine Services Industry Revenue Million Forecast, by End User 2019 & 2032
- Table 58: Global Machine-to-Machine Services Industry Revenue Million Forecast, by Country 2019 & 2032
- Table 59: Global Machine-to-Machine Services Industry Revenue Million Forecast, by Type 2019 & 2032
- Table 60: Global Machine-to-Machine Services Industry Revenue Million Forecast, by End User 2019 & 2032
- Table 61: Global Machine-to-Machine Services Industry Revenue Million Forecast, by Country 2019 & 2032
- Table 62: Global Machine-to-Machine Services Industry Revenue Million Forecast, by Type 2019 & 2032
- Table 63: Global Machine-to-Machine Services Industry Revenue Million Forecast, by End User 2019 & 2032
- Table 64: Global Machine-to-Machine Services Industry Revenue Million Forecast, by Country 2019 & 2032
Frequently Asked Questions
1. What is the projected Compound Annual Growth Rate (CAGR) of the Machine-to-Machine Services Industry?
The projected CAGR is approximately 24.41%.
2. Which companies are prominent players in the Machine-to-Machine Services Industry?
Key companies in the market include Amdocs Inc, Verizon Communications Inc*List Not Exhaustive, Cstar Technologies Inc, Comarch Inc, Thales Group (Gemalto NV), Huawei Technologies Co Ltd, Rogers Communications Inc, Cisco System Inc, International Business Machine Corporation, Nokia Corp (Alcatel-Lucent S A ), EE Ltd, Intel Corporation.
3. What are the main segments of the Machine-to-Machine Services Industry?
The market segments include Type, End User.
4. Can you provide details about the market size?
The market size is estimated to be USD 84.20 Million as of 2022.
5. What are some drivers contributing to market growth?
Rapid Technological Advancements; Increasing Number of Connected Devices.
6. What are the notable trends driving market growth?
Telecom Industry to Witness Significant Growth Among Other End-user Verticals.
7. Are there any restraints impacting market growth?
Lack of Standardization; Huge Delivery Cost.
8. Can you provide examples of recent developments in the market?
November 2023 : Ericsson has launched an intelligent, cloud-native transport controller that uses artificial intelligence and machine learning to analyze and automate microwave, IP and optical networks, providing communications service providers (CSPs) with an advanced solution for maximizing mobile transport network efficiency.
9. What pricing options are available for accessing the report?
Pricing options include single-user, multi-user, and enterprise licenses priced at USD 4750, USD 5250, and USD 8750 respectively.
10. Is the market size provided in terms of value or volume?
The market size is provided in terms of value, measured in Million.
11. Are there any specific market keywords associated with the report?
Yes, the market keyword associated with the report is "Machine-to-Machine Services Industry," which aids in identifying and referencing the specific market segment covered.
12. How do I determine which pricing option suits my needs best?
The pricing options vary based on user requirements and access needs. Individual users may opt for single-user licenses, while businesses requiring broader access may choose multi-user or enterprise licenses for cost-effective access to the report.
13. Are there any additional resources or data provided in the Machine-to-Machine Services Industry report?
While the report offers comprehensive insights, it's advisable to review the specific contents or supplementary materials provided to ascertain if additional resources or data are available.
14. How can I stay updated on further developments or reports in the Machine-to-Machine Services Industry?
To stay informed about further developments, trends, and reports in the Machine-to-Machine Services Industry, consider subscribing to industry newsletters, following relevant companies and organizations, or regularly checking reputable industry news sources and publications.
Methodology
Step 1 - Identification of Relevant Samples Size from Population Database


Step 2 - Approaches for Defining Global Market Size (Value, Volume* & Price*)

Note*: In applicable scenarios
Step 3 - Data Sources
Primary Research
- Web Analytics
- Survey Reports
- Research Institute
- Latest Research Reports
- Opinion Leaders
Secondary Research
- Annual Reports
- White Paper
- Latest Press Release
- Industry Association
- Paid Database
- Investor Presentations

Step 4 - Data Triangulation
Involves using different sources of information in order to increase the validity of a study
These sources are likely to be stakeholders in a program - participants, other researchers, program staff, other community members, and so on.
Then we put all data in single framework & apply various statistical tools to find out the dynamic on the market.
During the analysis stage, feedback from the stakeholder groups would be compared to determine areas of agreement as well as areas of divergence
