

Key Insights
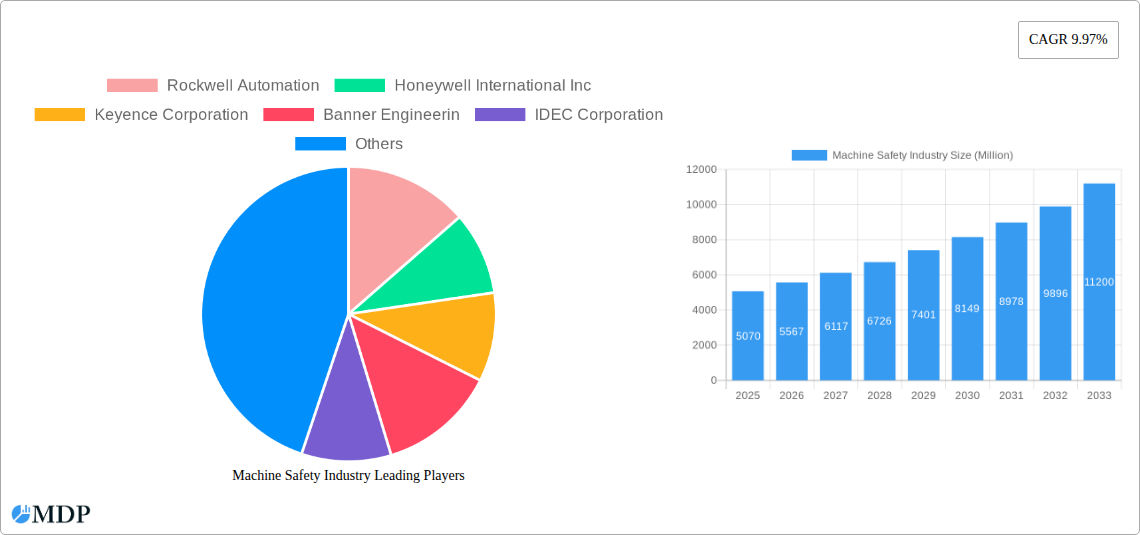
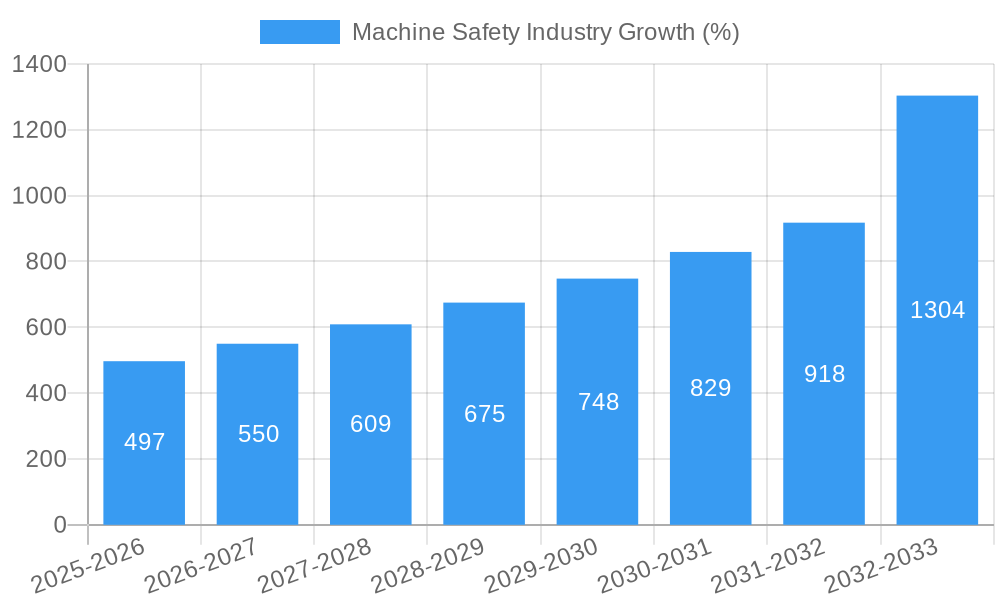
The global machine safety market, valued at $5.07 billion in 2025, is projected to experience robust growth, driven by increasing automation across industries and stringent safety regulations worldwide. The compound annual growth rate (CAGR) of 9.97% from 2025 to 2033 signifies a significant expansion in market size, reaching an estimated $11.2 billion by 2033. Key growth drivers include the rising adoption of Industry 4.0 technologies, the increasing demand for enhanced worker safety in manufacturing and industrial settings, and the growing awareness of potential liabilities associated with workplace accidents. The market is segmented by implementation (individual vs. embedded components) and by component type (presence sensing safety sensors, emergency stop devices, safety interlock switches, safety controllers/modules/relays, and other components). Significant end-user industries include electronics and semiconductors, oil and gas, healthcare, food and beverage, and automotive. While robust growth is anticipated, potential restraints include the high initial investment costs associated with implementing safety systems and the complexity of integrating these systems into existing infrastructure. However, the long-term benefits of improved safety, reduced downtime, and enhanced productivity are expected to outweigh these initial challenges, fostering continued market expansion.
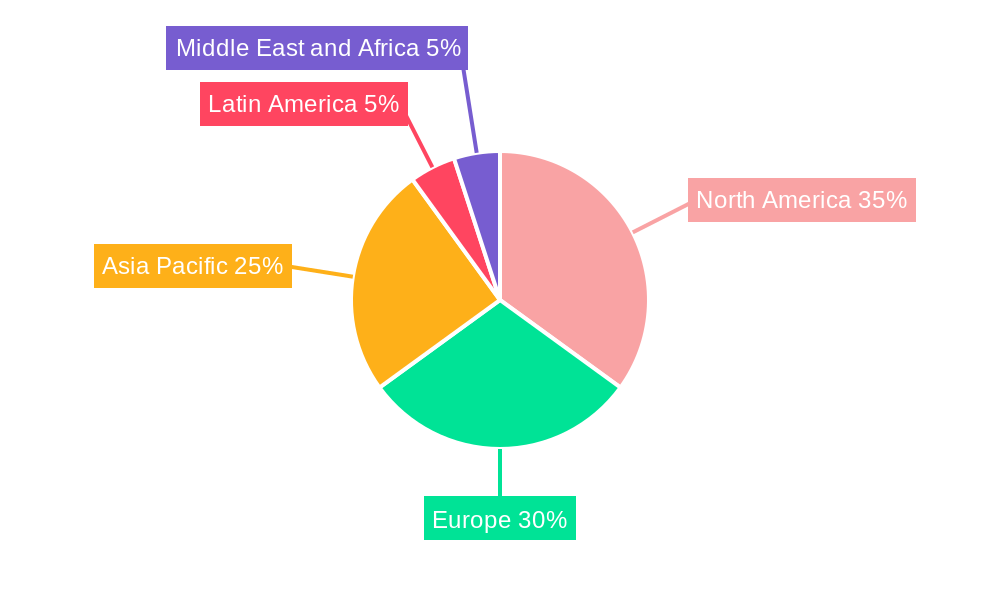
The geographical distribution of the market shows significant presence across North America, Europe, and Asia-Pacific, with North America currently holding a leading market share due to its advanced industrial infrastructure and stringent safety regulations. However, the Asia-Pacific region is expected to witness the fastest growth due to rapid industrialization and increasing adoption of automation technologies. Europe is also a mature market with substantial growth potential driven by a strong regulatory environment and focus on worker well-being. The competitive landscape is characterized by a mix of established global players and specialized regional companies, resulting in a dynamic and innovative market environment. Competition is primarily driven by technological advancements, product differentiation, and strategic partnerships to expand market reach and offer comprehensive safety solutions.
Machine Safety Industry Market Report: 2019-2033
This comprehensive report provides a detailed analysis of the global Machine Safety Industry market, offering invaluable insights for stakeholders seeking to navigate this crucial sector. With a study period spanning 2019-2033, a base year of 2025, and a forecast period of 2025-2033, this report leverages historical data (2019-2024) to predict future market trends. The market is valued at $XX Million in 2025 and is projected to reach $XX Million by 2033, exhibiting a robust CAGR of XX%. The report covers key segments, leading players, and emerging opportunities, ensuring a holistic understanding of this dynamic market.
Machine Safety Industry Market Dynamics & Concentration
The global machine safety industry is characterized by a moderately concentrated market structure, with several major players holding significant market share. Rockwell Automation, Honeywell International Inc., Keyence Corporation, and Siemens AG are among the leading companies, collectively accounting for an estimated XX% of the global market in 2025. The market’s dynamic nature is driven by several factors:
- Innovation Drivers: Continuous advancements in sensor technology, control systems, and safety software are propelling market growth. The development of sophisticated safety solutions catering to diverse industrial applications fuels demand.
- Regulatory Frameworks: Stringent safety regulations across various industries (e.g., automotive, food and beverage) are crucial drivers, mandating the implementation of advanced safety measures. Compliance requirements stimulate demand for advanced safety components.
- Product Substitutes: While the core function of machine safety remains consistent, technological advancements offer improved efficiency, cost-effectiveness, and integration with existing systems. The presence of substitute technologies introduces competition and fosters innovation.
- End-User Trends: The growing emphasis on workplace safety, coupled with increased automation and robotics across industries, fuels demand for robust safety systems. Industrial automation's expansion is a direct driver.
- M&A Activities: Mergers and acquisitions within the machine safety sector have been relatively frequent, indicating consolidation efforts and expansion strategies among industry players. The number of M&A deals recorded in the historical period (2019-2024) stands at approximately XX, indicating a trend of consolidation.
Machine Safety Industry Industry Trends & Analysis
The machine safety market is experiencing robust growth, driven by multiple factors. The increasing adoption of Industry 4.0 technologies, such as the Internet of Things (IoT) and artificial intelligence (AI), is creating new opportunities for advanced safety solutions. This trend reflects a shift toward more intelligent and interconnected safety systems, enabling predictive maintenance and real-time risk assessment. Consumer preferences increasingly prioritize safety and regulatory compliance, further driving demand. Competitive dynamics are characterized by continuous innovation, product differentiation, and strategic partnerships.
The market’s CAGR during the forecast period (2025-2033) is estimated at XX%, indicating significant growth potential. Market penetration across various industries is expected to increase, with the automotive and electronics sectors exhibiting particularly strong growth due to high automation levels and stringent safety standards.
Leading Markets & Segments in Machine Safety Industry
The North American region is expected to dominate the machine safety market throughout the forecast period due to strong regulatory compliance mandates and a high concentration of manufacturing industries. Within the market segments, the following show notable growth:
- Implementation: The embedded components segment is projected to dominate, fueled by the rising demand for integrated safety solutions in advanced machinery.
- Component: The presence sensing safety sensors segment is expected to lead, driven by the widespread need for real-time hazard detection.
- End-User: The automotive and electronics sectors are expected to demonstrate rapid growth due to significant automation and strict safety regulations.
Key Drivers in Dominant Regions:
- North America: Stringent safety regulations, advanced automation levels, and a large manufacturing base.
- Europe: Strong regulatory environment, significant investments in industrial automation, and growing focus on worker safety.
- Asia-Pacific: Rapid industrialization, increasing automation adoption, and a growing manufacturing sector.
Machine Safety Industry Product Developments
Recent product developments highlight a focus on advanced sensor technologies, improved connectivity, and enhanced integration capabilities. The introduction of smart sensors with predictive maintenance capabilities is gaining traction, while improved software integration streamlines safety system management. New safety controllers offer increased flexibility and customization, catering to diverse applications. These advancements enhance safety levels while simultaneously optimizing operational efficiency and cost-effectiveness.
Key Drivers of Machine Safety Industry Growth
Several factors contribute to the market's growth:
- Technological Advancements: Development of advanced sensors, AI-powered safety systems, and improved control technologies enhance safety and efficiency.
- Stringent Safety Regulations: Governments worldwide enforce stricter regulations, creating strong demand for sophisticated safety solutions.
- Rising Automation: The increasing adoption of automation in various industries drives the need for robust safety systems.
Challenges in the Machine Safety Industry Market
The market faces challenges:
- Regulatory Compliance: Meeting diverse and evolving safety regulations across various geographies adds complexity and cost.
- Supply Chain Disruptions: Global supply chain vulnerabilities can impact the availability and cost of critical components.
- Intense Competition: The market's competitive landscape necessitates continuous innovation and differentiation.
Emerging Opportunities in Machine Safety Industry
Emerging opportunities include:
- Integration with IoT and AI: Connecting safety systems with the IoT and AI enhances predictive maintenance and real-time risk assessment.
- Expansion into New Markets: Developing solutions for emerging industrial sectors offers significant growth potential.
- Strategic Partnerships: Collaborations between technology providers and end-users foster innovation and accelerate market penetration.
Leading Players in the Machine Safety Industry Sector
- Rockwell Automation
- Honeywell International Inc
- Keyence Corporation
- Banner Engineering
- IDEC Corporation
- Mitsubishi Electric Corporation
- Siemens AG
- Schneider Electric SE
- Omron Corporation
- Sick AG
- Pilz GmbH & Co KG
- ABB Limited
Key Milestones in Machine Safety Industry Industry
- October 2021: Pilz launched the PSENradar safe radar sensor, expanding capabilities for rugged conditions and robot applications.
- February 2021: ABB supplied a customized winder safety system to Oji Fibre Solutions, highlighting the importance of tailored solutions in specific industrial contexts.
Strategic Outlook for Machine Safety Industry Market
The machine safety market is poised for significant growth driven by technological innovation, increasing automation, and stringent safety regulations. Strategic opportunities exist for companies focusing on developing advanced safety solutions, expanding into new markets, and forging strategic partnerships to capitalize on the expanding market potential. The integration of AI and IoT is set to revolutionize the industry further, leading to more proactive and intelligent safety systems.
Machine Safety Industry Segmentation
-
1. Implementation
- 1.1. Individual Components
- 1.2. Embedded Components
-
2. Component
- 2.1. Presence Sensing Safety Sensors
- 2.2. Emergency Stop Devices
- 2.3. Safety Interlock Switches
- 2.4. Safety Controller/Modules/Relays
- 2.5. Other Components
-
3. End-User
- 3.1. Electronics and Semiconductors
- 3.2. Oil and Gas
- 3.3. Healthcare
- 3.4. Food and Beverage
- 3.5. Automotive
- 3.6. Other End-Users
Machine Safety Industry Segmentation By Geography
- 1. North America
- 2. Europe
- 3. Asia Pacific
- 4. Latin America
- 5. Middle East and Africa
Machine Safety Industry REPORT HIGHLIGHTS
| Aspects | Details |
|---|---|
| Study Period | 2019-2033 |
| Base Year | 2024 |
| Estimated Year | 2025 |
| Forecast Period | 2025-2033 |
| Historical Period | 2019-2024 |
| Growth Rate | CAGR of 9.97% from 2019-2033 |
| Segmentation |
|
Table of Contents
- 1. Introduction
- 1.1. Research Scope
- 1.2. Market Segmentation
- 1.3. Research Methodology
- 1.4. Definitions and Assumptions
- 2. Executive Summary
- 2.1. Introduction
- 3. Market Dynamics
- 3.1. Introduction
- 3.2. Market Drivers
- 3.2.1. Increasing Number of Industrial Accidents; Stringent Government Regulations and Mandatory Safety Standards
- 3.3. Market Restrains
- 3.3.1. Additional Costs Associated with Machine Safety Systems
- 3.4. Market Trends
- 3.4.1. Oil and Gas Industry to Hold a Significant Share
- 4. Market Factor Analysis
- 4.1. Porters Five Forces
- 4.2. Supply/Value Chain
- 4.3. PESTEL analysis
- 4.4. Market Entropy
- 4.5. Patent/Trademark Analysis
- 5. Global Machine Safety Industry Analysis, Insights and Forecast, 2019-2031
- 5.1. Market Analysis, Insights and Forecast - by Implementation
- 5.1.1. Individual Components
- 5.1.2. Embedded Components
- 5.2. Market Analysis, Insights and Forecast - by Component
- 5.2.1. Presence Sensing Safety Sensors
- 5.2.2. Emergency Stop Devices
- 5.2.3. Safety Interlock Switches
- 5.2.4. Safety Controller/Modules/Relays
- 5.2.5. Other Components
- 5.3. Market Analysis, Insights and Forecast - by End-User
- 5.3.1. Electronics and Semiconductors
- 5.3.2. Oil and Gas
- 5.3.3. Healthcare
- 5.3.4. Food and Beverage
- 5.3.5. Automotive
- 5.3.6. Other End-Users
- 5.4. Market Analysis, Insights and Forecast - by Region
- 5.4.1. North America
- 5.4.2. Europe
- 5.4.3. Asia Pacific
- 5.4.4. Latin America
- 5.4.5. Middle East and Africa
- 5.1. Market Analysis, Insights and Forecast - by Implementation
- 6. North America Machine Safety Industry Analysis, Insights and Forecast, 2019-2031
- 6.1. Market Analysis, Insights and Forecast - by Implementation
- 6.1.1. Individual Components
- 6.1.2. Embedded Components
- 6.2. Market Analysis, Insights and Forecast - by Component
- 6.2.1. Presence Sensing Safety Sensors
- 6.2.2. Emergency Stop Devices
- 6.2.3. Safety Interlock Switches
- 6.2.4. Safety Controller/Modules/Relays
- 6.2.5. Other Components
- 6.3. Market Analysis, Insights and Forecast - by End-User
- 6.3.1. Electronics and Semiconductors
- 6.3.2. Oil and Gas
- 6.3.3. Healthcare
- 6.3.4. Food and Beverage
- 6.3.5. Automotive
- 6.3.6. Other End-Users
- 6.1. Market Analysis, Insights and Forecast - by Implementation
- 7. Europe Machine Safety Industry Analysis, Insights and Forecast, 2019-2031
- 7.1. Market Analysis, Insights and Forecast - by Implementation
- 7.1.1. Individual Components
- 7.1.2. Embedded Components
- 7.2. Market Analysis, Insights and Forecast - by Component
- 7.2.1. Presence Sensing Safety Sensors
- 7.2.2. Emergency Stop Devices
- 7.2.3. Safety Interlock Switches
- 7.2.4. Safety Controller/Modules/Relays
- 7.2.5. Other Components
- 7.3. Market Analysis, Insights and Forecast - by End-User
- 7.3.1. Electronics and Semiconductors
- 7.3.2. Oil and Gas
- 7.3.3. Healthcare
- 7.3.4. Food and Beverage
- 7.3.5. Automotive
- 7.3.6. Other End-Users
- 7.1. Market Analysis, Insights and Forecast - by Implementation
- 8. Asia Pacific Machine Safety Industry Analysis, Insights and Forecast, 2019-2031
- 8.1. Market Analysis, Insights and Forecast - by Implementation
- 8.1.1. Individual Components
- 8.1.2. Embedded Components
- 8.2. Market Analysis, Insights and Forecast - by Component
- 8.2.1. Presence Sensing Safety Sensors
- 8.2.2. Emergency Stop Devices
- 8.2.3. Safety Interlock Switches
- 8.2.4. Safety Controller/Modules/Relays
- 8.2.5. Other Components
- 8.3. Market Analysis, Insights and Forecast - by End-User
- 8.3.1. Electronics and Semiconductors
- 8.3.2. Oil and Gas
- 8.3.3. Healthcare
- 8.3.4. Food and Beverage
- 8.3.5. Automotive
- 8.3.6. Other End-Users
- 8.1. Market Analysis, Insights and Forecast - by Implementation
- 9. Latin America Machine Safety Industry Analysis, Insights and Forecast, 2019-2031
- 9.1. Market Analysis, Insights and Forecast - by Implementation
- 9.1.1. Individual Components
- 9.1.2. Embedded Components
- 9.2. Market Analysis, Insights and Forecast - by Component
- 9.2.1. Presence Sensing Safety Sensors
- 9.2.2. Emergency Stop Devices
- 9.2.3. Safety Interlock Switches
- 9.2.4. Safety Controller/Modules/Relays
- 9.2.5. Other Components
- 9.3. Market Analysis, Insights and Forecast - by End-User
- 9.3.1. Electronics and Semiconductors
- 9.3.2. Oil and Gas
- 9.3.3. Healthcare
- 9.3.4. Food and Beverage
- 9.3.5. Automotive
- 9.3.6. Other End-Users
- 9.1. Market Analysis, Insights and Forecast - by Implementation
- 10. Middle East and Africa Machine Safety Industry Analysis, Insights and Forecast, 2019-2031
- 10.1. Market Analysis, Insights and Forecast - by Implementation
- 10.1.1. Individual Components
- 10.1.2. Embedded Components
- 10.2. Market Analysis, Insights and Forecast - by Component
- 10.2.1. Presence Sensing Safety Sensors
- 10.2.2. Emergency Stop Devices
- 10.2.3. Safety Interlock Switches
- 10.2.4. Safety Controller/Modules/Relays
- 10.2.5. Other Components
- 10.3. Market Analysis, Insights and Forecast - by End-User
- 10.3.1. Electronics and Semiconductors
- 10.3.2. Oil and Gas
- 10.3.3. Healthcare
- 10.3.4. Food and Beverage
- 10.3.5. Automotive
- 10.3.6. Other End-Users
- 10.1. Market Analysis, Insights and Forecast - by Implementation
- 11. North America Machine Safety Industry Analysis, Insights and Forecast, 2019-2031
- 11.1. Market Analysis, Insights and Forecast - By Country/Sub-region
- 11.1.1.
- 12. Europe Machine Safety Industry Analysis, Insights and Forecast, 2019-2031
- 12.1. Market Analysis, Insights and Forecast - By Country/Sub-region
- 12.1.1.
- 13. Asia Pacific Machine Safety Industry Analysis, Insights and Forecast, 2019-2031
- 13.1. Market Analysis, Insights and Forecast - By Country/Sub-region
- 13.1.1.
- 14. Latin America Machine Safety Industry Analysis, Insights and Forecast, 2019-2031
- 14.1. Market Analysis, Insights and Forecast - By Country/Sub-region
- 14.1.1.
- 15. Middle East and Africa Machine Safety Industry Analysis, Insights and Forecast, 2019-2031
- 15.1. Market Analysis, Insights and Forecast - By Country/Sub-region
- 15.1.1.
- 16. Competitive Analysis
- 16.1. Global Market Share Analysis 2024
- 16.2. Company Profiles
- 16.2.1 Rockwell Automation
- 16.2.1.1. Overview
- 16.2.1.2. Products
- 16.2.1.3. SWOT Analysis
- 16.2.1.4. Recent Developments
- 16.2.1.5. Financials (Based on Availability)
- 16.2.2 Honeywell International Inc
- 16.2.2.1. Overview
- 16.2.2.2. Products
- 16.2.2.3. SWOT Analysis
- 16.2.2.4. Recent Developments
- 16.2.2.5. Financials (Based on Availability)
- 16.2.3 Keyence Corporation
- 16.2.3.1. Overview
- 16.2.3.2. Products
- 16.2.3.3. SWOT Analysis
- 16.2.3.4. Recent Developments
- 16.2.3.5. Financials (Based on Availability)
- 16.2.4 Banner Engineerin
- 16.2.4.1. Overview
- 16.2.4.2. Products
- 16.2.4.3. SWOT Analysis
- 16.2.4.4. Recent Developments
- 16.2.4.5. Financials (Based on Availability)
- 16.2.5 IDEC Corporation
- 16.2.5.1. Overview
- 16.2.5.2. Products
- 16.2.5.3. SWOT Analysis
- 16.2.5.4. Recent Developments
- 16.2.5.5. Financials (Based on Availability)
- 16.2.6 Mitsubishi Electric Corporation
- 16.2.6.1. Overview
- 16.2.6.2. Products
- 16.2.6.3. SWOT Analysis
- 16.2.6.4. Recent Developments
- 16.2.6.5. Financials (Based on Availability)
- 16.2.7 Siemens AG
- 16.2.7.1. Overview
- 16.2.7.2. Products
- 16.2.7.3. SWOT Analysis
- 16.2.7.4. Recent Developments
- 16.2.7.5. Financials (Based on Availability)
- 16.2.8 Schneider Electric SE
- 16.2.8.1. Overview
- 16.2.8.2. Products
- 16.2.8.3. SWOT Analysis
- 16.2.8.4. Recent Developments
- 16.2.8.5. Financials (Based on Availability)
- 16.2.9 Omron Corporation
- 16.2.9.1. Overview
- 16.2.9.2. Products
- 16.2.9.3. SWOT Analysis
- 16.2.9.4. Recent Developments
- 16.2.9.5. Financials (Based on Availability)
- 16.2.10 Sick AG
- 16.2.10.1. Overview
- 16.2.10.2. Products
- 16.2.10.3. SWOT Analysis
- 16.2.10.4. Recent Developments
- 16.2.10.5. Financials (Based on Availability)
- 16.2.11 Pilz GmbH & Co KG
- 16.2.11.1. Overview
- 16.2.11.2. Products
- 16.2.11.3. SWOT Analysis
- 16.2.11.4. Recent Developments
- 16.2.11.5. Financials (Based on Availability)
- 16.2.12 ABB Limited
- 16.2.12.1. Overview
- 16.2.12.2. Products
- 16.2.12.3. SWOT Analysis
- 16.2.12.4. Recent Developments
- 16.2.12.5. Financials (Based on Availability)
- 16.2.1 Rockwell Automation
List of Figures
- Figure 1: Global Machine Safety Industry Revenue Breakdown (Million, %) by Region 2024 & 2032
- Figure 2: North America Machine Safety Industry Revenue (Million), by Country 2024 & 2032
- Figure 3: North America Machine Safety Industry Revenue Share (%), by Country 2024 & 2032
- Figure 4: Europe Machine Safety Industry Revenue (Million), by Country 2024 & 2032
- Figure 5: Europe Machine Safety Industry Revenue Share (%), by Country 2024 & 2032
- Figure 6: Asia Pacific Machine Safety Industry Revenue (Million), by Country 2024 & 2032
- Figure 7: Asia Pacific Machine Safety Industry Revenue Share (%), by Country 2024 & 2032
- Figure 8: Latin America Machine Safety Industry Revenue (Million), by Country 2024 & 2032
- Figure 9: Latin America Machine Safety Industry Revenue Share (%), by Country 2024 & 2032
- Figure 10: Middle East and Africa Machine Safety Industry Revenue (Million), by Country 2024 & 2032
- Figure 11: Middle East and Africa Machine Safety Industry Revenue Share (%), by Country 2024 & 2032
- Figure 12: North America Machine Safety Industry Revenue (Million), by Implementation 2024 & 2032
- Figure 13: North America Machine Safety Industry Revenue Share (%), by Implementation 2024 & 2032
- Figure 14: North America Machine Safety Industry Revenue (Million), by Component 2024 & 2032
- Figure 15: North America Machine Safety Industry Revenue Share (%), by Component 2024 & 2032
- Figure 16: North America Machine Safety Industry Revenue (Million), by End-User 2024 & 2032
- Figure 17: North America Machine Safety Industry Revenue Share (%), by End-User 2024 & 2032
- Figure 18: North America Machine Safety Industry Revenue (Million), by Country 2024 & 2032
- Figure 19: North America Machine Safety Industry Revenue Share (%), by Country 2024 & 2032
- Figure 20: Europe Machine Safety Industry Revenue (Million), by Implementation 2024 & 2032
- Figure 21: Europe Machine Safety Industry Revenue Share (%), by Implementation 2024 & 2032
- Figure 22: Europe Machine Safety Industry Revenue (Million), by Component 2024 & 2032
- Figure 23: Europe Machine Safety Industry Revenue Share (%), by Component 2024 & 2032
- Figure 24: Europe Machine Safety Industry Revenue (Million), by End-User 2024 & 2032
- Figure 25: Europe Machine Safety Industry Revenue Share (%), by End-User 2024 & 2032
- Figure 26: Europe Machine Safety Industry Revenue (Million), by Country 2024 & 2032
- Figure 27: Europe Machine Safety Industry Revenue Share (%), by Country 2024 & 2032
- Figure 28: Asia Pacific Machine Safety Industry Revenue (Million), by Implementation 2024 & 2032
- Figure 29: Asia Pacific Machine Safety Industry Revenue Share (%), by Implementation 2024 & 2032
- Figure 30: Asia Pacific Machine Safety Industry Revenue (Million), by Component 2024 & 2032
- Figure 31: Asia Pacific Machine Safety Industry Revenue Share (%), by Component 2024 & 2032
- Figure 32: Asia Pacific Machine Safety Industry Revenue (Million), by End-User 2024 & 2032
- Figure 33: Asia Pacific Machine Safety Industry Revenue Share (%), by End-User 2024 & 2032
- Figure 34: Asia Pacific Machine Safety Industry Revenue (Million), by Country 2024 & 2032
- Figure 35: Asia Pacific Machine Safety Industry Revenue Share (%), by Country 2024 & 2032
- Figure 36: Latin America Machine Safety Industry Revenue (Million), by Implementation 2024 & 2032
- Figure 37: Latin America Machine Safety Industry Revenue Share (%), by Implementation 2024 & 2032
- Figure 38: Latin America Machine Safety Industry Revenue (Million), by Component 2024 & 2032
- Figure 39: Latin America Machine Safety Industry Revenue Share (%), by Component 2024 & 2032
- Figure 40: Latin America Machine Safety Industry Revenue (Million), by End-User 2024 & 2032
- Figure 41: Latin America Machine Safety Industry Revenue Share (%), by End-User 2024 & 2032
- Figure 42: Latin America Machine Safety Industry Revenue (Million), by Country 2024 & 2032
- Figure 43: Latin America Machine Safety Industry Revenue Share (%), by Country 2024 & 2032
- Figure 44: Middle East and Africa Machine Safety Industry Revenue (Million), by Implementation 2024 & 2032
- Figure 45: Middle East and Africa Machine Safety Industry Revenue Share (%), by Implementation 2024 & 2032
- Figure 46: Middle East and Africa Machine Safety Industry Revenue (Million), by Component 2024 & 2032
- Figure 47: Middle East and Africa Machine Safety Industry Revenue Share (%), by Component 2024 & 2032
- Figure 48: Middle East and Africa Machine Safety Industry Revenue (Million), by End-User 2024 & 2032
- Figure 49: Middle East and Africa Machine Safety Industry Revenue Share (%), by End-User 2024 & 2032
- Figure 50: Middle East and Africa Machine Safety Industry Revenue (Million), by Country 2024 & 2032
- Figure 51: Middle East and Africa Machine Safety Industry Revenue Share (%), by Country 2024 & 2032
List of Tables
- Table 1: Global Machine Safety Industry Revenue Million Forecast, by Region 2019 & 2032
- Table 2: Global Machine Safety Industry Revenue Million Forecast, by Implementation 2019 & 2032
- Table 3: Global Machine Safety Industry Revenue Million Forecast, by Component 2019 & 2032
- Table 4: Global Machine Safety Industry Revenue Million Forecast, by End-User 2019 & 2032
- Table 5: Global Machine Safety Industry Revenue Million Forecast, by Region 2019 & 2032
- Table 6: Global Machine Safety Industry Revenue Million Forecast, by Country 2019 & 2032
- Table 7: Machine Safety Industry Revenue (Million) Forecast, by Application 2019 & 2032
- Table 8: Global Machine Safety Industry Revenue Million Forecast, by Country 2019 & 2032
- Table 9: Machine Safety Industry Revenue (Million) Forecast, by Application 2019 & 2032
- Table 10: Global Machine Safety Industry Revenue Million Forecast, by Country 2019 & 2032
- Table 11: Machine Safety Industry Revenue (Million) Forecast, by Application 2019 & 2032
- Table 12: Global Machine Safety Industry Revenue Million Forecast, by Country 2019 & 2032
- Table 13: Machine Safety Industry Revenue (Million) Forecast, by Application 2019 & 2032
- Table 14: Global Machine Safety Industry Revenue Million Forecast, by Country 2019 & 2032
- Table 15: Machine Safety Industry Revenue (Million) Forecast, by Application 2019 & 2032
- Table 16: Global Machine Safety Industry Revenue Million Forecast, by Implementation 2019 & 2032
- Table 17: Global Machine Safety Industry Revenue Million Forecast, by Component 2019 & 2032
- Table 18: Global Machine Safety Industry Revenue Million Forecast, by End-User 2019 & 2032
- Table 19: Global Machine Safety Industry Revenue Million Forecast, by Country 2019 & 2032
- Table 20: Global Machine Safety Industry Revenue Million Forecast, by Implementation 2019 & 2032
- Table 21: Global Machine Safety Industry Revenue Million Forecast, by Component 2019 & 2032
- Table 22: Global Machine Safety Industry Revenue Million Forecast, by End-User 2019 & 2032
- Table 23: Global Machine Safety Industry Revenue Million Forecast, by Country 2019 & 2032
- Table 24: Global Machine Safety Industry Revenue Million Forecast, by Implementation 2019 & 2032
- Table 25: Global Machine Safety Industry Revenue Million Forecast, by Component 2019 & 2032
- Table 26: Global Machine Safety Industry Revenue Million Forecast, by End-User 2019 & 2032
- Table 27: Global Machine Safety Industry Revenue Million Forecast, by Country 2019 & 2032
- Table 28: Global Machine Safety Industry Revenue Million Forecast, by Implementation 2019 & 2032
- Table 29: Global Machine Safety Industry Revenue Million Forecast, by Component 2019 & 2032
- Table 30: Global Machine Safety Industry Revenue Million Forecast, by End-User 2019 & 2032
- Table 31: Global Machine Safety Industry Revenue Million Forecast, by Country 2019 & 2032
- Table 32: Global Machine Safety Industry Revenue Million Forecast, by Implementation 2019 & 2032
- Table 33: Global Machine Safety Industry Revenue Million Forecast, by Component 2019 & 2032
- Table 34: Global Machine Safety Industry Revenue Million Forecast, by End-User 2019 & 2032
- Table 35: Global Machine Safety Industry Revenue Million Forecast, by Country 2019 & 2032
Frequently Asked Questions
1. What is the projected Compound Annual Growth Rate (CAGR) of the Machine Safety Industry?
The projected CAGR is approximately 9.97%.
2. Which companies are prominent players in the Machine Safety Industry?
Key companies in the market include Rockwell Automation, Honeywell International Inc, Keyence Corporation, Banner Engineerin, IDEC Corporation, Mitsubishi Electric Corporation, Siemens AG, Schneider Electric SE, Omron Corporation, Sick AG, Pilz GmbH & Co KG, ABB Limited.
3. What are the main segments of the Machine Safety Industry?
The market segments include Implementation, Component, End-User.
4. Can you provide details about the market size?
The market size is estimated to be USD 5.07 Million as of 2022.
5. What are some drivers contributing to market growth?
Increasing Number of Industrial Accidents; Stringent Government Regulations and Mandatory Safety Standards.
6. What are the notable trends driving market growth?
Oil and Gas Industry to Hold a Significant Share.
7. Are there any restraints impacting market growth?
Additional Costs Associated with Machine Safety Systems.
8. Can you provide examples of recent developments in the market?
October 2021 - Pilz launched a new safe radar sensor, PSENradar, for safe protection zone monitoring in rugged conditions such as dust, dirt, rain, light, sparks, or vibrations. The sensor can be used along with the configurable small controller PNOZmulti 2, offering an optimum solution. In addition to outdoor applications and areas in woodworking and metalworking. It also makes it possible to safeguard robot applications because the solution achieves a higher category.
9. What pricing options are available for accessing the report?
Pricing options include single-user, multi-user, and enterprise licenses priced at USD 4750, USD 5250, and USD 8750 respectively.
10. Is the market size provided in terms of value or volume?
The market size is provided in terms of value, measured in Million.
11. Are there any specific market keywords associated with the report?
Yes, the market keyword associated with the report is "Machine Safety Industry," which aids in identifying and referencing the specific market segment covered.
12. How do I determine which pricing option suits my needs best?
The pricing options vary based on user requirements and access needs. Individual users may opt for single-user licenses, while businesses requiring broader access may choose multi-user or enterprise licenses for cost-effective access to the report.
13. Are there any additional resources or data provided in the Machine Safety Industry report?
While the report offers comprehensive insights, it's advisable to review the specific contents or supplementary materials provided to ascertain if additional resources or data are available.
14. How can I stay updated on further developments or reports in the Machine Safety Industry?
To stay informed about further developments, trends, and reports in the Machine Safety Industry, consider subscribing to industry newsletters, following relevant companies and organizations, or regularly checking reputable industry news sources and publications.
Methodology
Step 1 - Identification of Relevant Samples Size from Population Database


Step 2 - Approaches for Defining Global Market Size (Value, Volume* & Price*)

Note*: In applicable scenarios
Step 3 - Data Sources
Primary Research
- Web Analytics
- Survey Reports
- Research Institute
- Latest Research Reports
- Opinion Leaders
Secondary Research
- Annual Reports
- White Paper
- Latest Press Release
- Industry Association
- Paid Database
- Investor Presentations

Step 4 - Data Triangulation
Involves using different sources of information in order to increase the validity of a study
These sources are likely to be stakeholders in a program - participants, other researchers, program staff, other community members, and so on.
Then we put all data in single framework & apply various statistical tools to find out the dynamic on the market.
During the analysis stage, feedback from the stakeholder groups would be compared to determine areas of agreement as well as areas of divergence
