

Key Insights
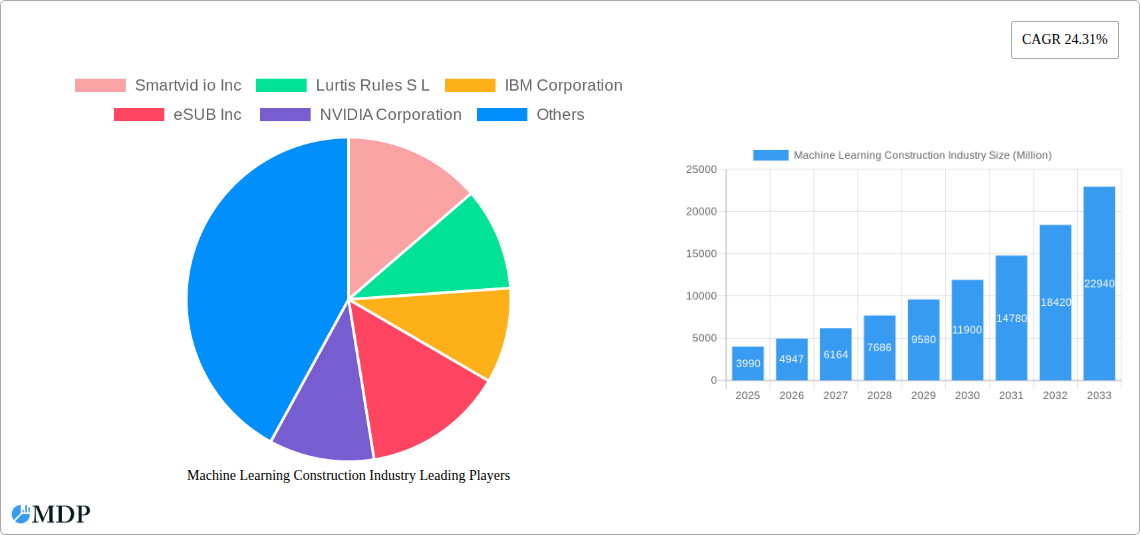
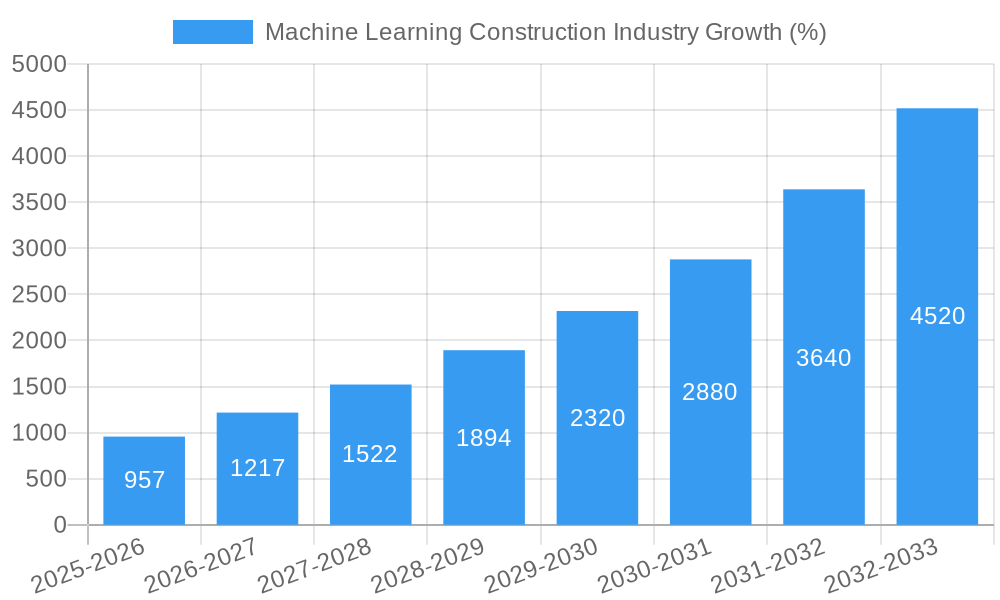
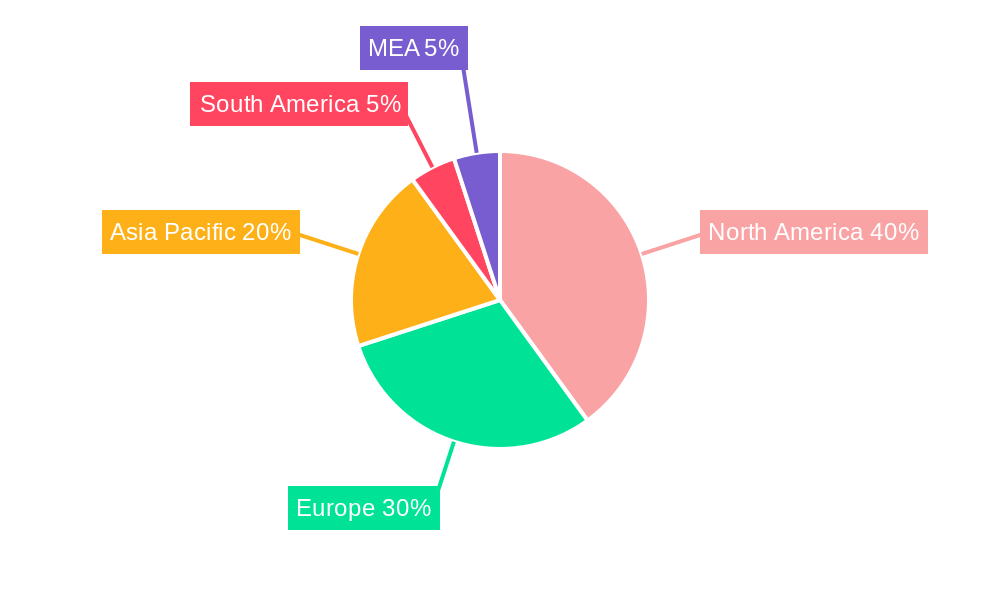
The Machine Learning (ML) construction industry is experiencing robust growth, projected to reach a market size of $3.99 billion in 2025, expanding at a Compound Annual Growth Rate (CAGR) of 24.31%. This surge is driven by several factors. Firstly, the increasing need for enhanced safety on construction sites, coupled with the potential for reduced accidents and improved worker productivity through ML-powered predictive analytics, is a significant driver. Secondly, the rise of autonomous equipment and the demand for optimized construction processes fueled by predictive maintenance and real-time monitoring are pushing adoption. Finally, the integration of ML into planning and design phases is enabling more efficient project management, cost reduction, and improved accuracy. The segmentation of the market reveals a strong presence across application areas. Planning and design utilizes ML for streamlined workflows, while safety applications leverage it for risk mitigation. Autonomous equipment benefits from improved precision and efficiency, and monitoring and maintenance sees a reduction in downtime and increased operational lifespan. Key players like Smartvid.io, IBM, Autodesk, and Bentley Systems are at the forefront, shaping the technological landscape. Geographical analysis shows North America and Europe currently hold significant market share, driven by early adoption and technological advancements. However, the Asia-Pacific region is poised for rapid growth given its booming construction sector and increasing investments in technological upgrades.
The forecast period (2025-2033) anticipates continued expansion, driven by further technological advancements, increasing data availability, and broader industry acceptance. However, challenges remain. Data security concerns, the high initial investment costs associated with implementing ML solutions, and the need for skilled workforce capable of integrating and utilizing these systems pose potential restraints. Despite these challenges, the long-term outlook for the ML construction industry remains incredibly positive. The industry's capacity to enhance efficiency, safety, and sustainability positions it for considerable expansion in the coming years. The ongoing development and refinement of ML algorithms, combined with decreasing implementation costs, will only further accelerate market growth.
Machine Learning Construction Industry: A Comprehensive Market Report (2019-2033)
This comprehensive report provides a detailed analysis of the Machine Learning Construction Industry market, projecting a market value exceeding $XX Million by 2033. It delves into market dynamics, leading players, technological advancements, and future growth opportunities, offering actionable insights for stakeholders across the construction technology landscape. The report covers the period 2019-2033, with a base year of 2025 and a forecast period of 2025-2033.
Machine Learning Construction Industry Market Dynamics & Concentration
The Machine Learning Construction Industry market is characterized by increasing market concentration, driven by significant mergers and acquisitions (M&A) activity and the emergence of dominant technology providers. Over the historical period (2019-2024), we estimate a total of xx M&A deals, consolidating market share among key players. The market is further shaped by continuous innovation, evolving regulatory frameworks, the emergence of product substitutes, shifting end-user trends (towards data-driven decision-making), and ongoing technological advancements.
- Market Concentration: The top 5 players account for an estimated xx% of the market share in 2025. This concentration is expected to increase slightly by 2033.
- Innovation Drivers: AI-powered solutions for safety, automation, and predictive maintenance are key drivers of innovation, fostering significant market growth.
- Regulatory Frameworks: Government regulations focused on safety and efficiency are influencing the adoption of machine learning technologies.
- Product Substitutes: Traditional methods face increasing pressure from the efficiency and accuracy offered by machine learning solutions.
- End-User Trends: Construction firms are increasingly demanding data-driven insights to improve project planning, reduce costs, and enhance safety.
- M&A Activities: The high number of M&A activities indicates a growing interest in consolidating market share and expanding technological capabilities.
Machine Learning Construction Industry Industry Trends & Analysis
The Machine Learning Construction Industry is experiencing robust growth, fueled by several key factors. The market is projected to register a Compound Annual Growth Rate (CAGR) of xx% during the forecast period (2025-2033), driven by increasing adoption of machine learning across various construction applications. This growth is primarily fueled by factors including advancements in AI and machine learning, the escalating demand for improved construction efficiency, and the urgent need to enhance safety standards on construction sites. The market penetration of machine learning technologies in the construction industry is currently estimated at xx% and is anticipated to reach xx% by 2033. Increasing consumer preference for sustainable construction practices and the rise of smart cities further contribute to market expansion. The competitive landscape is dynamic, with both established tech giants and emerging startups vying for market share.
Leading Markets & Segments in Machine Machine Learning Construction Industry
North America currently dominates the Machine Learning Construction Industry market, driven by high infrastructure spending, early adoption of new technologies, and a well-established technological ecosystem. However, the Asia-Pacific region is poised for significant growth due to rapid urbanization and substantial investments in infrastructure development.
Dominant Segment: The Monitoring and Maintenance segment is currently the largest, holding xx% of the market share, followed by Planning and Design with xx%.
Key Drivers:
- North America: High government spending on infrastructure projects, a robust technological ecosystem, and early adoption of new technologies.
- Asia-Pacific: Rapid urbanization, substantial infrastructure investments, and a growing demand for efficient construction solutions.
- Europe: Focus on sustainable construction practices and strong government support for technological innovation.
Dominance Analysis: North America's dominance is attributed to high technological maturity, early adoption of AI and ML solutions, and established partnerships between technology providers and construction companies. The Asia-Pacific region is projected to witness accelerated growth due to its vast infrastructure needs and rapid technological advancements.
Machine Learning Construction Industry Product Developments
Recent product innovations highlight a trend toward integrated platforms combining data capture, analysis, and predictive capabilities. This allows for real-time project monitoring, improved risk assessment, and more efficient resource allocation. Companies are focusing on developing user-friendly interfaces and seamless integration with existing construction workflows to enhance market acceptance. The competitive advantage lies in offering robust, accurate, and readily deployable solutions catering to specific construction needs, ensuring a strong market fit.
Key Drivers of Machine Learning Construction Industry Growth
Several factors are driving the growth of the Machine Learning Construction Industry. Technological advancements in artificial intelligence and machine learning are providing more sophisticated and accurate tools for construction management. Government initiatives promoting digitalization and infrastructure development are creating substantial demand. Finally, the economic benefits of increased efficiency and reduced costs are further incentivizing adoption.
Challenges in the Machine Learning Construction Industry Market
Despite the immense potential, the Machine Learning Construction Industry faces several challenges. High implementation costs and the need for skilled professionals can hinder adoption, especially for smaller companies. Data security and privacy concerns necessitate robust solutions. The integration of new technologies with existing workflows can also present logistical challenges. Competitive pressures from both established players and new entrants intensify the need for continuous innovation and adaptation.
Emerging Opportunities in Machine Learning Construction Industry
The future of the Machine Learning Construction Industry looks bright, with significant growth potential. Technological breakthroughs in areas such as computer vision and natural language processing are expected to unlock new possibilities. Strategic partnerships between technology companies and construction firms are facilitating rapid market penetration. Expanding into new geographical markets, particularly in developing economies with significant infrastructure needs, presents lucrative opportunities for growth.
Leading Players in the Machine Learning Construction Industry Sector
- Smartvid.io Inc
- Lurtis Rules S L
- IBM Corporation
- eSUB Inc
- NVIDIA Corporation
- Alice Technologies Inc
- Microsoft Corporation
- Building System Planning Inc
- Dassault Systèmes SE
- PTC Inc
- Autodesk Inc
- Oracle Corporation
- Bentley Systems Inc
- Doxel Inc
Key Milestones in Machine Learning Construction Industry Industry
- November 2022: Disperse.io launched Impulse, a product integrating 360° site scan insights for improved project management. This highlights the growing trend of AI-powered solutions for enhancing site visibility and decision-making.
- September 2022: Briq's acquisition of Swipez demonstrates the increasing focus on automating financial workflows within the construction industry, improving efficiency and forecasting accuracy.
- June 2022: The partnership between Agile Business Technology and OpenSpace expanded the reach of 360° capture and AI platforms to South Africa, emphasizing the global adoption of these technologies for enhanced collaboration and quality control.
Strategic Outlook for Machine Learning Construction Industry Market
The Machine Learning Construction Industry is poised for sustained growth, driven by continuous technological innovation, increasing demand for efficiency, and the growing adoption of data-driven decision-making across the construction sector. Strategic partnerships, investment in research and development, and expansion into new geographic markets will be crucial for success. The industry's future rests on the ability of companies to deliver innovative, scalable, and user-friendly solutions that address the evolving needs of the construction industry.
Machine Learning Construction Industry Segmentation
-
1. Application
- 1.1. Planning and Design
- 1.2. Safety
- 1.3. Autonomous Equipment
- 1.4. Monitoring and Maintenance
Machine Learning Construction Industry Segmentation By Geography
- 1. North America
- 2. Europe
- 3. Asia
- 4. Australia and New Zealand
- 5. Latin America
Machine Learning Construction Industry REPORT HIGHLIGHTS
| Aspects | Details |
|---|---|
| Study Period | 2019-2033 |
| Base Year | 2024 |
| Estimated Year | 2025 |
| Forecast Period | 2025-2033 |
| Historical Period | 2019-2024 |
| Growth Rate | CAGR of 24.31% from 2019-2033 |
| Segmentation |
|
Table of Contents
- 1. Introduction
- 1.1. Research Scope
- 1.2. Market Segmentation
- 1.3. Research Methodology
- 1.4. Definitions and Assumptions
- 2. Executive Summary
- 2.1. Introduction
- 3. Market Dynamics
- 3.1. Introduction
- 3.2. Market Drivers
- 3.2.1. Increasing Need to Reduce Production Costs; Demand for More Safety Measures at Construction Sites
- 3.3. Market Restrains
- 3.3.1. Cost and Implementation Issues
- 3.4. Market Trends
- 3.4.1. Planning and Design Application Segment is Expected to Hold Significant Market Share
- 4. Market Factor Analysis
- 4.1. Porters Five Forces
- 4.2. Supply/Value Chain
- 4.3. PESTEL analysis
- 4.4. Market Entropy
- 4.5. Patent/Trademark Analysis
- 5. Global Machine Learning Construction Industry Analysis, Insights and Forecast, 2019-2031
- 5.1. Market Analysis, Insights and Forecast - by Application
- 5.1.1. Planning and Design
- 5.1.2. Safety
- 5.1.3. Autonomous Equipment
- 5.1.4. Monitoring and Maintenance
- 5.2. Market Analysis, Insights and Forecast - by Region
- 5.2.1. North America
- 5.2.2. Europe
- 5.2.3. Asia
- 5.2.4. Australia and New Zealand
- 5.2.5. Latin America
- 5.1. Market Analysis, Insights and Forecast - by Application
- 6. North America Machine Learning Construction Industry Analysis, Insights and Forecast, 2019-2031
- 6.1. Market Analysis, Insights and Forecast - by Application
- 6.1.1. Planning and Design
- 6.1.2. Safety
- 6.1.3. Autonomous Equipment
- 6.1.4. Monitoring and Maintenance
- 6.1. Market Analysis, Insights and Forecast - by Application
- 7. Europe Machine Learning Construction Industry Analysis, Insights and Forecast, 2019-2031
- 7.1. Market Analysis, Insights and Forecast - by Application
- 7.1.1. Planning and Design
- 7.1.2. Safety
- 7.1.3. Autonomous Equipment
- 7.1.4. Monitoring and Maintenance
- 7.1. Market Analysis, Insights and Forecast - by Application
- 8. Asia Machine Learning Construction Industry Analysis, Insights and Forecast, 2019-2031
- 8.1. Market Analysis, Insights and Forecast - by Application
- 8.1.1. Planning and Design
- 8.1.2. Safety
- 8.1.3. Autonomous Equipment
- 8.1.4. Monitoring and Maintenance
- 8.1. Market Analysis, Insights and Forecast - by Application
- 9. Australia and New Zealand Machine Learning Construction Industry Analysis, Insights and Forecast, 2019-2031
- 9.1. Market Analysis, Insights and Forecast - by Application
- 9.1.1. Planning and Design
- 9.1.2. Safety
- 9.1.3. Autonomous Equipment
- 9.1.4. Monitoring and Maintenance
- 9.1. Market Analysis, Insights and Forecast - by Application
- 10. Latin America Machine Learning Construction Industry Analysis, Insights and Forecast, 2019-2031
- 10.1. Market Analysis, Insights and Forecast - by Application
- 10.1.1. Planning and Design
- 10.1.2. Safety
- 10.1.3. Autonomous Equipment
- 10.1.4. Monitoring and Maintenance
- 10.1. Market Analysis, Insights and Forecast - by Application
- 11. North America Machine Learning Construction Industry Analysis, Insights and Forecast, 2019-2031
- 11.1. Market Analysis, Insights and Forecast - By Country/Sub-region
- 11.1.1 United States
- 11.1.2 Canada
- 11.1.3 Mexico
- 12. Europe Machine Learning Construction Industry Analysis, Insights and Forecast, 2019-2031
- 12.1. Market Analysis, Insights and Forecast - By Country/Sub-region
- 12.1.1 Germany
- 12.1.2 United Kingdom
- 12.1.3 France
- 12.1.4 Spain
- 12.1.5 Italy
- 12.1.6 Spain
- 12.1.7 Belgium
- 12.1.8 Netherland
- 12.1.9 Nordics
- 12.1.10 Rest of Europe
- 13. Asia Pacific Machine Learning Construction Industry Analysis, Insights and Forecast, 2019-2031
- 13.1. Market Analysis, Insights and Forecast - By Country/Sub-region
- 13.1.1 China
- 13.1.2 Japan
- 13.1.3 India
- 13.1.4 South Korea
- 13.1.5 Southeast Asia
- 13.1.6 Australia
- 13.1.7 Indonesia
- 13.1.8 Phillipes
- 13.1.9 Singapore
- 13.1.10 Thailandc
- 13.1.11 Rest of Asia Pacific
- 14. South America Machine Learning Construction Industry Analysis, Insights and Forecast, 2019-2031
- 14.1. Market Analysis, Insights and Forecast - By Country/Sub-region
- 14.1.1 Brazil
- 14.1.2 Argentina
- 14.1.3 Peru
- 14.1.4 Chile
- 14.1.5 Colombia
- 14.1.6 Ecuador
- 14.1.7 Venezuela
- 14.1.8 Rest of South America
- 15. North America Machine Learning Construction Industry Analysis, Insights and Forecast, 2019-2031
- 15.1. Market Analysis, Insights and Forecast - By Country/Sub-region
- 15.1.1 United States
- 15.1.2 Canada
- 15.1.3 Mexico
- 16. MEA Machine Learning Construction Industry Analysis, Insights and Forecast, 2019-2031
- 16.1. Market Analysis, Insights and Forecast - By Country/Sub-region
- 16.1.1 United Arab Emirates
- 16.1.2 Saudi Arabia
- 16.1.3 South Africa
- 16.1.4 Rest of Middle East and Africa
- 17. Competitive Analysis
- 17.1. Global Market Share Analysis 2024
- 17.2. Company Profiles
- 17.2.1 Smartvid io Inc
- 17.2.1.1. Overview
- 17.2.1.2. Products
- 17.2.1.3. SWOT Analysis
- 17.2.1.4. Recent Developments
- 17.2.1.5. Financials (Based on Availability)
- 17.2.2 Lurtis Rules S L
- 17.2.2.1. Overview
- 17.2.2.2. Products
- 17.2.2.3. SWOT Analysis
- 17.2.2.4. Recent Developments
- 17.2.2.5. Financials (Based on Availability)
- 17.2.3 IBM Corporation
- 17.2.3.1. Overview
- 17.2.3.2. Products
- 17.2.3.3. SWOT Analysis
- 17.2.3.4. Recent Developments
- 17.2.3.5. Financials (Based on Availability)
- 17.2.4 eSUB Inc
- 17.2.4.1. Overview
- 17.2.4.2. Products
- 17.2.4.3. SWOT Analysis
- 17.2.4.4. Recent Developments
- 17.2.4.5. Financials (Based on Availability)
- 17.2.5 NVIDIA Corporation
- 17.2.5.1. Overview
- 17.2.5.2. Products
- 17.2.5.3. SWOT Analysis
- 17.2.5.4. Recent Developments
- 17.2.5.5. Financials (Based on Availability)
- 17.2.6 Alice Technologies Inc
- 17.2.6.1. Overview
- 17.2.6.2. Products
- 17.2.6.3. SWOT Analysis
- 17.2.6.4. Recent Developments
- 17.2.6.5. Financials (Based on Availability)
- 17.2.7 Microsoft Corporation
- 17.2.7.1. Overview
- 17.2.7.2. Products
- 17.2.7.3. SWOT Analysis
- 17.2.7.4. Recent Developments
- 17.2.7.5. Financials (Based on Availability)
- 17.2.8 Building System Planning Inc
- 17.2.8.1. Overview
- 17.2.8.2. Products
- 17.2.8.3. SWOT Analysis
- 17.2.8.4. Recent Developments
- 17.2.8.5. Financials (Based on Availability)
- 17.2.9 Dassault Systems SE
- 17.2.9.1. Overview
- 17.2.9.2. Products
- 17.2.9.3. SWOT Analysis
- 17.2.9.4. Recent Developments
- 17.2.9.5. Financials (Based on Availability)
- 17.2.10 PTC Inc
- 17.2.10.1. Overview
- 17.2.10.2. Products
- 17.2.10.3. SWOT Analysis
- 17.2.10.4. Recent Developments
- 17.2.10.5. Financials (Based on Availability)
- 17.2.11 Autodesk Inc
- 17.2.11.1. Overview
- 17.2.11.2. Products
- 17.2.11.3. SWOT Analysis
- 17.2.11.4. Recent Developments
- 17.2.11.5. Financials (Based on Availability)
- 17.2.12 Oracle Corporation
- 17.2.12.1. Overview
- 17.2.12.2. Products
- 17.2.12.3. SWOT Analysis
- 17.2.12.4. Recent Developments
- 17.2.12.5. Financials (Based on Availability)
- 17.2.13 Bentley Systems Inc
- 17.2.13.1. Overview
- 17.2.13.2. Products
- 17.2.13.3. SWOT Analysis
- 17.2.13.4. Recent Developments
- 17.2.13.5. Financials (Based on Availability)
- 17.2.14 Doxel Inc
- 17.2.14.1. Overview
- 17.2.14.2. Products
- 17.2.14.3. SWOT Analysis
- 17.2.14.4. Recent Developments
- 17.2.14.5. Financials (Based on Availability)
- 17.2.1 Smartvid io Inc
List of Figures
- Figure 1: Global Machine Learning Construction Industry Revenue Breakdown (Million, %) by Region 2024 & 2032
- Figure 2: Global Machine Learning Construction Industry Volume Breakdown (K Unit, %) by Region 2024 & 2032
- Figure 3: North America Machine Learning Construction Industry Revenue (Million), by Country 2024 & 2032
- Figure 4: North America Machine Learning Construction Industry Volume (K Unit), by Country 2024 & 2032
- Figure 5: North America Machine Learning Construction Industry Revenue Share (%), by Country 2024 & 2032
- Figure 6: North America Machine Learning Construction Industry Volume Share (%), by Country 2024 & 2032
- Figure 7: Europe Machine Learning Construction Industry Revenue (Million), by Country 2024 & 2032
- Figure 8: Europe Machine Learning Construction Industry Volume (K Unit), by Country 2024 & 2032
- Figure 9: Europe Machine Learning Construction Industry Revenue Share (%), by Country 2024 & 2032
- Figure 10: Europe Machine Learning Construction Industry Volume Share (%), by Country 2024 & 2032
- Figure 11: Asia Pacific Machine Learning Construction Industry Revenue (Million), by Country 2024 & 2032
- Figure 12: Asia Pacific Machine Learning Construction Industry Volume (K Unit), by Country 2024 & 2032
- Figure 13: Asia Pacific Machine Learning Construction Industry Revenue Share (%), by Country 2024 & 2032
- Figure 14: Asia Pacific Machine Learning Construction Industry Volume Share (%), by Country 2024 & 2032
- Figure 15: South America Machine Learning Construction Industry Revenue (Million), by Country 2024 & 2032
- Figure 16: South America Machine Learning Construction Industry Volume (K Unit), by Country 2024 & 2032
- Figure 17: South America Machine Learning Construction Industry Revenue Share (%), by Country 2024 & 2032
- Figure 18: South America Machine Learning Construction Industry Volume Share (%), by Country 2024 & 2032
- Figure 19: North America Machine Learning Construction Industry Revenue (Million), by Country 2024 & 2032
- Figure 20: North America Machine Learning Construction Industry Volume (K Unit), by Country 2024 & 2032
- Figure 21: North America Machine Learning Construction Industry Revenue Share (%), by Country 2024 & 2032
- Figure 22: North America Machine Learning Construction Industry Volume Share (%), by Country 2024 & 2032
- Figure 23: MEA Machine Learning Construction Industry Revenue (Million), by Country 2024 & 2032
- Figure 24: MEA Machine Learning Construction Industry Volume (K Unit), by Country 2024 & 2032
- Figure 25: MEA Machine Learning Construction Industry Revenue Share (%), by Country 2024 & 2032
- Figure 26: MEA Machine Learning Construction Industry Volume Share (%), by Country 2024 & 2032
- Figure 27: North America Machine Learning Construction Industry Revenue (Million), by Application 2024 & 2032
- Figure 28: North America Machine Learning Construction Industry Volume (K Unit), by Application 2024 & 2032
- Figure 29: North America Machine Learning Construction Industry Revenue Share (%), by Application 2024 & 2032
- Figure 30: North America Machine Learning Construction Industry Volume Share (%), by Application 2024 & 2032
- Figure 31: North America Machine Learning Construction Industry Revenue (Million), by Country 2024 & 2032
- Figure 32: North America Machine Learning Construction Industry Volume (K Unit), by Country 2024 & 2032
- Figure 33: North America Machine Learning Construction Industry Revenue Share (%), by Country 2024 & 2032
- Figure 34: North America Machine Learning Construction Industry Volume Share (%), by Country 2024 & 2032
- Figure 35: Europe Machine Learning Construction Industry Revenue (Million), by Application 2024 & 2032
- Figure 36: Europe Machine Learning Construction Industry Volume (K Unit), by Application 2024 & 2032
- Figure 37: Europe Machine Learning Construction Industry Revenue Share (%), by Application 2024 & 2032
- Figure 38: Europe Machine Learning Construction Industry Volume Share (%), by Application 2024 & 2032
- Figure 39: Europe Machine Learning Construction Industry Revenue (Million), by Country 2024 & 2032
- Figure 40: Europe Machine Learning Construction Industry Volume (K Unit), by Country 2024 & 2032
- Figure 41: Europe Machine Learning Construction Industry Revenue Share (%), by Country 2024 & 2032
- Figure 42: Europe Machine Learning Construction Industry Volume Share (%), by Country 2024 & 2032
- Figure 43: Asia Machine Learning Construction Industry Revenue (Million), by Application 2024 & 2032
- Figure 44: Asia Machine Learning Construction Industry Volume (K Unit), by Application 2024 & 2032
- Figure 45: Asia Machine Learning Construction Industry Revenue Share (%), by Application 2024 & 2032
- Figure 46: Asia Machine Learning Construction Industry Volume Share (%), by Application 2024 & 2032
- Figure 47: Asia Machine Learning Construction Industry Revenue (Million), by Country 2024 & 2032
- Figure 48: Asia Machine Learning Construction Industry Volume (K Unit), by Country 2024 & 2032
- Figure 49: Asia Machine Learning Construction Industry Revenue Share (%), by Country 2024 & 2032
- Figure 50: Asia Machine Learning Construction Industry Volume Share (%), by Country 2024 & 2032
- Figure 51: Australia and New Zealand Machine Learning Construction Industry Revenue (Million), by Application 2024 & 2032
- Figure 52: Australia and New Zealand Machine Learning Construction Industry Volume (K Unit), by Application 2024 & 2032
- Figure 53: Australia and New Zealand Machine Learning Construction Industry Revenue Share (%), by Application 2024 & 2032
- Figure 54: Australia and New Zealand Machine Learning Construction Industry Volume Share (%), by Application 2024 & 2032
- Figure 55: Australia and New Zealand Machine Learning Construction Industry Revenue (Million), by Country 2024 & 2032
- Figure 56: Australia and New Zealand Machine Learning Construction Industry Volume (K Unit), by Country 2024 & 2032
- Figure 57: Australia and New Zealand Machine Learning Construction Industry Revenue Share (%), by Country 2024 & 2032
- Figure 58: Australia and New Zealand Machine Learning Construction Industry Volume Share (%), by Country 2024 & 2032
- Figure 59: Latin America Machine Learning Construction Industry Revenue (Million), by Application 2024 & 2032
- Figure 60: Latin America Machine Learning Construction Industry Volume (K Unit), by Application 2024 & 2032
- Figure 61: Latin America Machine Learning Construction Industry Revenue Share (%), by Application 2024 & 2032
- Figure 62: Latin America Machine Learning Construction Industry Volume Share (%), by Application 2024 & 2032
- Figure 63: Latin America Machine Learning Construction Industry Revenue (Million), by Country 2024 & 2032
- Figure 64: Latin America Machine Learning Construction Industry Volume (K Unit), by Country 2024 & 2032
- Figure 65: Latin America Machine Learning Construction Industry Revenue Share (%), by Country 2024 & 2032
- Figure 66: Latin America Machine Learning Construction Industry Volume Share (%), by Country 2024 & 2032
List of Tables
- Table 1: Global Machine Learning Construction Industry Revenue Million Forecast, by Region 2019 & 2032
- Table 2: Global Machine Learning Construction Industry Volume K Unit Forecast, by Region 2019 & 2032
- Table 3: Global Machine Learning Construction Industry Revenue Million Forecast, by Application 2019 & 2032
- Table 4: Global Machine Learning Construction Industry Volume K Unit Forecast, by Application 2019 & 2032
- Table 5: Global Machine Learning Construction Industry Revenue Million Forecast, by Region 2019 & 2032
- Table 6: Global Machine Learning Construction Industry Volume K Unit Forecast, by Region 2019 & 2032
- Table 7: Global Machine Learning Construction Industry Revenue Million Forecast, by Country 2019 & 2032
- Table 8: Global Machine Learning Construction Industry Volume K Unit Forecast, by Country 2019 & 2032
- Table 9: United States Machine Learning Construction Industry Revenue (Million) Forecast, by Application 2019 & 2032
- Table 10: United States Machine Learning Construction Industry Volume (K Unit) Forecast, by Application 2019 & 2032
- Table 11: Canada Machine Learning Construction Industry Revenue (Million) Forecast, by Application 2019 & 2032
- Table 12: Canada Machine Learning Construction Industry Volume (K Unit) Forecast, by Application 2019 & 2032
- Table 13: Mexico Machine Learning Construction Industry Revenue (Million) Forecast, by Application 2019 & 2032
- Table 14: Mexico Machine Learning Construction Industry Volume (K Unit) Forecast, by Application 2019 & 2032
- Table 15: Global Machine Learning Construction Industry Revenue Million Forecast, by Country 2019 & 2032
- Table 16: Global Machine Learning Construction Industry Volume K Unit Forecast, by Country 2019 & 2032
- Table 17: Germany Machine Learning Construction Industry Revenue (Million) Forecast, by Application 2019 & 2032
- Table 18: Germany Machine Learning Construction Industry Volume (K Unit) Forecast, by Application 2019 & 2032
- Table 19: United Kingdom Machine Learning Construction Industry Revenue (Million) Forecast, by Application 2019 & 2032
- Table 20: United Kingdom Machine Learning Construction Industry Volume (K Unit) Forecast, by Application 2019 & 2032
- Table 21: France Machine Learning Construction Industry Revenue (Million) Forecast, by Application 2019 & 2032
- Table 22: France Machine Learning Construction Industry Volume (K Unit) Forecast, by Application 2019 & 2032
- Table 23: Spain Machine Learning Construction Industry Revenue (Million) Forecast, by Application 2019 & 2032
- Table 24: Spain Machine Learning Construction Industry Volume (K Unit) Forecast, by Application 2019 & 2032
- Table 25: Italy Machine Learning Construction Industry Revenue (Million) Forecast, by Application 2019 & 2032
- Table 26: Italy Machine Learning Construction Industry Volume (K Unit) Forecast, by Application 2019 & 2032
- Table 27: Spain Machine Learning Construction Industry Revenue (Million) Forecast, by Application 2019 & 2032
- Table 28: Spain Machine Learning Construction Industry Volume (K Unit) Forecast, by Application 2019 & 2032
- Table 29: Belgium Machine Learning Construction Industry Revenue (Million) Forecast, by Application 2019 & 2032
- Table 30: Belgium Machine Learning Construction Industry Volume (K Unit) Forecast, by Application 2019 & 2032
- Table 31: Netherland Machine Learning Construction Industry Revenue (Million) Forecast, by Application 2019 & 2032
- Table 32: Netherland Machine Learning Construction Industry Volume (K Unit) Forecast, by Application 2019 & 2032
- Table 33: Nordics Machine Learning Construction Industry Revenue (Million) Forecast, by Application 2019 & 2032
- Table 34: Nordics Machine Learning Construction Industry Volume (K Unit) Forecast, by Application 2019 & 2032
- Table 35: Rest of Europe Machine Learning Construction Industry Revenue (Million) Forecast, by Application 2019 & 2032
- Table 36: Rest of Europe Machine Learning Construction Industry Volume (K Unit) Forecast, by Application 2019 & 2032
- Table 37: Global Machine Learning Construction Industry Revenue Million Forecast, by Country 2019 & 2032
- Table 38: Global Machine Learning Construction Industry Volume K Unit Forecast, by Country 2019 & 2032
- Table 39: China Machine Learning Construction Industry Revenue (Million) Forecast, by Application 2019 & 2032
- Table 40: China Machine Learning Construction Industry Volume (K Unit) Forecast, by Application 2019 & 2032
- Table 41: Japan Machine Learning Construction Industry Revenue (Million) Forecast, by Application 2019 & 2032
- Table 42: Japan Machine Learning Construction Industry Volume (K Unit) Forecast, by Application 2019 & 2032
- Table 43: India Machine Learning Construction Industry Revenue (Million) Forecast, by Application 2019 & 2032
- Table 44: India Machine Learning Construction Industry Volume (K Unit) Forecast, by Application 2019 & 2032
- Table 45: South Korea Machine Learning Construction Industry Revenue (Million) Forecast, by Application 2019 & 2032
- Table 46: South Korea Machine Learning Construction Industry Volume (K Unit) Forecast, by Application 2019 & 2032
- Table 47: Southeast Asia Machine Learning Construction Industry Revenue (Million) Forecast, by Application 2019 & 2032
- Table 48: Southeast Asia Machine Learning Construction Industry Volume (K Unit) Forecast, by Application 2019 & 2032
- Table 49: Australia Machine Learning Construction Industry Revenue (Million) Forecast, by Application 2019 & 2032
- Table 50: Australia Machine Learning Construction Industry Volume (K Unit) Forecast, by Application 2019 & 2032
- Table 51: Indonesia Machine Learning Construction Industry Revenue (Million) Forecast, by Application 2019 & 2032
- Table 52: Indonesia Machine Learning Construction Industry Volume (K Unit) Forecast, by Application 2019 & 2032
- Table 53: Phillipes Machine Learning Construction Industry Revenue (Million) Forecast, by Application 2019 & 2032
- Table 54: Phillipes Machine Learning Construction Industry Volume (K Unit) Forecast, by Application 2019 & 2032
- Table 55: Singapore Machine Learning Construction Industry Revenue (Million) Forecast, by Application 2019 & 2032
- Table 56: Singapore Machine Learning Construction Industry Volume (K Unit) Forecast, by Application 2019 & 2032
- Table 57: Thailandc Machine Learning Construction Industry Revenue (Million) Forecast, by Application 2019 & 2032
- Table 58: Thailandc Machine Learning Construction Industry Volume (K Unit) Forecast, by Application 2019 & 2032
- Table 59: Rest of Asia Pacific Machine Learning Construction Industry Revenue (Million) Forecast, by Application 2019 & 2032
- Table 60: Rest of Asia Pacific Machine Learning Construction Industry Volume (K Unit) Forecast, by Application 2019 & 2032
- Table 61: Global Machine Learning Construction Industry Revenue Million Forecast, by Country 2019 & 2032
- Table 62: Global Machine Learning Construction Industry Volume K Unit Forecast, by Country 2019 & 2032
- Table 63: Brazil Machine Learning Construction Industry Revenue (Million) Forecast, by Application 2019 & 2032
- Table 64: Brazil Machine Learning Construction Industry Volume (K Unit) Forecast, by Application 2019 & 2032
- Table 65: Argentina Machine Learning Construction Industry Revenue (Million) Forecast, by Application 2019 & 2032
- Table 66: Argentina Machine Learning Construction Industry Volume (K Unit) Forecast, by Application 2019 & 2032
- Table 67: Peru Machine Learning Construction Industry Revenue (Million) Forecast, by Application 2019 & 2032
- Table 68: Peru Machine Learning Construction Industry Volume (K Unit) Forecast, by Application 2019 & 2032
- Table 69: Chile Machine Learning Construction Industry Revenue (Million) Forecast, by Application 2019 & 2032
- Table 70: Chile Machine Learning Construction Industry Volume (K Unit) Forecast, by Application 2019 & 2032
- Table 71: Colombia Machine Learning Construction Industry Revenue (Million) Forecast, by Application 2019 & 2032
- Table 72: Colombia Machine Learning Construction Industry Volume (K Unit) Forecast, by Application 2019 & 2032
- Table 73: Ecuador Machine Learning Construction Industry Revenue (Million) Forecast, by Application 2019 & 2032
- Table 74: Ecuador Machine Learning Construction Industry Volume (K Unit) Forecast, by Application 2019 & 2032
- Table 75: Venezuela Machine Learning Construction Industry Revenue (Million) Forecast, by Application 2019 & 2032
- Table 76: Venezuela Machine Learning Construction Industry Volume (K Unit) Forecast, by Application 2019 & 2032
- Table 77: Rest of South America Machine Learning Construction Industry Revenue (Million) Forecast, by Application 2019 & 2032
- Table 78: Rest of South America Machine Learning Construction Industry Volume (K Unit) Forecast, by Application 2019 & 2032
- Table 79: Global Machine Learning Construction Industry Revenue Million Forecast, by Country 2019 & 2032
- Table 80: Global Machine Learning Construction Industry Volume K Unit Forecast, by Country 2019 & 2032
- Table 81: United States Machine Learning Construction Industry Revenue (Million) Forecast, by Application 2019 & 2032
- Table 82: United States Machine Learning Construction Industry Volume (K Unit) Forecast, by Application 2019 & 2032
- Table 83: Canada Machine Learning Construction Industry Revenue (Million) Forecast, by Application 2019 & 2032
- Table 84: Canada Machine Learning Construction Industry Volume (K Unit) Forecast, by Application 2019 & 2032
- Table 85: Mexico Machine Learning Construction Industry Revenue (Million) Forecast, by Application 2019 & 2032
- Table 86: Mexico Machine Learning Construction Industry Volume (K Unit) Forecast, by Application 2019 & 2032
- Table 87: Global Machine Learning Construction Industry Revenue Million Forecast, by Country 2019 & 2032
- Table 88: Global Machine Learning Construction Industry Volume K Unit Forecast, by Country 2019 & 2032
- Table 89: United Arab Emirates Machine Learning Construction Industry Revenue (Million) Forecast, by Application 2019 & 2032
- Table 90: United Arab Emirates Machine Learning Construction Industry Volume (K Unit) Forecast, by Application 2019 & 2032
- Table 91: Saudi Arabia Machine Learning Construction Industry Revenue (Million) Forecast, by Application 2019 & 2032
- Table 92: Saudi Arabia Machine Learning Construction Industry Volume (K Unit) Forecast, by Application 2019 & 2032
- Table 93: South Africa Machine Learning Construction Industry Revenue (Million) Forecast, by Application 2019 & 2032
- Table 94: South Africa Machine Learning Construction Industry Volume (K Unit) Forecast, by Application 2019 & 2032
- Table 95: Rest of Middle East and Africa Machine Learning Construction Industry Revenue (Million) Forecast, by Application 2019 & 2032
- Table 96: Rest of Middle East and Africa Machine Learning Construction Industry Volume (K Unit) Forecast, by Application 2019 & 2032
- Table 97: Global Machine Learning Construction Industry Revenue Million Forecast, by Application 2019 & 2032
- Table 98: Global Machine Learning Construction Industry Volume K Unit Forecast, by Application 2019 & 2032
- Table 99: Global Machine Learning Construction Industry Revenue Million Forecast, by Country 2019 & 2032
- Table 100: Global Machine Learning Construction Industry Volume K Unit Forecast, by Country 2019 & 2032
- Table 101: Global Machine Learning Construction Industry Revenue Million Forecast, by Application 2019 & 2032
- Table 102: Global Machine Learning Construction Industry Volume K Unit Forecast, by Application 2019 & 2032
- Table 103: Global Machine Learning Construction Industry Revenue Million Forecast, by Country 2019 & 2032
- Table 104: Global Machine Learning Construction Industry Volume K Unit Forecast, by Country 2019 & 2032
- Table 105: Global Machine Learning Construction Industry Revenue Million Forecast, by Application 2019 & 2032
- Table 106: Global Machine Learning Construction Industry Volume K Unit Forecast, by Application 2019 & 2032
- Table 107: Global Machine Learning Construction Industry Revenue Million Forecast, by Country 2019 & 2032
- Table 108: Global Machine Learning Construction Industry Volume K Unit Forecast, by Country 2019 & 2032
- Table 109: Global Machine Learning Construction Industry Revenue Million Forecast, by Application 2019 & 2032
- Table 110: Global Machine Learning Construction Industry Volume K Unit Forecast, by Application 2019 & 2032
- Table 111: Global Machine Learning Construction Industry Revenue Million Forecast, by Country 2019 & 2032
- Table 112: Global Machine Learning Construction Industry Volume K Unit Forecast, by Country 2019 & 2032
- Table 113: Global Machine Learning Construction Industry Revenue Million Forecast, by Application 2019 & 2032
- Table 114: Global Machine Learning Construction Industry Volume K Unit Forecast, by Application 2019 & 2032
- Table 115: Global Machine Learning Construction Industry Revenue Million Forecast, by Country 2019 & 2032
- Table 116: Global Machine Learning Construction Industry Volume K Unit Forecast, by Country 2019 & 2032
Frequently Asked Questions
1. What is the projected Compound Annual Growth Rate (CAGR) of the Machine Learning Construction Industry?
The projected CAGR is approximately 24.31%.
2. Which companies are prominent players in the Machine Learning Construction Industry?
Key companies in the market include Smartvid io Inc, Lurtis Rules S L, IBM Corporation, eSUB Inc , NVIDIA Corporation, Alice Technologies Inc, Microsoft Corporation, Building System Planning Inc, Dassault Systems SE, PTC Inc, Autodesk Inc, Oracle Corporation, Bentley Systems Inc, Doxel Inc.
3. What are the main segments of the Machine Learning Construction Industry?
The market segments include Application.
4. Can you provide details about the market size?
The market size is estimated to be USD 3.99 Million as of 2022.
5. What are some drivers contributing to market growth?
Increasing Need to Reduce Production Costs; Demand for More Safety Measures at Construction Sites.
6. What are the notable trends driving market growth?
Planning and Design Application Segment is Expected to Hold Significant Market Share.
7. Are there any restraints impacting market growth?
Cost and Implementation Issues.
8. Can you provide examples of recent developments in the market?
November 2022: Disperse.io, a UK-based construction technology company with a platform that used AI to help project managers track work, capture data from building sites, and make better project decisions, launched a new product, Impulse, that highlights issues gleaned from 360° site scans captured in its platform. This solution integrated performance insights into building elevations and presents problems to project managers.
9. What pricing options are available for accessing the report?
Pricing options include single-user, multi-user, and enterprise licenses priced at USD 4750, USD 5250, and USD 8750 respectively.
10. Is the market size provided in terms of value or volume?
The market size is provided in terms of value, measured in Million and volume, measured in K Unit.
11. Are there any specific market keywords associated with the report?
Yes, the market keyword associated with the report is "Machine Learning Construction Industry," which aids in identifying and referencing the specific market segment covered.
12. How do I determine which pricing option suits my needs best?
The pricing options vary based on user requirements and access needs. Individual users may opt for single-user licenses, while businesses requiring broader access may choose multi-user or enterprise licenses for cost-effective access to the report.
13. Are there any additional resources or data provided in the Machine Learning Construction Industry report?
While the report offers comprehensive insights, it's advisable to review the specific contents or supplementary materials provided to ascertain if additional resources or data are available.
14. How can I stay updated on further developments or reports in the Machine Learning Construction Industry?
To stay informed about further developments, trends, and reports in the Machine Learning Construction Industry, consider subscribing to industry newsletters, following relevant companies and organizations, or regularly checking reputable industry news sources and publications.
Methodology
Step 1 - Identification of Relevant Samples Size from Population Database


Step 2 - Approaches for Defining Global Market Size (Value, Volume* & Price*)

Note*: In applicable scenarios
Step 3 - Data Sources
Primary Research
- Web Analytics
- Survey Reports
- Research Institute
- Latest Research Reports
- Opinion Leaders
Secondary Research
- Annual Reports
- White Paper
- Latest Press Release
- Industry Association
- Paid Database
- Investor Presentations

Step 4 - Data Triangulation
Involves using different sources of information in order to increase the validity of a study
These sources are likely to be stakeholders in a program - participants, other researchers, program staff, other community members, and so on.
Then we put all data in single framework & apply various statistical tools to find out the dynamic on the market.
During the analysis stage, feedback from the stakeholder groups would be compared to determine areas of agreement as well as areas of divergence
