

Key Insights
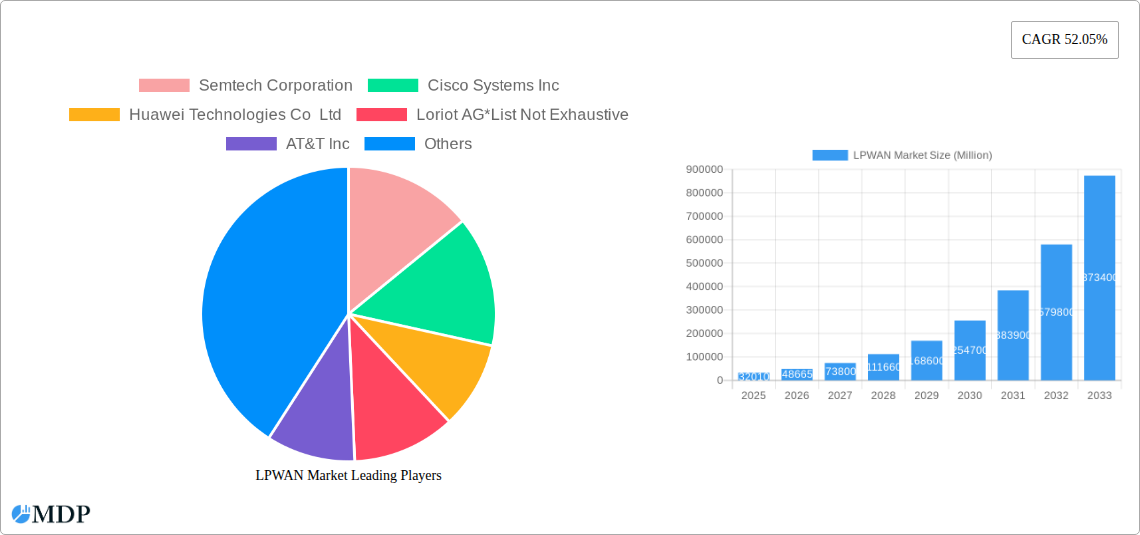
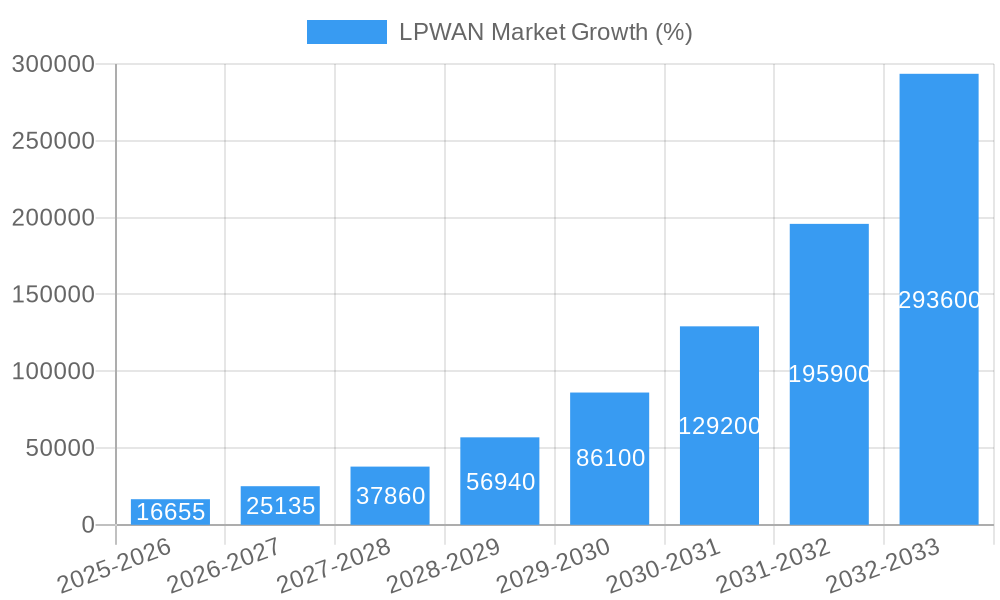
The Low-Power Wide-Area Network (LPWAN) market is experiencing explosive growth, projected to reach \$32.01 billion in 2025 and exhibiting a remarkable Compound Annual Growth Rate (CAGR) of 52.05%. This surge is driven by the increasing demand for IoT applications across diverse sectors. Key drivers include the rising adoption of smart city initiatives, the proliferation of smart homes and buildings, the expanding agricultural technology sector, and the growing need for efficient industrial automation and remote monitoring in fields like oil and gas and logistics. The market is segmented by technology (LoRaWAN, NB-IoT, LTE-M, and others), service type (professional and managed services), end-user (oil and gas, consumer electronics, healthcare, industrial manufacturing, logistics, and others), and application (smart cities, smart homes/buildings, smart agriculture, and others). The strong presence of established players like Semtech, Cisco, Huawei, and Vodafone, coupled with the emergence of innovative solutions from smaller companies, fuels intense competition and continuous innovation within the LPWAN ecosystem.
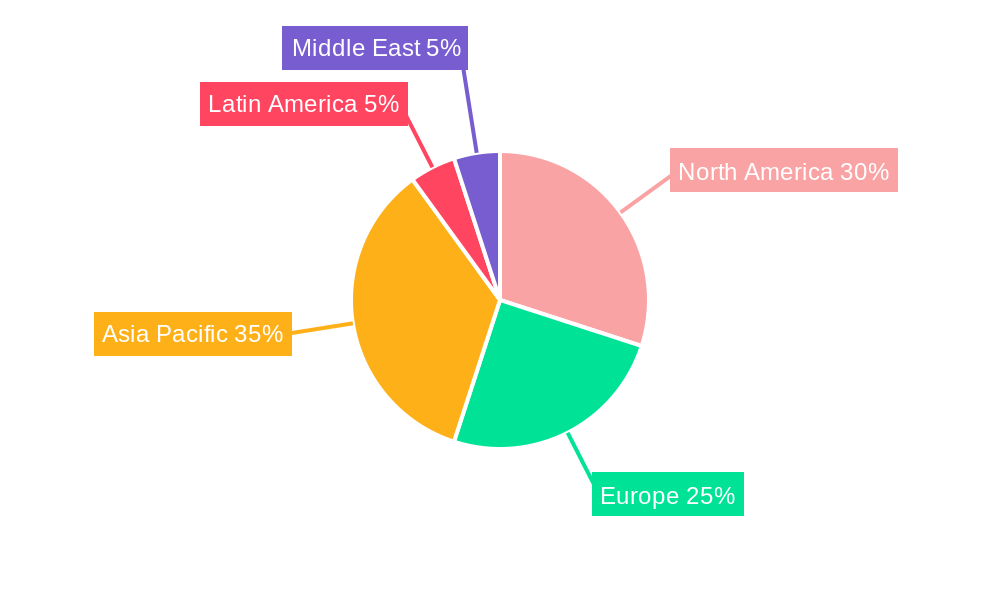
The market's growth trajectory is expected to continue throughout the forecast period (2025-2033). While technological advancements and expanding service offerings are key growth catalysts, potential restraints include the need for robust cybersecurity measures, regulatory hurdles in certain regions, and the potential for interoperability issues between different LPWAN technologies. However, ongoing standardization efforts and the increasing focus on security are mitigating these concerns. The Asia-Pacific region is anticipated to lead the market due to rapid industrialization, increasing urbanization, and significant investments in IoT infrastructure. North America and Europe will also experience substantial growth, driven by strong demand from established industries and a well-developed technological landscape. Future market expansion will hinge on addressing challenges related to network coverage, scalability, and cost-effectiveness while maintaining a focus on data security and privacy.
LPWAN Market: A Comprehensive Report (2019-2033)
This in-depth report provides a comprehensive analysis of the LPWAN market, offering actionable insights for stakeholders across the value chain. With a study period spanning 2019-2033, a base year of 2025, and a forecast period of 2025-2033, this report leverages historical data (2019-2024) to project future market trends and growth opportunities. The report covers key segments, leading players like Semtech Corporation, Cisco Systems Inc, Huawei Technologies Co Ltd, and Loriot AG (list not exhaustive), and analyzes market dynamics, industry trends, and emerging opportunities within the rapidly evolving landscape of Low Power Wide Area Networks. The market is expected to reach xx Million by 2033, exhibiting a CAGR of xx% during the forecast period.
LPWAN Market Dynamics & Concentration
The LPWAN market is characterized by a moderately concentrated competitive landscape with several key players holding significant market share. Market concentration is influenced by factors such as technological advancements, regulatory landscapes, and mergers & acquisitions (M&A) activity. While precise market share figures require further in-depth analysis and may vary based on the exact methodologies used, leading players like Semtech Corporation and Huawei Technologies Co Ltd are estimated to hold a substantial portion of the market in 2025. The number of M&A deals in the LPWAN sector has seen a noticeable increase in recent years, driven by the need for companies to expand their product portfolios and geographical reach. This consolidation trend is likely to continue, shaping the future competitive dynamics of the market.
- Innovation Drivers: Continuous advancements in semiconductor technology, enabling smaller, more energy-efficient devices and improved network range, are key innovation drivers. The development of new protocols and standards, such as LoRaWAN and NB-IoT, has also broadened the market's appeal.
- Regulatory Frameworks: Government regulations related to spectrum allocation and network deployment play a significant role in shaping market growth. Harmonized standards and supportive regulatory environments are essential for broader market adoption.
- Product Substitutes: While LPWAN technologies offer unique advantages in terms of low power consumption and wide-area coverage, other wireless technologies like Wi-Fi and cellular networks can serve as substitutes depending on application requirements.
- End-User Trends: The increasing adoption of IoT devices across various sectors, such as smart cities, industrial automation, and agriculture, fuels demand for LPWAN solutions.
- M&A Activities: A growing number of mergers and acquisitions are reshaping the market landscape, allowing companies to expand their product portfolios, enhance their technological capabilities, and gain a competitive edge. Deal counts are estimated to have increased by approximately xx% between 2022 and 2023.
LPWAN Market Industry Trends & Analysis
The LPWAN market is experiencing significant growth driven by several factors. The proliferation of IoT devices is a major catalyst, with numerous sectors adopting LPWAN technology for data transmission. This is further fueled by the declining cost of LPWAN devices and the increasing availability of low-cost data plans. Technological advancements in the area of network efficiency, security, and scalability are continually pushing the envelope, creating new opportunities and boosting market penetration.
Consumer preferences are also playing a role. The preference for energy-efficient and cost-effective solutions is leading to greater adoption across applications. Competitive dynamics are intense, with various companies offering distinct LPWAN solutions. This competitiveness drives innovation and improves solution affordability, accessibility, and overall market performance. The market's Compound Annual Growth Rate (CAGR) is estimated to be xx% from 2025 to 2033, driven by increasing IoT adoption and advancements in the technology.
Leading Markets & Segments in LPWAN Market
The LPWAN market exhibits significant regional variations in adoption rates and growth trajectories. While precise market share figures require in-depth analysis, North America and Europe are projected to be the leading regions in terms of market size. However, regions such as Asia-Pacific are poised for strong growth, particularly in countries with rapidly developing IoT infrastructure.
- By Type: LoRaWAN is expected to hold the largest market share in 2025, driven by its ease of use, low cost, and strong community support. NB-IoT and LTE-M are also witnessing increasing adoption, particularly in cellular-network-rich areas. Other technologies like Sigfox and Weightless occupy niche segments.
- By Service: The managed service segment is currently holding a larger share, driven by its ability to offer comprehensive network management and support. Professional services, encompassing deployment and integration, are also expanding.
- By End-user: The industrial manufacturing and smart cities sectors represent substantial market segments. Logistics and traveling are experiencing increasing adoption, as are consumer electronics and healthcare. The oil and gas industry remains a key adopter due to the need for remote monitoring and data transmission in harsh environments.
- By Application: Smart cities and smart homes/buildings are projected to be the largest application segments, driven by rising urbanization and increasing demand for connected homes. Smart agriculture is also a significant growth area, as farmers are seeking to leverage LPWAN solutions for precision farming techniques.
Key Drivers:
- Economic Policies: Government incentives and support for IoT development and infrastructure.
- Infrastructure Development: Investment in cellular network infrastructure which supports NB-IoT and LTE-M.
LPWAN Market Product Developments
Recent product developments within the LPWAN market reflect a strong focus on enhancing energy efficiency, improving network range, and improving security features. Semtech Corporation's recent announcement of its PerSe SX9376 integrated circuit for 5G mobile devices signifies the industry's focus on leveraging LPWAN technology in high-bandwidth scenarios. The evolution of technologies like LoRaWAN and NB-IoT are also leading to new and improved modules, gateways, and other components to boost network efficiency and security. This is further reinforced by UnaBiz’s move to open-source Sigfox technology, widening accessibility and fostering community innovation.
Key Drivers of LPWAN Market Growth
Several factors are driving the growth of the LPWAN market. Technological advancements, such as the development of more energy-efficient and cost-effective devices, are key factors. Economic factors, such as declining data costs and increasing government investments in IoT infrastructure, also contribute to the market's expansion. Finally, supportive regulatory frameworks that promote the development and deployment of LPWAN networks are essential for the long-term growth of the industry.
Challenges in the LPWAN Market
The LPWAN market faces several challenges, including the need for standardization across different LPWAN technologies and the possibility of regulatory hurdles affecting spectrum allocation and network deployment. Supply chain issues can affect the availability and cost of LPWAN devices and components. The presence of established players and the entrance of new companies contribute to intensifying competition, creating market pressure that can affect profit margins for established companies. These factors collectively impact market expansion and growth potential.
Emerging Opportunities in LPWAN Market
Significant growth opportunities exist in the LPWAN market. Technological breakthroughs in low-power, long-range communication technology will continually extend the reach and capabilities of LPWAN networks. The development of strategic partnerships between LPWAN providers and system integrators, as well as efforts in expanding LPWAN coverage in underserved geographical regions, are creating substantial market expansion potential.
Leading Players in the LPWAN Market Sector
- Semtech Corporation
- Cisco Systems Inc
- Huawei Technologies Co Ltd
- Loriot AG
- AT&T Inc
- Sigfox SA
- Ingenu Inc
- Vodafone Group PLC
Key Milestones in LPWAN Market Industry
- April 2023: Semtech Corporation announced the expansion of its PerSe product portfolio with a new integrated circuit (IC) for 5G mobile devices. This improves RF control in end devices, enhancing connectivity and 5G SAR compliance.
- April 2023: UnaBiz open-sourced its Sigfox 0G technology device library code, making it easier for developers to integrate 0G technology into IoT devices. This is expected to significantly expand the adoption and application of Sigfox.
Strategic Outlook for LPWAN Market
The LPWAN market is poised for significant growth, driven by the expansion of IoT applications, advancements in technology, and supportive regulatory environments. Strategic opportunities exist for companies to focus on expanding network coverage in underserved regions, developing innovative applications tailored to specific industry needs, and forming strategic partnerships to broaden their market reach. The future looks bright for LPWAN, with substantial growth potential in the years to come.
LPWAN Market Segmentation
-
1. Type
- 1.1. LoRaWAN
- 1.2. NB-IoT
- 1.3. LTE-M
- 1.4. Other Types (Sigfox, Weightless, etc.)
-
2. Service
- 2.1. Professional Service
- 2.2. Managed Service
-
3. End User
- 3.1. Oil and Gas
- 3.2. Consumer Electronics
- 3.3. Healthcare
- 3.4. Industrial Manufacturing
- 3.5. Logistics and Travelling
- 3.6. Other End Users
-
4. Application
- 4.1. Smart Cities
- 4.2. Smart Homes/Buildings
- 4.3. Smart Agriculture
- 4.4. Other Applications
LPWAN Market Segmentation By Geography
- 1. North America
- 2. Europe
- 3. Asia
- 4. Australia and New Zealand
- 5. Latin America
- 6. Middle East and Africa
LPWAN Market REPORT HIGHLIGHTS
| Aspects | Details |
|---|---|
| Study Period | 2019-2033 |
| Base Year | 2024 |
| Estimated Year | 2025 |
| Forecast Period | 2025-2033 |
| Historical Period | 2019-2024 |
| Growth Rate | CAGR of 52.05% from 2019-2033 |
| Segmentation |
|
Table of Contents
- 1. Introduction
- 1.1. Research Scope
- 1.2. Market Segmentation
- 1.3. Research Methodology
- 1.4. Definitions and Assumptions
- 2. Executive Summary
- 2.1. Introduction
- 3. Market Dynamics
- 3.1. Introduction
- 3.2. Market Drivers
- 3.2.1. Rising Need of Long Range Connectivity Between Devices5.1.2 5G Technology to Drive the Market Growth
- 3.3. Market Restrains
- 3.3.1. Privacy and Security Concerns
- 3.4. Market Trends
- 3.4.1. 5G Technology to Drive the Market Growth
- 4. Market Factor Analysis
- 4.1. Porters Five Forces
- 4.2. Supply/Value Chain
- 4.3. PESTEL analysis
- 4.4. Market Entropy
- 4.5. Patent/Trademark Analysis
- 5. Global LPWAN Market Analysis, Insights and Forecast, 2019-2031
- 5.1. Market Analysis, Insights and Forecast - by Type
- 5.1.1. LoRaWAN
- 5.1.2. NB-IoT
- 5.1.3. LTE-M
- 5.1.4. Other Types (Sigfox, Weightless, etc.)
- 5.2. Market Analysis, Insights and Forecast - by Service
- 5.2.1. Professional Service
- 5.2.2. Managed Service
- 5.3. Market Analysis, Insights and Forecast - by End User
- 5.3.1. Oil and Gas
- 5.3.2. Consumer Electronics
- 5.3.3. Healthcare
- 5.3.4. Industrial Manufacturing
- 5.3.5. Logistics and Travelling
- 5.3.6. Other End Users
- 5.4. Market Analysis, Insights and Forecast - by Application
- 5.4.1. Smart Cities
- 5.4.2. Smart Homes/Buildings
- 5.4.3. Smart Agriculture
- 5.4.4. Other Applications
- 5.5. Market Analysis, Insights and Forecast - by Region
- 5.5.1. North America
- 5.5.2. Europe
- 5.5.3. Asia
- 5.5.4. Australia and New Zealand
- 5.5.5. Latin America
- 5.5.6. Middle East and Africa
- 5.1. Market Analysis, Insights and Forecast - by Type
- 6. North America LPWAN Market Analysis, Insights and Forecast, 2019-2031
- 6.1. Market Analysis, Insights and Forecast - by Type
- 6.1.1. LoRaWAN
- 6.1.2. NB-IoT
- 6.1.3. LTE-M
- 6.1.4. Other Types (Sigfox, Weightless, etc.)
- 6.2. Market Analysis, Insights and Forecast - by Service
- 6.2.1. Professional Service
- 6.2.2. Managed Service
- 6.3. Market Analysis, Insights and Forecast - by End User
- 6.3.1. Oil and Gas
- 6.3.2. Consumer Electronics
- 6.3.3. Healthcare
- 6.3.4. Industrial Manufacturing
- 6.3.5. Logistics and Travelling
- 6.3.6. Other End Users
- 6.4. Market Analysis, Insights and Forecast - by Application
- 6.4.1. Smart Cities
- 6.4.2. Smart Homes/Buildings
- 6.4.3. Smart Agriculture
- 6.4.4. Other Applications
- 6.1. Market Analysis, Insights and Forecast - by Type
- 7. Europe LPWAN Market Analysis, Insights and Forecast, 2019-2031
- 7.1. Market Analysis, Insights and Forecast - by Type
- 7.1.1. LoRaWAN
- 7.1.2. NB-IoT
- 7.1.3. LTE-M
- 7.1.4. Other Types (Sigfox, Weightless, etc.)
- 7.2. Market Analysis, Insights and Forecast - by Service
- 7.2.1. Professional Service
- 7.2.2. Managed Service
- 7.3. Market Analysis, Insights and Forecast - by End User
- 7.3.1. Oil and Gas
- 7.3.2. Consumer Electronics
- 7.3.3. Healthcare
- 7.3.4. Industrial Manufacturing
- 7.3.5. Logistics and Travelling
- 7.3.6. Other End Users
- 7.4. Market Analysis, Insights and Forecast - by Application
- 7.4.1. Smart Cities
- 7.4.2. Smart Homes/Buildings
- 7.4.3. Smart Agriculture
- 7.4.4. Other Applications
- 7.1. Market Analysis, Insights and Forecast - by Type
- 8. Asia LPWAN Market Analysis, Insights and Forecast, 2019-2031
- 8.1. Market Analysis, Insights and Forecast - by Type
- 8.1.1. LoRaWAN
- 8.1.2. NB-IoT
- 8.1.3. LTE-M
- 8.1.4. Other Types (Sigfox, Weightless, etc.)
- 8.2. Market Analysis, Insights and Forecast - by Service
- 8.2.1. Professional Service
- 8.2.2. Managed Service
- 8.3. Market Analysis, Insights and Forecast - by End User
- 8.3.1. Oil and Gas
- 8.3.2. Consumer Electronics
- 8.3.3. Healthcare
- 8.3.4. Industrial Manufacturing
- 8.3.5. Logistics and Travelling
- 8.3.6. Other End Users
- 8.4. Market Analysis, Insights and Forecast - by Application
- 8.4.1. Smart Cities
- 8.4.2. Smart Homes/Buildings
- 8.4.3. Smart Agriculture
- 8.4.4. Other Applications
- 8.1. Market Analysis, Insights and Forecast - by Type
- 9. Australia and New Zealand LPWAN Market Analysis, Insights and Forecast, 2019-2031
- 9.1. Market Analysis, Insights and Forecast - by Type
- 9.1.1. LoRaWAN
- 9.1.2. NB-IoT
- 9.1.3. LTE-M
- 9.1.4. Other Types (Sigfox, Weightless, etc.)
- 9.2. Market Analysis, Insights and Forecast - by Service
- 9.2.1. Professional Service
- 9.2.2. Managed Service
- 9.3. Market Analysis, Insights and Forecast - by End User
- 9.3.1. Oil and Gas
- 9.3.2. Consumer Electronics
- 9.3.3. Healthcare
- 9.3.4. Industrial Manufacturing
- 9.3.5. Logistics and Travelling
- 9.3.6. Other End Users
- 9.4. Market Analysis, Insights and Forecast - by Application
- 9.4.1. Smart Cities
- 9.4.2. Smart Homes/Buildings
- 9.4.3. Smart Agriculture
- 9.4.4. Other Applications
- 9.1. Market Analysis, Insights and Forecast - by Type
- 10. Latin America LPWAN Market Analysis, Insights and Forecast, 2019-2031
- 10.1. Market Analysis, Insights and Forecast - by Type
- 10.1.1. LoRaWAN
- 10.1.2. NB-IoT
- 10.1.3. LTE-M
- 10.1.4. Other Types (Sigfox, Weightless, etc.)
- 10.2. Market Analysis, Insights and Forecast - by Service
- 10.2.1. Professional Service
- 10.2.2. Managed Service
- 10.3. Market Analysis, Insights and Forecast - by End User
- 10.3.1. Oil and Gas
- 10.3.2. Consumer Electronics
- 10.3.3. Healthcare
- 10.3.4. Industrial Manufacturing
- 10.3.5. Logistics and Travelling
- 10.3.6. Other End Users
- 10.4. Market Analysis, Insights and Forecast - by Application
- 10.4.1. Smart Cities
- 10.4.2. Smart Homes/Buildings
- 10.4.3. Smart Agriculture
- 10.4.4. Other Applications
- 10.1. Market Analysis, Insights and Forecast - by Type
- 11. Middle East and Africa LPWAN Market Analysis, Insights and Forecast, 2019-2031
- 11.1. Market Analysis, Insights and Forecast - by Type
- 11.1.1. LoRaWAN
- 11.1.2. NB-IoT
- 11.1.3. LTE-M
- 11.1.4. Other Types (Sigfox, Weightless, etc.)
- 11.2. Market Analysis, Insights and Forecast - by Service
- 11.2.1. Professional Service
- 11.2.2. Managed Service
- 11.3. Market Analysis, Insights and Forecast - by End User
- 11.3.1. Oil and Gas
- 11.3.2. Consumer Electronics
- 11.3.3. Healthcare
- 11.3.4. Industrial Manufacturing
- 11.3.5. Logistics and Travelling
- 11.3.6. Other End Users
- 11.4. Market Analysis, Insights and Forecast - by Application
- 11.4.1. Smart Cities
- 11.4.2. Smart Homes/Buildings
- 11.4.3. Smart Agriculture
- 11.4.4. Other Applications
- 11.1. Market Analysis, Insights and Forecast - by Type
- 12. North America LPWAN Market Analysis, Insights and Forecast, 2019-2031
- 12.1. Market Analysis, Insights and Forecast - By Country/Sub-region
- 12.1.1.
- 13. Europe LPWAN Market Analysis, Insights and Forecast, 2019-2031
- 13.1. Market Analysis, Insights and Forecast - By Country/Sub-region
- 13.1.1.
- 14. Asia Pacific LPWAN Market Analysis, Insights and Forecast, 2019-2031
- 14.1. Market Analysis, Insights and Forecast - By Country/Sub-region
- 14.1.1.
- 15. Latin America LPWAN Market Analysis, Insights and Forecast, 2019-2031
- 15.1. Market Analysis, Insights and Forecast - By Country/Sub-region
- 15.1.1.
- 16. Middle East LPWAN Market Analysis, Insights and Forecast, 2019-2031
- 16.1. Market Analysis, Insights and Forecast - By Country/Sub-region
- 16.1.1.
- 17. Competitive Analysis
- 17.1. Global Market Share Analysis 2024
- 17.2. Company Profiles
- 17.2.1 Semtech Corporation
- 17.2.1.1. Overview
- 17.2.1.2. Products
- 17.2.1.3. SWOT Analysis
- 17.2.1.4. Recent Developments
- 17.2.1.5. Financials (Based on Availability)
- 17.2.2 Cisco Systems Inc
- 17.2.2.1. Overview
- 17.2.2.2. Products
- 17.2.2.3. SWOT Analysis
- 17.2.2.4. Recent Developments
- 17.2.2.5. Financials (Based on Availability)
- 17.2.3 Huawei Technologies Co Ltd
- 17.2.3.1. Overview
- 17.2.3.2. Products
- 17.2.3.3. SWOT Analysis
- 17.2.3.4. Recent Developments
- 17.2.3.5. Financials (Based on Availability)
- 17.2.4 Loriot AG*List Not Exhaustive
- 17.2.4.1. Overview
- 17.2.4.2. Products
- 17.2.4.3. SWOT Analysis
- 17.2.4.4. Recent Developments
- 17.2.4.5. Financials (Based on Availability)
- 17.2.5 AT&T Inc
- 17.2.5.1. Overview
- 17.2.5.2. Products
- 17.2.5.3. SWOT Analysis
- 17.2.5.4. Recent Developments
- 17.2.5.5. Financials (Based on Availability)
- 17.2.6 Sigfox SA
- 17.2.6.1. Overview
- 17.2.6.2. Products
- 17.2.6.3. SWOT Analysis
- 17.2.6.4. Recent Developments
- 17.2.6.5. Financials (Based on Availability)
- 17.2.7 Ingenu Inc
- 17.2.7.1. Overview
- 17.2.7.2. Products
- 17.2.7.3. SWOT Analysis
- 17.2.7.4. Recent Developments
- 17.2.7.5. Financials (Based on Availability)
- 17.2.8 Vodafone Group PLC
- 17.2.8.1. Overview
- 17.2.8.2. Products
- 17.2.8.3. SWOT Analysis
- 17.2.8.4. Recent Developments
- 17.2.8.5. Financials (Based on Availability)
- 17.2.1 Semtech Corporation
List of Figures
- Figure 1: Global LPWAN Market Revenue Breakdown (Million, %) by Region 2024 & 2032
- Figure 2: North America LPWAN Market Revenue (Million), by Country 2024 & 2032
- Figure 3: North America LPWAN Market Revenue Share (%), by Country 2024 & 2032
- Figure 4: Europe LPWAN Market Revenue (Million), by Country 2024 & 2032
- Figure 5: Europe LPWAN Market Revenue Share (%), by Country 2024 & 2032
- Figure 6: Asia Pacific LPWAN Market Revenue (Million), by Country 2024 & 2032
- Figure 7: Asia Pacific LPWAN Market Revenue Share (%), by Country 2024 & 2032
- Figure 8: Latin America LPWAN Market Revenue (Million), by Country 2024 & 2032
- Figure 9: Latin America LPWAN Market Revenue Share (%), by Country 2024 & 2032
- Figure 10: Middle East LPWAN Market Revenue (Million), by Country 2024 & 2032
- Figure 11: Middle East LPWAN Market Revenue Share (%), by Country 2024 & 2032
- Figure 12: North America LPWAN Market Revenue (Million), by Type 2024 & 2032
- Figure 13: North America LPWAN Market Revenue Share (%), by Type 2024 & 2032
- Figure 14: North America LPWAN Market Revenue (Million), by Service 2024 & 2032
- Figure 15: North America LPWAN Market Revenue Share (%), by Service 2024 & 2032
- Figure 16: North America LPWAN Market Revenue (Million), by End User 2024 & 2032
- Figure 17: North America LPWAN Market Revenue Share (%), by End User 2024 & 2032
- Figure 18: North America LPWAN Market Revenue (Million), by Application 2024 & 2032
- Figure 19: North America LPWAN Market Revenue Share (%), by Application 2024 & 2032
- Figure 20: North America LPWAN Market Revenue (Million), by Country 2024 & 2032
- Figure 21: North America LPWAN Market Revenue Share (%), by Country 2024 & 2032
- Figure 22: Europe LPWAN Market Revenue (Million), by Type 2024 & 2032
- Figure 23: Europe LPWAN Market Revenue Share (%), by Type 2024 & 2032
- Figure 24: Europe LPWAN Market Revenue (Million), by Service 2024 & 2032
- Figure 25: Europe LPWAN Market Revenue Share (%), by Service 2024 & 2032
- Figure 26: Europe LPWAN Market Revenue (Million), by End User 2024 & 2032
- Figure 27: Europe LPWAN Market Revenue Share (%), by End User 2024 & 2032
- Figure 28: Europe LPWAN Market Revenue (Million), by Application 2024 & 2032
- Figure 29: Europe LPWAN Market Revenue Share (%), by Application 2024 & 2032
- Figure 30: Europe LPWAN Market Revenue (Million), by Country 2024 & 2032
- Figure 31: Europe LPWAN Market Revenue Share (%), by Country 2024 & 2032
- Figure 32: Asia LPWAN Market Revenue (Million), by Type 2024 & 2032
- Figure 33: Asia LPWAN Market Revenue Share (%), by Type 2024 & 2032
- Figure 34: Asia LPWAN Market Revenue (Million), by Service 2024 & 2032
- Figure 35: Asia LPWAN Market Revenue Share (%), by Service 2024 & 2032
- Figure 36: Asia LPWAN Market Revenue (Million), by End User 2024 & 2032
- Figure 37: Asia LPWAN Market Revenue Share (%), by End User 2024 & 2032
- Figure 38: Asia LPWAN Market Revenue (Million), by Application 2024 & 2032
- Figure 39: Asia LPWAN Market Revenue Share (%), by Application 2024 & 2032
- Figure 40: Asia LPWAN Market Revenue (Million), by Country 2024 & 2032
- Figure 41: Asia LPWAN Market Revenue Share (%), by Country 2024 & 2032
- Figure 42: Australia and New Zealand LPWAN Market Revenue (Million), by Type 2024 & 2032
- Figure 43: Australia and New Zealand LPWAN Market Revenue Share (%), by Type 2024 & 2032
- Figure 44: Australia and New Zealand LPWAN Market Revenue (Million), by Service 2024 & 2032
- Figure 45: Australia and New Zealand LPWAN Market Revenue Share (%), by Service 2024 & 2032
- Figure 46: Australia and New Zealand LPWAN Market Revenue (Million), by End User 2024 & 2032
- Figure 47: Australia and New Zealand LPWAN Market Revenue Share (%), by End User 2024 & 2032
- Figure 48: Australia and New Zealand LPWAN Market Revenue (Million), by Application 2024 & 2032
- Figure 49: Australia and New Zealand LPWAN Market Revenue Share (%), by Application 2024 & 2032
- Figure 50: Australia and New Zealand LPWAN Market Revenue (Million), by Country 2024 & 2032
- Figure 51: Australia and New Zealand LPWAN Market Revenue Share (%), by Country 2024 & 2032
- Figure 52: Latin America LPWAN Market Revenue (Million), by Type 2024 & 2032
- Figure 53: Latin America LPWAN Market Revenue Share (%), by Type 2024 & 2032
- Figure 54: Latin America LPWAN Market Revenue (Million), by Service 2024 & 2032
- Figure 55: Latin America LPWAN Market Revenue Share (%), by Service 2024 & 2032
- Figure 56: Latin America LPWAN Market Revenue (Million), by End User 2024 & 2032
- Figure 57: Latin America LPWAN Market Revenue Share (%), by End User 2024 & 2032
- Figure 58: Latin America LPWAN Market Revenue (Million), by Application 2024 & 2032
- Figure 59: Latin America LPWAN Market Revenue Share (%), by Application 2024 & 2032
- Figure 60: Latin America LPWAN Market Revenue (Million), by Country 2024 & 2032
- Figure 61: Latin America LPWAN Market Revenue Share (%), by Country 2024 & 2032
- Figure 62: Middle East and Africa LPWAN Market Revenue (Million), by Type 2024 & 2032
- Figure 63: Middle East and Africa LPWAN Market Revenue Share (%), by Type 2024 & 2032
- Figure 64: Middle East and Africa LPWAN Market Revenue (Million), by Service 2024 & 2032
- Figure 65: Middle East and Africa LPWAN Market Revenue Share (%), by Service 2024 & 2032
- Figure 66: Middle East and Africa LPWAN Market Revenue (Million), by End User 2024 & 2032
- Figure 67: Middle East and Africa LPWAN Market Revenue Share (%), by End User 2024 & 2032
- Figure 68: Middle East and Africa LPWAN Market Revenue (Million), by Application 2024 & 2032
- Figure 69: Middle East and Africa LPWAN Market Revenue Share (%), by Application 2024 & 2032
- Figure 70: Middle East and Africa LPWAN Market Revenue (Million), by Country 2024 & 2032
- Figure 71: Middle East and Africa LPWAN Market Revenue Share (%), by Country 2024 & 2032
List of Tables
- Table 1: Global LPWAN Market Revenue Million Forecast, by Region 2019 & 2032
- Table 2: Global LPWAN Market Revenue Million Forecast, by Type 2019 & 2032
- Table 3: Global LPWAN Market Revenue Million Forecast, by Service 2019 & 2032
- Table 4: Global LPWAN Market Revenue Million Forecast, by End User 2019 & 2032
- Table 5: Global LPWAN Market Revenue Million Forecast, by Application 2019 & 2032
- Table 6: Global LPWAN Market Revenue Million Forecast, by Region 2019 & 2032
- Table 7: Global LPWAN Market Revenue Million Forecast, by Country 2019 & 2032
- Table 8: LPWAN Market Revenue (Million) Forecast, by Application 2019 & 2032
- Table 9: Global LPWAN Market Revenue Million Forecast, by Country 2019 & 2032
- Table 10: LPWAN Market Revenue (Million) Forecast, by Application 2019 & 2032
- Table 11: Global LPWAN Market Revenue Million Forecast, by Country 2019 & 2032
- Table 12: LPWAN Market Revenue (Million) Forecast, by Application 2019 & 2032
- Table 13: Global LPWAN Market Revenue Million Forecast, by Country 2019 & 2032
- Table 14: LPWAN Market Revenue (Million) Forecast, by Application 2019 & 2032
- Table 15: Global LPWAN Market Revenue Million Forecast, by Country 2019 & 2032
- Table 16: LPWAN Market Revenue (Million) Forecast, by Application 2019 & 2032
- Table 17: Global LPWAN Market Revenue Million Forecast, by Type 2019 & 2032
- Table 18: Global LPWAN Market Revenue Million Forecast, by Service 2019 & 2032
- Table 19: Global LPWAN Market Revenue Million Forecast, by End User 2019 & 2032
- Table 20: Global LPWAN Market Revenue Million Forecast, by Application 2019 & 2032
- Table 21: Global LPWAN Market Revenue Million Forecast, by Country 2019 & 2032
- Table 22: Global LPWAN Market Revenue Million Forecast, by Type 2019 & 2032
- Table 23: Global LPWAN Market Revenue Million Forecast, by Service 2019 & 2032
- Table 24: Global LPWAN Market Revenue Million Forecast, by End User 2019 & 2032
- Table 25: Global LPWAN Market Revenue Million Forecast, by Application 2019 & 2032
- Table 26: Global LPWAN Market Revenue Million Forecast, by Country 2019 & 2032
- Table 27: Global LPWAN Market Revenue Million Forecast, by Type 2019 & 2032
- Table 28: Global LPWAN Market Revenue Million Forecast, by Service 2019 & 2032
- Table 29: Global LPWAN Market Revenue Million Forecast, by End User 2019 & 2032
- Table 30: Global LPWAN Market Revenue Million Forecast, by Application 2019 & 2032
- Table 31: Global LPWAN Market Revenue Million Forecast, by Country 2019 & 2032
- Table 32: Global LPWAN Market Revenue Million Forecast, by Type 2019 & 2032
- Table 33: Global LPWAN Market Revenue Million Forecast, by Service 2019 & 2032
- Table 34: Global LPWAN Market Revenue Million Forecast, by End User 2019 & 2032
- Table 35: Global LPWAN Market Revenue Million Forecast, by Application 2019 & 2032
- Table 36: Global LPWAN Market Revenue Million Forecast, by Country 2019 & 2032
- Table 37: Global LPWAN Market Revenue Million Forecast, by Type 2019 & 2032
- Table 38: Global LPWAN Market Revenue Million Forecast, by Service 2019 & 2032
- Table 39: Global LPWAN Market Revenue Million Forecast, by End User 2019 & 2032
- Table 40: Global LPWAN Market Revenue Million Forecast, by Application 2019 & 2032
- Table 41: Global LPWAN Market Revenue Million Forecast, by Country 2019 & 2032
- Table 42: Global LPWAN Market Revenue Million Forecast, by Type 2019 & 2032
- Table 43: Global LPWAN Market Revenue Million Forecast, by Service 2019 & 2032
- Table 44: Global LPWAN Market Revenue Million Forecast, by End User 2019 & 2032
- Table 45: Global LPWAN Market Revenue Million Forecast, by Application 2019 & 2032
- Table 46: Global LPWAN Market Revenue Million Forecast, by Country 2019 & 2032
Frequently Asked Questions
1. What is the projected Compound Annual Growth Rate (CAGR) of the LPWAN Market?
The projected CAGR is approximately 52.05%.
2. Which companies are prominent players in the LPWAN Market?
Key companies in the market include Semtech Corporation, Cisco Systems Inc, Huawei Technologies Co Ltd, Loriot AG*List Not Exhaustive, AT&T Inc, Sigfox SA, Ingenu Inc, Vodafone Group PLC.
3. What are the main segments of the LPWAN Market?
The market segments include Type, Service, End User, Application.
4. Can you provide details about the market size?
The market size is estimated to be USD 32.01 Million as of 2022.
5. What are some drivers contributing to market growth?
Rising Need of Long Range Connectivity Between Devices5.1.2 5G Technology to Drive the Market Growth.
6. What are the notable trends driving market growth?
5G Technology to Drive the Market Growth.
7. Are there any restraints impacting market growth?
Privacy and Security Concerns.
8. Can you provide examples of recent developments in the market?
April 2023: Semtech Corporation announced the expansion of its PerSe product portfolio with a brand-new integrated circuit (IC) that is intended for 5G mobile devices is being released. With the aid of Semtech's PerSe technology, advanced radio frequency (RF) control may be implemented on end devices like smartphones. Designers may optimize RF performance, improve connectivity, and ensure higher compliance with worldwide specific absorption rate (SAR) criteria for 5G-enabled consumer products with the PerSe connects SX9376.
9. What pricing options are available for accessing the report?
Pricing options include single-user, multi-user, and enterprise licenses priced at USD 4750, USD 5250, and USD 8750 respectively.
10. Is the market size provided in terms of value or volume?
The market size is provided in terms of value, measured in Million.
11. Are there any specific market keywords associated with the report?
Yes, the market keyword associated with the report is "LPWAN Market," which aids in identifying and referencing the specific market segment covered.
12. How do I determine which pricing option suits my needs best?
The pricing options vary based on user requirements and access needs. Individual users may opt for single-user licenses, while businesses requiring broader access may choose multi-user or enterprise licenses for cost-effective access to the report.
13. Are there any additional resources or data provided in the LPWAN Market report?
While the report offers comprehensive insights, it's advisable to review the specific contents or supplementary materials provided to ascertain if additional resources or data are available.
14. How can I stay updated on further developments or reports in the LPWAN Market?
To stay informed about further developments, trends, and reports in the LPWAN Market, consider subscribing to industry newsletters, following relevant companies and organizations, or regularly checking reputable industry news sources and publications.
Methodology
Step 1 - Identification of Relevant Samples Size from Population Database


Step 2 - Approaches for Defining Global Market Size (Value, Volume* & Price*)

Note*: In applicable scenarios
Step 3 - Data Sources
Primary Research
- Web Analytics
- Survey Reports
- Research Institute
- Latest Research Reports
- Opinion Leaders
Secondary Research
- Annual Reports
- White Paper
- Latest Press Release
- Industry Association
- Paid Database
- Investor Presentations

Step 4 - Data Triangulation
Involves using different sources of information in order to increase the validity of a study
These sources are likely to be stakeholders in a program - participants, other researchers, program staff, other community members, and so on.
Then we put all data in single framework & apply various statistical tools to find out the dynamic on the market.
During the analysis stage, feedback from the stakeholder groups would be compared to determine areas of agreement as well as areas of divergence
