

Key Insights
The LNG (Liquefied Natural Gas) as a fuel industry is experiencing robust growth, driven by increasing environmental concerns and the need for cleaner transportation and power generation solutions. A CAGR exceeding 8% indicates a significant expansion of this market, projected to reach substantial value by 2033. Key drivers include stringent emission regulations globally pushing a shift towards cleaner fuels, coupled with growing demand from the maritime sector (LNG bunkering) and power generation facilities seeking to reduce their carbon footprint. The expanding infrastructure supporting LNG transportation and distribution further fuels market expansion. Significant players like TotalEnergies, ExxonMobil, and Shell are actively investing in LNG infrastructure and supply chains, solidifying their market positions. Regional growth varies, with North America and Asia-Pacific expected to be leading contributors due to robust energy demands and supportive governmental policies. However, potential restraints include price volatility of natural gas, the high initial investment required for LNG infrastructure development, and the ongoing need for technological advancements to enhance LNG bunkering efficiency and safety.
While challenges exist, the long-term outlook remains positive. Continued investment in research and development, coupled with supportive government initiatives aimed at reducing greenhouse gas emissions, are expected to mitigate some of the restraints. The increasing adoption of LNG as a fuel in heavy-duty vehicles, especially in long-haul trucking and shipping, promises further market growth. Moreover, the expansion of LNG bunkering facilities worldwide is critical for the growth of the maritime sector's adoption of LNG as fuel. This concerted effort from both public and private sectors to transition towards cleaner energy sources is expected to maintain the significant growth trajectory of the LNG as a fuel market throughout the forecast period. The market segmentation, focusing on transportation, power generation, and other industrial applications, offers various avenues for strategic market entry and growth.
LNG as a Fuel: A Comprehensive Market Report (2019-2033)
Unlocking the Potential of Liquefied Natural Gas: A Deep Dive into Market Dynamics, Trends, and Future Growth
This comprehensive report provides an in-depth analysis of the LNG as a fuel industry, offering invaluable insights for stakeholders seeking to navigate this dynamic market. Covering the period from 2019 to 2033, with a focus on 2025, this report examines market concentration, leading players, technological advancements, and future growth opportunities. With a detailed examination of key segments – Transportation and Power Generation – this report is essential for strategic decision-making and investment planning. The report utilizes extensive data analysis to forecast market trends and identify potential challenges and opportunities within the industry. Millions are used as the unit for all values.
LNG as a Fuel Industry Market Dynamics & Concentration
This section analyzes the competitive landscape of the LNG as a fuel industry, examining market concentration, innovation drivers, regulatory frameworks, product substitutes, end-user trends, and mergers & acquisitions (M&A) activities. The study period covers 2019-2033, with 2025 serving as the base and estimated year.
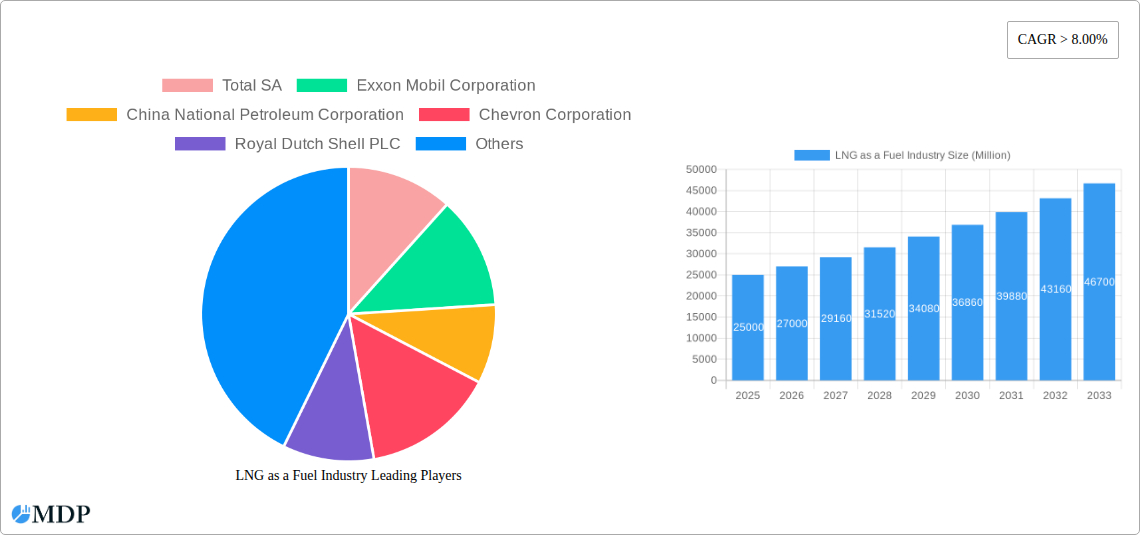
Market Concentration: The LNG as a fuel market exhibits a moderately concentrated structure, with a few major players controlling a significant share. In 2025, the top five companies – Total SA, Exxon Mobil Corporation, China National Petroleum Corporation, Chevron Corporation, and Royal Dutch Shell PLC – are estimated to hold approximately xx% of the global market share. Smaller players compete intensely in niche segments.
Innovation Drivers: Technological advancements in liquefaction, transportation, and storage technologies are driving industry innovation. The development of efficient and cost-effective LNG bunkering infrastructure is a key driver of market expansion.
Regulatory Frameworks: Government regulations aimed at reducing greenhouse gas emissions and promoting cleaner energy sources are creating a favorable environment for LNG adoption. However, varying regulatory landscapes across different regions present challenges for market expansion.
Product Substitutes: Competition from other fuels, such as diesel and biofuels, along with the rise of electric vehicles, poses a challenge to LNG adoption. The market share of LNG as a transportation fuel faces competition from these alternatives, and the report includes an analysis of the competitive pressure.
End-User Trends: The increasing demand for cleaner and more efficient fuels in transportation and power generation is driving adoption of LNG, particularly in regions with stringent emission regulations.
M&A Activities: The number of M&A deals in the LNG as a fuel industry has increased in recent years. An estimated xx deals occurred between 2019 and 2024, reflecting the industry's consolidation and growth. This consolidation is expected to impact market share and pricing dynamics.
LNG as a Fuel Industry Industry Trends & Analysis
This section delves into the key trends shaping the LNG as a fuel industry. We will analyze market growth drivers, technological disruptions, consumer preferences, and competitive dynamics. The analysis spans the period from 2019 to 2033, with a focus on the forecast period (2025-2033).
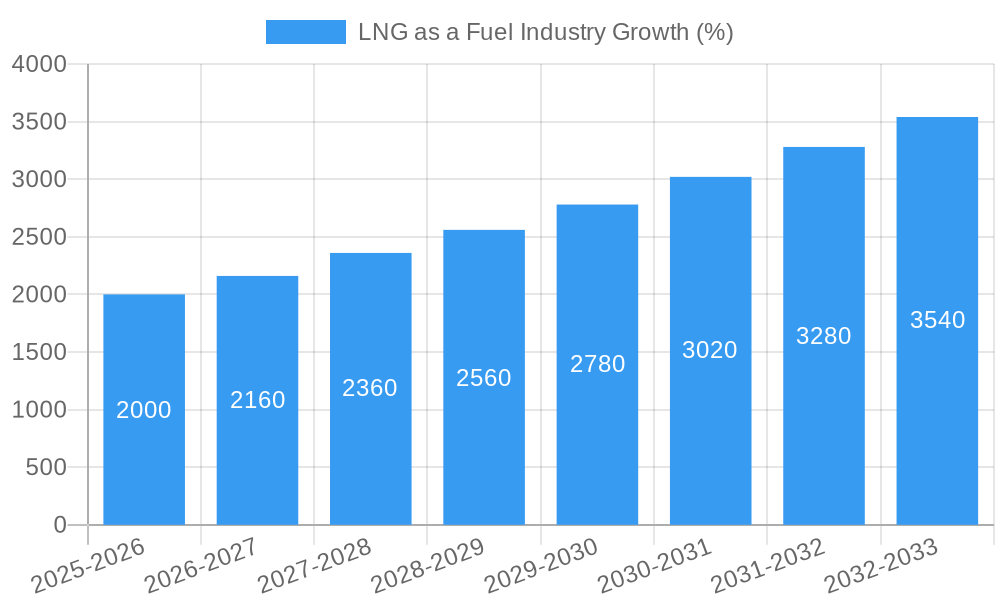
The global LNG as a fuel market is expected to exhibit a Compound Annual Growth Rate (CAGR) of xx% during the forecast period (2025-2033), driven by several factors. Increased investments in LNG infrastructure, particularly in emerging economies, coupled with supportive government policies promoting cleaner fuel sources, are pivotal contributors to this growth. The market penetration of LNG as a fuel in the transportation sector is projected to reach xx% by 2033, while power generation's share is estimated to account for xx% of the total market. The growing demand from the maritime sector, spurred by the implementation of stricter environmental regulations (like the IMO 2020 sulfur cap), significantly contributes to this expansion. Technological advancements, including improved liquefaction and storage techniques, are also boosting efficiency and competitiveness. Furthermore, strategic partnerships between key industry players are further accelerating the adoption of LNG as a sustainable fuel source.
Leading Markets & Segments in LNG as a Fuel Industry
This section identifies the leading regions, countries, and segments within the LNG as a fuel industry. The analysis focuses on the application segments of Transportation and Power Generation.
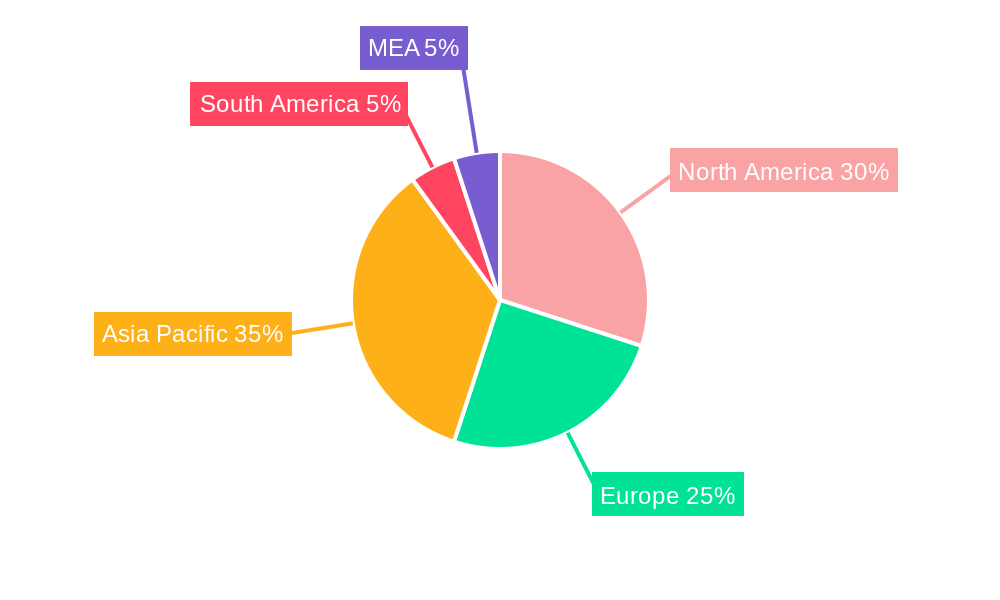
Dominant Regions and Countries:
Asia-Pacific: This region is expected to be the dominant market for LNG as a fuel, driven by rapid industrialization, rising energy demand, and supportive government policies. China and India are key contributors to this regional growth. Factors contributing to this dominance include readily available natural gas resources, ongoing infrastructure development for LNG import and distribution, and expanding economies that require consistent energy sources.
Europe: The European Union's focus on reducing greenhouse gas emissions and promoting energy security is driving significant growth in LNG imports and utilization. Strict environmental regulations also encourage adoption.
North America: While a significant producer of LNG, North America's adoption of LNG as a transportation fuel is steadily growing, driven by the availability of domestic resources and the expanding network of LNG bunkering facilities.
Dominant Segments:
Power Generation: LNG is becoming an increasingly important fuel source for power generation, particularly in regions where access to natural gas pipelines is limited. The market share of LNG in power generation is estimated at xx%. This segment benefits from the relative affordability of LNG compared to other fossil fuels and lower emissions relative to coal.
Transportation: The marine sector is a major driver of growth in the LNG transportation segment, with a continuous increase in the number of LNG-powered vessels. The market segment has seen a xx% increase in the adoption of LNG as a bunker fuel between the historical and estimated periods. Key drivers include the implementation of IMO 2020 regulations limiting sulfur emissions. The growth is also influenced by cost savings and lower environmental impact compared to traditional fuels. Road transportation adoption is comparatively slower due to infrastructure limitations.
Major LNG Bunkering Facilities around the World (as of 2019): The report will include a detailed map and list of major LNG bunkering facilities globally as of 2019, analyzing their geographic distribution and impact on market development. The xx Million USD investment in new bunkering facilities is further strengthening market adoption.
LNG as a Fuel Industry Product Developments
The LNG as a fuel industry is witnessing significant product innovations, driven by the demand for enhanced efficiency, safety, and environmental sustainability. Developments in liquefaction and regasification technologies have resulted in improved energy efficiency and reduced emissions. Advancements in LNG storage and transportation technologies are making the fuel more accessible and cost-effective. These improvements reduce overall costs and improve the logistics and safety around the use of the fuel. Moreover, new applications of LNG in various sectors, including heavy-duty trucking and railway transportation, are expanding the overall market potential. These innovations focus on reducing costs while maintaining a safe and effective supply chain.
Key Drivers of LNG as a Fuel Industry Growth
Several key factors are driving the growth of the LNG as a fuel industry:
Stringent Environmental Regulations: Governments worldwide are implementing increasingly stringent emission regulations to combat climate change, making LNG an attractive alternative to higher-emission fuels.
Growing Energy Demand: The global energy demand is continuously increasing, pushing the need for diversified and reliable energy sources. LNG plays a crucial role here.
Technological Advancements: Technological improvements in liquefaction, transportation, storage, and utilization technologies are making LNG more cost-effective and efficient.
Economic Incentives: Governments are offering economic incentives such as subsidies and tax breaks to encourage the adoption of LNG as a fuel.
Challenges in the LNG as a Fuel Industry Market
The LNG as a fuel industry faces several challenges:
Infrastructure Development: The development of adequate LNG infrastructure, such as terminals, pipelines, and bunkering facilities, is crucial for widespread adoption, but represents a significant capital investment. A lack of proper infrastructure could restrict market growth by approximately xx Million USD annually.
Price Volatility: The price of LNG is subject to volatility, potentially impacting its competitiveness against alternative fuels. The unpredictable pricing can lead to an xx Million USD loss for projects.
Safety Concerns: Concerns related to the transportation and handling of LNG need to be addressed to ensure safe operations. Safety regulations are crucial and under-development, impacting market expansion.
Competition from Other Fuels: LNG faces competition from other alternative fuels, including electricity and hydrogen. This impacts projected growth by an estimated xx Million USD.
Emerging Opportunities in LNG as a Fuel Industry
The LNG as a fuel industry presents several emerging opportunities for growth:
Expansion into New Markets: The exploration of new markets, particularly in developing economies with growing energy demand, holds significant potential.
Technological Advancements: Ongoing research and development in LNG technologies will lead to further cost reductions and improved efficiency.
Strategic Partnerships: Strategic alliances and collaborations between various industry stakeholders can accelerate market expansion.
Development of New Applications: Exploring new applications of LNG in different sectors, such as heavy-duty trucking and rail transport, will help further expand its utilization.
Leading Players in the LNG as a Fuel Industry Sector
- TotalEnergies SE
- Exxon Mobil Corporation
- China National Petroleum Corporation
- Chevron Corporation
- Royal Dutch Shell PLC
- Eni SpA
- BP PLC
- ConocoPhillips
Key Milestones in LNG as a Fuel Industry Industry
- 2019: IMO 2020 sulfur cap implemented, significantly boosting demand for LNG as marine fuel.
- 2020: Several major LNG bunkering facilities commenced operations globally.
- 2021: Significant investments made in LNG infrastructure projects across Asia and Europe.
- 2022: Launch of several new LNG-powered vessels.
- 2023-2024: Continued development of LNG as a fuel for heavy-duty transportation.
Strategic Outlook for LNG as a Fuel Industry Market
The future of the LNG as a fuel market is bright, driven by growing demand for cleaner energy, technological innovations, and supportive government policies. Strategic investments in LNG infrastructure, technological advancements in LNG production, storage, and transportation, and effective marketing campaigns are vital to ensure a significant and sustainable increase in market penetration. The long-term outlook is particularly positive for emerging economies experiencing rapid industrialization. However, sustained efforts to address the challenges of price volatility, infrastructure development, and competition from other fuels are crucial for realizing the full market potential.
LNG as a Fuel Industry Segmentation
-
1. Application
-
1.1. Transportation
- 1.1.1. Market Overview
- 1.1.2. LNG as a Bunkering Fuel Demand Forecast, till 2025
- 1.1.3. Number o
- 1.1.4. Major LN
-
1.2. Power Generation
- 1.2.1. Key LNG
-
1.1. Transportation
LNG as a Fuel Industry Segmentation By Geography
- 1. North America
- 2. Europe
- 3. Asia Pacific
- 4. South America
- 5. Middle East and Africa
LNG as a Fuel Industry REPORT HIGHLIGHTS
| Aspects | Details |
|---|---|
| Study Period | 2019-2033 |
| Base Year | 2024 |
| Estimated Year | 2025 |
| Forecast Period | 2025-2033 |
| Historical Period | 2019-2024 |
| Growth Rate | CAGR of > 8.00% from 2019-2033 |
| Segmentation |
|
Table of Contents
- 1. Introduction
- 1.1. Research Scope
- 1.2. Market Segmentation
- 1.3. Research Methodology
- 1.4. Definitions and Assumptions
- 2. Executive Summary
- 2.1. Introduction
- 3. Market Dynamics
- 3.1. Introduction
- 3.2. Market Drivers
- 3.2.1. 4.; Increasing Demand from Industrial Applications4.; Growing Infrastructure Across the World
- 3.3. Market Restrains
- 3.3.1. 4.; A Rise In Concerns Related To Carbon Emissions And A Shift Towards Electric Vehicles And Renewable Sources Of Energy
- 3.4. Market Trends
- 3.4.1. Transportation Application to Dominate the Market
- 4. Market Factor Analysis
- 4.1. Porters Five Forces
- 4.2. Supply/Value Chain
- 4.3. PESTEL analysis
- 4.4. Market Entropy
- 4.5. Patent/Trademark Analysis
- 5. Global LNG as a Fuel Industry Analysis, Insights and Forecast, 2019-2031
- 5.1. Market Analysis, Insights and Forecast - by Application
- 5.1.1. Transportation
- 5.1.1.1. Market Overview
- 5.1.1.2. LNG as a Bunkering Fuel Demand Forecast, till 2025
- 5.1.1.3. Number o
- 5.1.1.4. Major LN
- 5.1.2. Power Generation
- 5.1.2.1. Key LNG
- 5.1.1. Transportation
- 5.2. Market Analysis, Insights and Forecast - by Region
- 5.2.1. North America
- 5.2.2. Europe
- 5.2.3. Asia Pacific
- 5.2.4. South America
- 5.2.5. Middle East and Africa
- 5.1. Market Analysis, Insights and Forecast - by Application
- 6. North America LNG as a Fuel Industry Analysis, Insights and Forecast, 2019-2031
- 6.1. Market Analysis, Insights and Forecast - by Application
- 6.1.1. Transportation
- 6.1.1.1. Market Overview
- 6.1.1.2. LNG as a Bunkering Fuel Demand Forecast, till 2025
- 6.1.1.3. Number o
- 6.1.1.4. Major LN
- 6.1.2. Power Generation
- 6.1.2.1. Key LNG
- 6.1.1. Transportation
- 6.1. Market Analysis, Insights and Forecast - by Application
- 7. Europe LNG as a Fuel Industry Analysis, Insights and Forecast, 2019-2031
- 7.1. Market Analysis, Insights and Forecast - by Application
- 7.1.1. Transportation
- 7.1.1.1. Market Overview
- 7.1.1.2. LNG as a Bunkering Fuel Demand Forecast, till 2025
- 7.1.1.3. Number o
- 7.1.1.4. Major LN
- 7.1.2. Power Generation
- 7.1.2.1. Key LNG
- 7.1.1. Transportation
- 7.1. Market Analysis, Insights and Forecast - by Application
- 8. Asia Pacific LNG as a Fuel Industry Analysis, Insights and Forecast, 2019-2031
- 8.1. Market Analysis, Insights and Forecast - by Application
- 8.1.1. Transportation
- 8.1.1.1. Market Overview
- 8.1.1.2. LNG as a Bunkering Fuel Demand Forecast, till 2025
- 8.1.1.3. Number o
- 8.1.1.4. Major LN
- 8.1.2. Power Generation
- 8.1.2.1. Key LNG
- 8.1.1. Transportation
- 8.1. Market Analysis, Insights and Forecast - by Application
- 9. South America LNG as a Fuel Industry Analysis, Insights and Forecast, 2019-2031
- 9.1. Market Analysis, Insights and Forecast - by Application
- 9.1.1. Transportation
- 9.1.1.1. Market Overview
- 9.1.1.2. LNG as a Bunkering Fuel Demand Forecast, till 2025
- 9.1.1.3. Number o
- 9.1.1.4. Major LN
- 9.1.2. Power Generation
- 9.1.2.1. Key LNG
- 9.1.1. Transportation
- 9.1. Market Analysis, Insights and Forecast - by Application
- 10. Middle East and Africa LNG as a Fuel Industry Analysis, Insights and Forecast, 2019-2031
- 10.1. Market Analysis, Insights and Forecast - by Application
- 10.1.1. Transportation
- 10.1.1.1. Market Overview
- 10.1.1.2. LNG as a Bunkering Fuel Demand Forecast, till 2025
- 10.1.1.3. Number o
- 10.1.1.4. Major LN
- 10.1.2. Power Generation
- 10.1.2.1. Key LNG
- 10.1.1. Transportation
- 10.1. Market Analysis, Insights and Forecast - by Application
- 11. North America LNG as a Fuel Industry Analysis, Insights and Forecast, 2019-2031
- 11.1. Market Analysis, Insights and Forecast - By Country/Sub-region
- 11.1.1 United States
- 11.1.2 Canada
- 11.1.3 Mexico
- 12. Europe LNG as a Fuel Industry Analysis, Insights and Forecast, 2019-2031
- 12.1. Market Analysis, Insights and Forecast - By Country/Sub-region
- 12.1.1 Germany
- 12.1.2 United Kingdom
- 12.1.3 France
- 12.1.4 Spain
- 12.1.5 Italy
- 12.1.6 Spain
- 12.1.7 Belgium
- 12.1.8 Netherland
- 12.1.9 Nordics
- 12.1.10 Rest of Europe
- 13. Asia Pacific LNG as a Fuel Industry Analysis, Insights and Forecast, 2019-2031
- 13.1. Market Analysis, Insights and Forecast - By Country/Sub-region
- 13.1.1 China
- 13.1.2 Japan
- 13.1.3 India
- 13.1.4 South Korea
- 13.1.5 Southeast Asia
- 13.1.6 Australia
- 13.1.7 Indonesia
- 13.1.8 Phillipes
- 13.1.9 Singapore
- 13.1.10 Thailandc
- 13.1.11 Rest of Asia Pacific
- 14. South America LNG as a Fuel Industry Analysis, Insights and Forecast, 2019-2031
- 14.1. Market Analysis, Insights and Forecast - By Country/Sub-region
- 14.1.1 Brazil
- 14.1.2 Argentina
- 14.1.3 Peru
- 14.1.4 Chile
- 14.1.5 Colombia
- 14.1.6 Ecuador
- 14.1.7 Venezuela
- 14.1.8 Rest of South America
- 15. North America LNG as a Fuel Industry Analysis, Insights and Forecast, 2019-2031
- 15.1. Market Analysis, Insights and Forecast - By Country/Sub-region
- 15.1.1 United States
- 15.1.2 Canada
- 15.1.3 Mexico
- 16. MEA LNG as a Fuel Industry Analysis, Insights and Forecast, 2019-2031
- 16.1. Market Analysis, Insights and Forecast - By Country/Sub-region
- 16.1.1 United Arab Emirates
- 16.1.2 Saudi Arabia
- 16.1.3 South Africa
- 16.1.4 Rest of Middle East and Africa
- 17. Competitive Analysis
- 17.1. Global Market Share Analysis 2024
- 17.2. Company Profiles
- 17.2.1 Total SA
- 17.2.1.1. Overview
- 17.2.1.2. Products
- 17.2.1.3. SWOT Analysis
- 17.2.1.4. Recent Developments
- 17.2.1.5. Financials (Based on Availability)
- 17.2.2 Exxon Mobil Corporation
- 17.2.2.1. Overview
- 17.2.2.2. Products
- 17.2.2.3. SWOT Analysis
- 17.2.2.4. Recent Developments
- 17.2.2.5. Financials (Based on Availability)
- 17.2.3 China National Petroleum Corporation
- 17.2.3.1. Overview
- 17.2.3.2. Products
- 17.2.3.3. SWOT Analysis
- 17.2.3.4. Recent Developments
- 17.2.3.5. Financials (Based on Availability)
- 17.2.4 Chevron Corporation
- 17.2.4.1. Overview
- 17.2.4.2. Products
- 17.2.4.3. SWOT Analysis
- 17.2.4.4. Recent Developments
- 17.2.4.5. Financials (Based on Availability)
- 17.2.5 Royal Dutch Shell PLC
- 17.2.5.1. Overview
- 17.2.5.2. Products
- 17.2.5.3. SWOT Analysis
- 17.2.5.4. Recent Developments
- 17.2.5.5. Financials (Based on Availability)
- 17.2.6 Eni SpA*List Not Exhaustive
- 17.2.6.1. Overview
- 17.2.6.2. Products
- 17.2.6.3. SWOT Analysis
- 17.2.6.4. Recent Developments
- 17.2.6.5. Financials (Based on Availability)
- 17.2.7 BP PLC
- 17.2.7.1. Overview
- 17.2.7.2. Products
- 17.2.7.3. SWOT Analysis
- 17.2.7.4. Recent Developments
- 17.2.7.5. Financials (Based on Availability)
- 17.2.8 Conoco Philips
- 17.2.8.1. Overview
- 17.2.8.2. Products
- 17.2.8.3. SWOT Analysis
- 17.2.8.4. Recent Developments
- 17.2.8.5. Financials (Based on Availability)
- 17.2.1 Total SA
List of Figures
- Figure 1: Global LNG as a Fuel Industry Revenue Breakdown (Million, %) by Region 2024 & 2032
- Figure 2: Global LNG as a Fuel Industry Volume Breakdown (metric tonnes, %) by Region 2024 & 2032
- Figure 3: North America LNG as a Fuel Industry Revenue (Million), by Country 2024 & 2032
- Figure 4: North America LNG as a Fuel Industry Volume (metric tonnes), by Country 2024 & 2032
- Figure 5: North America LNG as a Fuel Industry Revenue Share (%), by Country 2024 & 2032
- Figure 6: North America LNG as a Fuel Industry Volume Share (%), by Country 2024 & 2032
- Figure 7: Europe LNG as a Fuel Industry Revenue (Million), by Country 2024 & 2032
- Figure 8: Europe LNG as a Fuel Industry Volume (metric tonnes), by Country 2024 & 2032
- Figure 9: Europe LNG as a Fuel Industry Revenue Share (%), by Country 2024 & 2032
- Figure 10: Europe LNG as a Fuel Industry Volume Share (%), by Country 2024 & 2032
- Figure 11: Asia Pacific LNG as a Fuel Industry Revenue (Million), by Country 2024 & 2032
- Figure 12: Asia Pacific LNG as a Fuel Industry Volume (metric tonnes), by Country 2024 & 2032
- Figure 13: Asia Pacific LNG as a Fuel Industry Revenue Share (%), by Country 2024 & 2032
- Figure 14: Asia Pacific LNG as a Fuel Industry Volume Share (%), by Country 2024 & 2032
- Figure 15: South America LNG as a Fuel Industry Revenue (Million), by Country 2024 & 2032
- Figure 16: South America LNG as a Fuel Industry Volume (metric tonnes), by Country 2024 & 2032
- Figure 17: South America LNG as a Fuel Industry Revenue Share (%), by Country 2024 & 2032
- Figure 18: South America LNG as a Fuel Industry Volume Share (%), by Country 2024 & 2032
- Figure 19: North America LNG as a Fuel Industry Revenue (Million), by Country 2024 & 2032
- Figure 20: North America LNG as a Fuel Industry Volume (metric tonnes), by Country 2024 & 2032
- Figure 21: North America LNG as a Fuel Industry Revenue Share (%), by Country 2024 & 2032
- Figure 22: North America LNG as a Fuel Industry Volume Share (%), by Country 2024 & 2032
- Figure 23: MEA LNG as a Fuel Industry Revenue (Million), by Country 2024 & 2032
- Figure 24: MEA LNG as a Fuel Industry Volume (metric tonnes), by Country 2024 & 2032
- Figure 25: MEA LNG as a Fuel Industry Revenue Share (%), by Country 2024 & 2032
- Figure 26: MEA LNG as a Fuel Industry Volume Share (%), by Country 2024 & 2032
- Figure 27: North America LNG as a Fuel Industry Revenue (Million), by Application 2024 & 2032
- Figure 28: North America LNG as a Fuel Industry Volume (metric tonnes), by Application 2024 & 2032
- Figure 29: North America LNG as a Fuel Industry Revenue Share (%), by Application 2024 & 2032
- Figure 30: North America LNG as a Fuel Industry Volume Share (%), by Application 2024 & 2032
- Figure 31: North America LNG as a Fuel Industry Revenue (Million), by Country 2024 & 2032
- Figure 32: North America LNG as a Fuel Industry Volume (metric tonnes), by Country 2024 & 2032
- Figure 33: North America LNG as a Fuel Industry Revenue Share (%), by Country 2024 & 2032
- Figure 34: North America LNG as a Fuel Industry Volume Share (%), by Country 2024 & 2032
- Figure 35: Europe LNG as a Fuel Industry Revenue (Million), by Application 2024 & 2032
- Figure 36: Europe LNG as a Fuel Industry Volume (metric tonnes), by Application 2024 & 2032
- Figure 37: Europe LNG as a Fuel Industry Revenue Share (%), by Application 2024 & 2032
- Figure 38: Europe LNG as a Fuel Industry Volume Share (%), by Application 2024 & 2032
- Figure 39: Europe LNG as a Fuel Industry Revenue (Million), by Country 2024 & 2032
- Figure 40: Europe LNG as a Fuel Industry Volume (metric tonnes), by Country 2024 & 2032
- Figure 41: Europe LNG as a Fuel Industry Revenue Share (%), by Country 2024 & 2032
- Figure 42: Europe LNG as a Fuel Industry Volume Share (%), by Country 2024 & 2032
- Figure 43: Asia Pacific LNG as a Fuel Industry Revenue (Million), by Application 2024 & 2032
- Figure 44: Asia Pacific LNG as a Fuel Industry Volume (metric tonnes), by Application 2024 & 2032
- Figure 45: Asia Pacific LNG as a Fuel Industry Revenue Share (%), by Application 2024 & 2032
- Figure 46: Asia Pacific LNG as a Fuel Industry Volume Share (%), by Application 2024 & 2032
- Figure 47: Asia Pacific LNG as a Fuel Industry Revenue (Million), by Country 2024 & 2032
- Figure 48: Asia Pacific LNG as a Fuel Industry Volume (metric tonnes), by Country 2024 & 2032
- Figure 49: Asia Pacific LNG as a Fuel Industry Revenue Share (%), by Country 2024 & 2032
- Figure 50: Asia Pacific LNG as a Fuel Industry Volume Share (%), by Country 2024 & 2032
- Figure 51: South America LNG as a Fuel Industry Revenue (Million), by Application 2024 & 2032
- Figure 52: South America LNG as a Fuel Industry Volume (metric tonnes), by Application 2024 & 2032
- Figure 53: South America LNG as a Fuel Industry Revenue Share (%), by Application 2024 & 2032
- Figure 54: South America LNG as a Fuel Industry Volume Share (%), by Application 2024 & 2032
- Figure 55: South America LNG as a Fuel Industry Revenue (Million), by Country 2024 & 2032
- Figure 56: South America LNG as a Fuel Industry Volume (metric tonnes), by Country 2024 & 2032
- Figure 57: South America LNG as a Fuel Industry Revenue Share (%), by Country 2024 & 2032
- Figure 58: South America LNG as a Fuel Industry Volume Share (%), by Country 2024 & 2032
- Figure 59: Middle East and Africa LNG as a Fuel Industry Revenue (Million), by Application 2024 & 2032
- Figure 60: Middle East and Africa LNG as a Fuel Industry Volume (metric tonnes), by Application 2024 & 2032
- Figure 61: Middle East and Africa LNG as a Fuel Industry Revenue Share (%), by Application 2024 & 2032
- Figure 62: Middle East and Africa LNG as a Fuel Industry Volume Share (%), by Application 2024 & 2032
- Figure 63: Middle East and Africa LNG as a Fuel Industry Revenue (Million), by Country 2024 & 2032
- Figure 64: Middle East and Africa LNG as a Fuel Industry Volume (metric tonnes), by Country 2024 & 2032
- Figure 65: Middle East and Africa LNG as a Fuel Industry Revenue Share (%), by Country 2024 & 2032
- Figure 66: Middle East and Africa LNG as a Fuel Industry Volume Share (%), by Country 2024 & 2032
List of Tables
- Table 1: Global LNG as a Fuel Industry Revenue Million Forecast, by Region 2019 & 2032
- Table 2: Global LNG as a Fuel Industry Volume metric tonnes Forecast, by Region 2019 & 2032
- Table 3: Global LNG as a Fuel Industry Revenue Million Forecast, by Application 2019 & 2032
- Table 4: Global LNG as a Fuel Industry Volume metric tonnes Forecast, by Application 2019 & 2032
- Table 5: Global LNG as a Fuel Industry Revenue Million Forecast, by Region 2019 & 2032
- Table 6: Global LNG as a Fuel Industry Volume metric tonnes Forecast, by Region 2019 & 2032
- Table 7: Global LNG as a Fuel Industry Revenue Million Forecast, by Country 2019 & 2032
- Table 8: Global LNG as a Fuel Industry Volume metric tonnes Forecast, by Country 2019 & 2032
- Table 9: United States LNG as a Fuel Industry Revenue (Million) Forecast, by Application 2019 & 2032
- Table 10: United States LNG as a Fuel Industry Volume (metric tonnes) Forecast, by Application 2019 & 2032
- Table 11: Canada LNG as a Fuel Industry Revenue (Million) Forecast, by Application 2019 & 2032
- Table 12: Canada LNG as a Fuel Industry Volume (metric tonnes) Forecast, by Application 2019 & 2032
- Table 13: Mexico LNG as a Fuel Industry Revenue (Million) Forecast, by Application 2019 & 2032
- Table 14: Mexico LNG as a Fuel Industry Volume (metric tonnes) Forecast, by Application 2019 & 2032
- Table 15: Global LNG as a Fuel Industry Revenue Million Forecast, by Country 2019 & 2032
- Table 16: Global LNG as a Fuel Industry Volume metric tonnes Forecast, by Country 2019 & 2032
- Table 17: Germany LNG as a Fuel Industry Revenue (Million) Forecast, by Application 2019 & 2032
- Table 18: Germany LNG as a Fuel Industry Volume (metric tonnes) Forecast, by Application 2019 & 2032
- Table 19: United Kingdom LNG as a Fuel Industry Revenue (Million) Forecast, by Application 2019 & 2032
- Table 20: United Kingdom LNG as a Fuel Industry Volume (metric tonnes) Forecast, by Application 2019 & 2032
- Table 21: France LNG as a Fuel Industry Revenue (Million) Forecast, by Application 2019 & 2032
- Table 22: France LNG as a Fuel Industry Volume (metric tonnes) Forecast, by Application 2019 & 2032
- Table 23: Spain LNG as a Fuel Industry Revenue (Million) Forecast, by Application 2019 & 2032
- Table 24: Spain LNG as a Fuel Industry Volume (metric tonnes) Forecast, by Application 2019 & 2032
- Table 25: Italy LNG as a Fuel Industry Revenue (Million) Forecast, by Application 2019 & 2032
- Table 26: Italy LNG as a Fuel Industry Volume (metric tonnes) Forecast, by Application 2019 & 2032
- Table 27: Spain LNG as a Fuel Industry Revenue (Million) Forecast, by Application 2019 & 2032
- Table 28: Spain LNG as a Fuel Industry Volume (metric tonnes) Forecast, by Application 2019 & 2032
- Table 29: Belgium LNG as a Fuel Industry Revenue (Million) Forecast, by Application 2019 & 2032
- Table 30: Belgium LNG as a Fuel Industry Volume (metric tonnes) Forecast, by Application 2019 & 2032
- Table 31: Netherland LNG as a Fuel Industry Revenue (Million) Forecast, by Application 2019 & 2032
- Table 32: Netherland LNG as a Fuel Industry Volume (metric tonnes) Forecast, by Application 2019 & 2032
- Table 33: Nordics LNG as a Fuel Industry Revenue (Million) Forecast, by Application 2019 & 2032
- Table 34: Nordics LNG as a Fuel Industry Volume (metric tonnes) Forecast, by Application 2019 & 2032
- Table 35: Rest of Europe LNG as a Fuel Industry Revenue (Million) Forecast, by Application 2019 & 2032
- Table 36: Rest of Europe LNG as a Fuel Industry Volume (metric tonnes) Forecast, by Application 2019 & 2032
- Table 37: Global LNG as a Fuel Industry Revenue Million Forecast, by Country 2019 & 2032
- Table 38: Global LNG as a Fuel Industry Volume metric tonnes Forecast, by Country 2019 & 2032
- Table 39: China LNG as a Fuel Industry Revenue (Million) Forecast, by Application 2019 & 2032
- Table 40: China LNG as a Fuel Industry Volume (metric tonnes) Forecast, by Application 2019 & 2032
- Table 41: Japan LNG as a Fuel Industry Revenue (Million) Forecast, by Application 2019 & 2032
- Table 42: Japan LNG as a Fuel Industry Volume (metric tonnes) Forecast, by Application 2019 & 2032
- Table 43: India LNG as a Fuel Industry Revenue (Million) Forecast, by Application 2019 & 2032
- Table 44: India LNG as a Fuel Industry Volume (metric tonnes) Forecast, by Application 2019 & 2032
- Table 45: South Korea LNG as a Fuel Industry Revenue (Million) Forecast, by Application 2019 & 2032
- Table 46: South Korea LNG as a Fuel Industry Volume (metric tonnes) Forecast, by Application 2019 & 2032
- Table 47: Southeast Asia LNG as a Fuel Industry Revenue (Million) Forecast, by Application 2019 & 2032
- Table 48: Southeast Asia LNG as a Fuel Industry Volume (metric tonnes) Forecast, by Application 2019 & 2032
- Table 49: Australia LNG as a Fuel Industry Revenue (Million) Forecast, by Application 2019 & 2032
- Table 50: Australia LNG as a Fuel Industry Volume (metric tonnes) Forecast, by Application 2019 & 2032
- Table 51: Indonesia LNG as a Fuel Industry Revenue (Million) Forecast, by Application 2019 & 2032
- Table 52: Indonesia LNG as a Fuel Industry Volume (metric tonnes) Forecast, by Application 2019 & 2032
- Table 53: Phillipes LNG as a Fuel Industry Revenue (Million) Forecast, by Application 2019 & 2032
- Table 54: Phillipes LNG as a Fuel Industry Volume (metric tonnes) Forecast, by Application 2019 & 2032
- Table 55: Singapore LNG as a Fuel Industry Revenue (Million) Forecast, by Application 2019 & 2032
- Table 56: Singapore LNG as a Fuel Industry Volume (metric tonnes) Forecast, by Application 2019 & 2032
- Table 57: Thailandc LNG as a Fuel Industry Revenue (Million) Forecast, by Application 2019 & 2032
- Table 58: Thailandc LNG as a Fuel Industry Volume (metric tonnes) Forecast, by Application 2019 & 2032
- Table 59: Rest of Asia Pacific LNG as a Fuel Industry Revenue (Million) Forecast, by Application 2019 & 2032
- Table 60: Rest of Asia Pacific LNG as a Fuel Industry Volume (metric tonnes) Forecast, by Application 2019 & 2032
- Table 61: Global LNG as a Fuel Industry Revenue Million Forecast, by Country 2019 & 2032
- Table 62: Global LNG as a Fuel Industry Volume metric tonnes Forecast, by Country 2019 & 2032
- Table 63: Brazil LNG as a Fuel Industry Revenue (Million) Forecast, by Application 2019 & 2032
- Table 64: Brazil LNG as a Fuel Industry Volume (metric tonnes) Forecast, by Application 2019 & 2032
- Table 65: Argentina LNG as a Fuel Industry Revenue (Million) Forecast, by Application 2019 & 2032
- Table 66: Argentina LNG as a Fuel Industry Volume (metric tonnes) Forecast, by Application 2019 & 2032
- Table 67: Peru LNG as a Fuel Industry Revenue (Million) Forecast, by Application 2019 & 2032
- Table 68: Peru LNG as a Fuel Industry Volume (metric tonnes) Forecast, by Application 2019 & 2032
- Table 69: Chile LNG as a Fuel Industry Revenue (Million) Forecast, by Application 2019 & 2032
- Table 70: Chile LNG as a Fuel Industry Volume (metric tonnes) Forecast, by Application 2019 & 2032
- Table 71: Colombia LNG as a Fuel Industry Revenue (Million) Forecast, by Application 2019 & 2032
- Table 72: Colombia LNG as a Fuel Industry Volume (metric tonnes) Forecast, by Application 2019 & 2032
- Table 73: Ecuador LNG as a Fuel Industry Revenue (Million) Forecast, by Application 2019 & 2032
- Table 74: Ecuador LNG as a Fuel Industry Volume (metric tonnes) Forecast, by Application 2019 & 2032
- Table 75: Venezuela LNG as a Fuel Industry Revenue (Million) Forecast, by Application 2019 & 2032
- Table 76: Venezuela LNG as a Fuel Industry Volume (metric tonnes) Forecast, by Application 2019 & 2032
- Table 77: Rest of South America LNG as a Fuel Industry Revenue (Million) Forecast, by Application 2019 & 2032
- Table 78: Rest of South America LNG as a Fuel Industry Volume (metric tonnes) Forecast, by Application 2019 & 2032
- Table 79: Global LNG as a Fuel Industry Revenue Million Forecast, by Country 2019 & 2032
- Table 80: Global LNG as a Fuel Industry Volume metric tonnes Forecast, by Country 2019 & 2032
- Table 81: United States LNG as a Fuel Industry Revenue (Million) Forecast, by Application 2019 & 2032
- Table 82: United States LNG as a Fuel Industry Volume (metric tonnes) Forecast, by Application 2019 & 2032
- Table 83: Canada LNG as a Fuel Industry Revenue (Million) Forecast, by Application 2019 & 2032
- Table 84: Canada LNG as a Fuel Industry Volume (metric tonnes) Forecast, by Application 2019 & 2032
- Table 85: Mexico LNG as a Fuel Industry Revenue (Million) Forecast, by Application 2019 & 2032
- Table 86: Mexico LNG as a Fuel Industry Volume (metric tonnes) Forecast, by Application 2019 & 2032
- Table 87: Global LNG as a Fuel Industry Revenue Million Forecast, by Country 2019 & 2032
- Table 88: Global LNG as a Fuel Industry Volume metric tonnes Forecast, by Country 2019 & 2032
- Table 89: United Arab Emirates LNG as a Fuel Industry Revenue (Million) Forecast, by Application 2019 & 2032
- Table 90: United Arab Emirates LNG as a Fuel Industry Volume (metric tonnes) Forecast, by Application 2019 & 2032
- Table 91: Saudi Arabia LNG as a Fuel Industry Revenue (Million) Forecast, by Application 2019 & 2032
- Table 92: Saudi Arabia LNG as a Fuel Industry Volume (metric tonnes) Forecast, by Application 2019 & 2032
- Table 93: South Africa LNG as a Fuel Industry Revenue (Million) Forecast, by Application 2019 & 2032
- Table 94: South Africa LNG as a Fuel Industry Volume (metric tonnes) Forecast, by Application 2019 & 2032
- Table 95: Rest of Middle East and Africa LNG as a Fuel Industry Revenue (Million) Forecast, by Application 2019 & 2032
- Table 96: Rest of Middle East and Africa LNG as a Fuel Industry Volume (metric tonnes) Forecast, by Application 2019 & 2032
- Table 97: Global LNG as a Fuel Industry Revenue Million Forecast, by Application 2019 & 2032
- Table 98: Global LNG as a Fuel Industry Volume metric tonnes Forecast, by Application 2019 & 2032
- Table 99: Global LNG as a Fuel Industry Revenue Million Forecast, by Country 2019 & 2032
- Table 100: Global LNG as a Fuel Industry Volume metric tonnes Forecast, by Country 2019 & 2032
- Table 101: Global LNG as a Fuel Industry Revenue Million Forecast, by Application 2019 & 2032
- Table 102: Global LNG as a Fuel Industry Volume metric tonnes Forecast, by Application 2019 & 2032
- Table 103: Global LNG as a Fuel Industry Revenue Million Forecast, by Country 2019 & 2032
- Table 104: Global LNG as a Fuel Industry Volume metric tonnes Forecast, by Country 2019 & 2032
- Table 105: Global LNG as a Fuel Industry Revenue Million Forecast, by Application 2019 & 2032
- Table 106: Global LNG as a Fuel Industry Volume metric tonnes Forecast, by Application 2019 & 2032
- Table 107: Global LNG as a Fuel Industry Revenue Million Forecast, by Country 2019 & 2032
- Table 108: Global LNG as a Fuel Industry Volume metric tonnes Forecast, by Country 2019 & 2032
- Table 109: Global LNG as a Fuel Industry Revenue Million Forecast, by Application 2019 & 2032
- Table 110: Global LNG as a Fuel Industry Volume metric tonnes Forecast, by Application 2019 & 2032
- Table 111: Global LNG as a Fuel Industry Revenue Million Forecast, by Country 2019 & 2032
- Table 112: Global LNG as a Fuel Industry Volume metric tonnes Forecast, by Country 2019 & 2032
- Table 113: Global LNG as a Fuel Industry Revenue Million Forecast, by Application 2019 & 2032
- Table 114: Global LNG as a Fuel Industry Volume metric tonnes Forecast, by Application 2019 & 2032
- Table 115: Global LNG as a Fuel Industry Revenue Million Forecast, by Country 2019 & 2032
- Table 116: Global LNG as a Fuel Industry Volume metric tonnes Forecast, by Country 2019 & 2032
Frequently Asked Questions
1. What is the projected Compound Annual Growth Rate (CAGR) of the LNG as a Fuel Industry?
The projected CAGR is approximately > 8.00%.
2. Which companies are prominent players in the LNG as a Fuel Industry?
Key companies in the market include Total SA, Exxon Mobil Corporation, China National Petroleum Corporation, Chevron Corporation, Royal Dutch Shell PLC, Eni SpA*List Not Exhaustive, BP PLC, Conoco Philips.
3. What are the main segments of the LNG as a Fuel Industry?
The market segments include Application.
4. Can you provide details about the market size?
The market size is estimated to be USD XX Million as of 2022.
5. What are some drivers contributing to market growth?
4.; Increasing Demand from Industrial Applications4.; Growing Infrastructure Across the World.
6. What are the notable trends driving market growth?
Transportation Application to Dominate the Market.
7. Are there any restraints impacting market growth?
4.; A Rise In Concerns Related To Carbon Emissions And A Shift Towards Electric Vehicles And Renewable Sources Of Energy.
8. Can you provide examples of recent developments in the market?
N/A
9. What pricing options are available for accessing the report?
Pricing options include single-user, multi-user, and enterprise licenses priced at USD 4750, USD 5250, and USD 8750 respectively.
10. Is the market size provided in terms of value or volume?
The market size is provided in terms of value, measured in Million and volume, measured in metric tonnes.
11. Are there any specific market keywords associated with the report?
Yes, the market keyword associated with the report is "LNG as a Fuel Industry," which aids in identifying and referencing the specific market segment covered.
12. How do I determine which pricing option suits my needs best?
The pricing options vary based on user requirements and access needs. Individual users may opt for single-user licenses, while businesses requiring broader access may choose multi-user or enterprise licenses for cost-effective access to the report.
13. Are there any additional resources or data provided in the LNG as a Fuel Industry report?
While the report offers comprehensive insights, it's advisable to review the specific contents or supplementary materials provided to ascertain if additional resources or data are available.
14. How can I stay updated on further developments or reports in the LNG as a Fuel Industry?
To stay informed about further developments, trends, and reports in the LNG as a Fuel Industry, consider subscribing to industry newsletters, following relevant companies and organizations, or regularly checking reputable industry news sources and publications.
Methodology
Step 1 - Identification of Relevant Samples Size from Population Database


Step 2 - Approaches for Defining Global Market Size (Value, Volume* & Price*)

Note*: In applicable scenarios
Step 3 - Data Sources
Primary Research
- Web Analytics
- Survey Reports
- Research Institute
- Latest Research Reports
- Opinion Leaders
Secondary Research
- Annual Reports
- White Paper
- Latest Press Release
- Industry Association
- Paid Database
- Investor Presentations

Step 4 - Data Triangulation
Involves using different sources of information in order to increase the validity of a study
These sources are likely to be stakeholders in a program - participants, other researchers, program staff, other community members, and so on.
Then we put all data in single framework & apply various statistical tools to find out the dynamic on the market.
During the analysis stage, feedback from the stakeholder groups would be compared to determine areas of agreement as well as areas of divergence
