

Key Insights
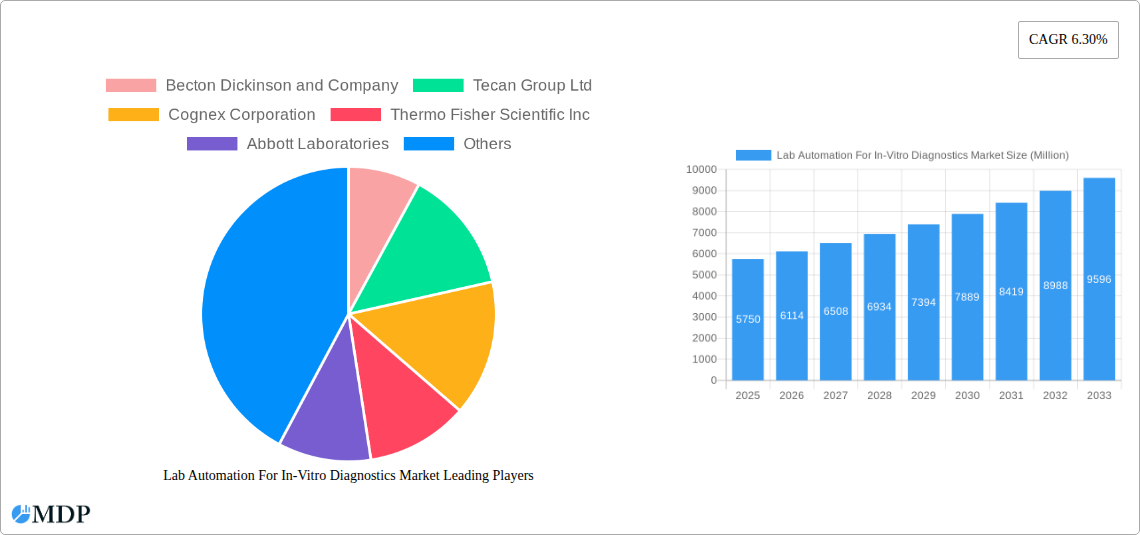
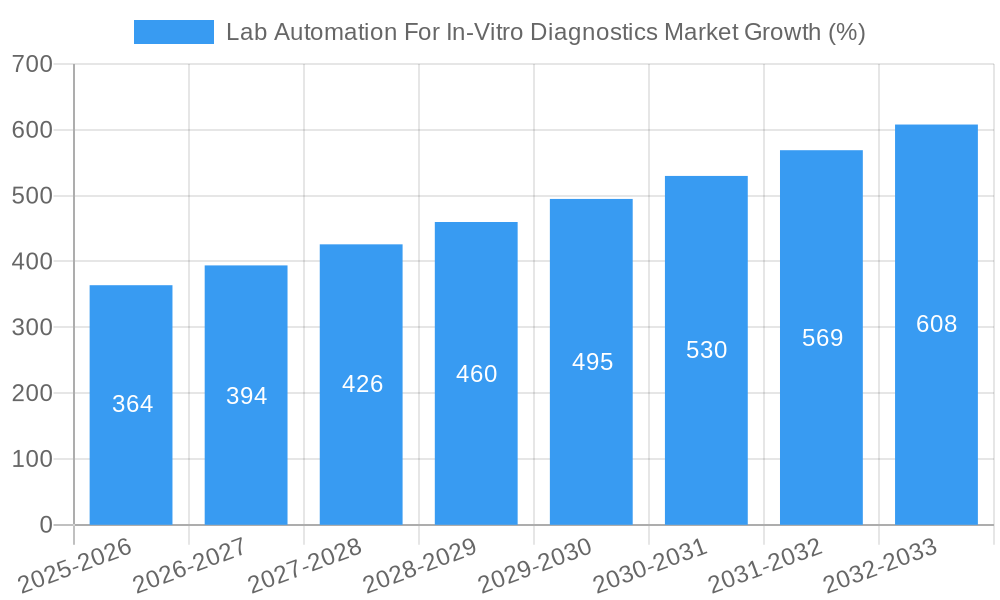
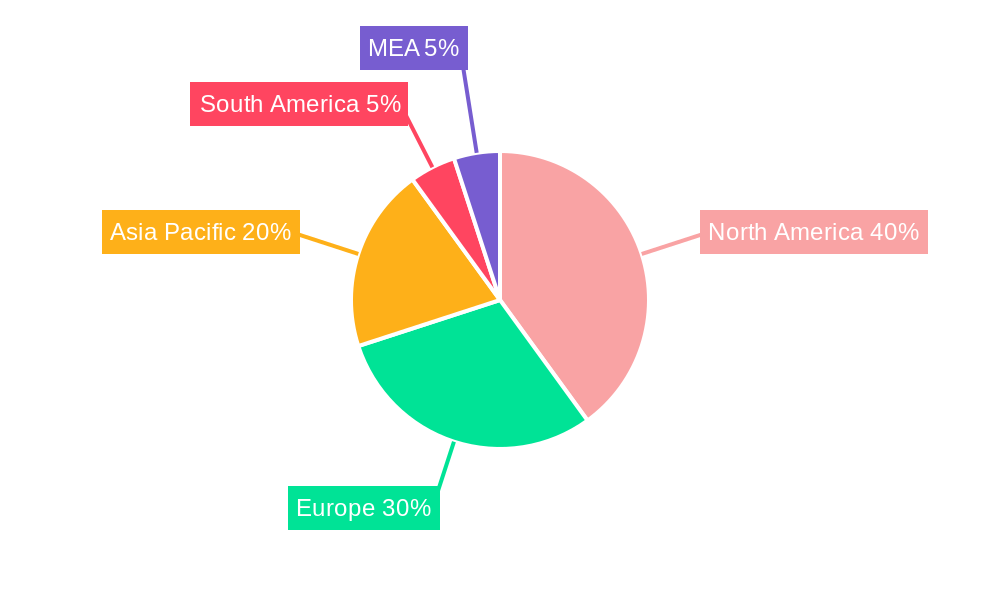
The global Lab Automation for In-Vitro Diagnostics (IVD) market is experiencing robust growth, projected to reach \$5.75 billion in 2025 and maintain a Compound Annual Growth Rate (CAGR) of 6.30% from 2025 to 2033. This expansion is driven by several key factors. The increasing demand for high-throughput screening in clinical diagnostics, coupled with the rising prevalence of chronic diseases requiring frequent testing, is significantly boosting the adoption of automated systems. Furthermore, the push for improved laboratory efficiency, reduced turnaround times, and minimized human error is driving investment in advanced automation technologies like automated liquid handlers, robotic arms, and automated storage and retrieval systems. The integration of artificial intelligence and machine learning into IVD automation is also a major trend, promising enhanced accuracy, data analysis, and workflow optimization. While the initial investment costs can be a restraint for smaller laboratories, the long-term cost savings in terms of labor, reduced errors, and increased throughput are quickly offsetting this initial barrier. The market is segmented by end-user (academic, laboratory, other) and equipment type (automated plate handler, automated liquid handler, robotic arm, automated storage and retrieval system, analyzer). North America currently holds a significant market share due to advanced healthcare infrastructure and high adoption rates, but regions like Asia Pacific are poised for rapid growth due to increasing healthcare expenditure and expanding diagnostic testing capabilities. Competitive landscape includes major players like Becton Dickinson, Tecan Group, Thermo Fisher Scientific, and Abbott Laboratories, constantly innovating to meet the evolving needs of the market.
The segmentation of the market by equipment type reveals a diverse range of automation solutions tailored to specific needs. Automated liquid handlers are particularly prevalent, given their crucial role in sample preparation and reagent dispensing. Robotic arms provide flexible automation for a wider array of tasks, while automated storage and retrieval systems are essential for managing large sample volumes and reagents efficiently. Analyzers, integrated with automation systems, contribute to streamlining the complete diagnostic workflow. The continuous advancements in miniaturization, integration, and user-friendliness of these systems further accelerate market growth. The ongoing development of novel diagnostic assays and the increasing adoption of point-of-care diagnostics are also likely to fuel demand for smaller, more versatile automated solutions within the IVD sector. Regulatory changes and the emphasis on quality control and standardization further shape the market, driving adoption of systems that ensure data integrity and compliance.
Lab Automation for In-Vitro Diagnostics Market: A Comprehensive Report (2019-2033)
This comprehensive report provides an in-depth analysis of the Lab Automation for In-Vitro Diagnostics market, offering invaluable insights for stakeholders across the industry. The study period covers 2019-2033, with 2025 as the base and estimated year, and a forecast period of 2025-2033. The historical period analyzed is 2019-2024. This report leverages high-impact keywords, including "lab automation," "in-vitro diagnostics," "IVD," "automated liquid handler," "robotic arm," "analyzers," and more, to ensure maximum search visibility and attract potential investors, manufacturers, and researchers.
Lab Automation For In-Vitro Diagnostics Market Market Dynamics & Concentration
The Lab Automation for In-Vitro Diagnostics market is experiencing significant growth driven by several factors. Market concentration is moderate, with key players like Becton Dickinson, Thermo Fisher Scientific, and Roche holding substantial market share, estimated at xx% collectively in 2025. However, the market is also witnessing increasing participation from smaller companies specializing in niche technologies. Innovation in areas such as AI-powered diagnostics and miniaturized systems is driving market expansion. Stringent regulatory frameworks, particularly in regions like the EU and the US, impact market entry and product approval, necessitating significant investment in compliance. The market also sees some substitution from manual processes, though automation offers superior efficiency, accuracy, and throughput. End-user trends are shifting towards increased adoption of automated solutions in high-volume laboratories and academic research institutions. Mergers and acquisitions (M&A) activity is relatively high, as larger companies seek to consolidate market share and acquire emerging technologies. In the period 2019-2024, an estimated xx M&A deals were completed in this sector.
- Market Concentration: Moderate, with top players holding xx% market share (2025 estimate).
- Innovation Drivers: AI-powered diagnostics, miniaturization, improved throughput.
- Regulatory Landscape: Stringent regulations in key markets (e.g., FDA, EU MDR).
- Product Substitution: Gradual shift from manual to automated processes.
- End-User Trends: Increasing adoption in high-volume laboratories and research institutions.
- M&A Activity: Significant activity observed, with approximately xx deals (2019-2024).
Lab Automation For In-Vitro Diagnostics Market Industry Trends & Analysis
The Lab Automation for In-Vitro Diagnostics market is projected to exhibit a CAGR of xx% during the forecast period (2025-2033). This robust growth is fueled by several key factors, including the rising prevalence of chronic diseases globally driving demand for efficient diagnostic testing; the increasing demand for high-throughput screening in pharmaceutical and biotechnology research, pushing adoption of automated systems for faster results and reduced errors; and continuous technological advancements, resulting in more sophisticated and user-friendly automation solutions with improved analytical capabilities. Furthermore, growing investments in laboratory infrastructure, especially in developing economies, coupled with increasing government initiatives promoting healthcare modernization, are significantly contributing to market expansion. The market penetration of automated systems is also increasing steadily, currently at xx% in 2025 and is expected to reach xx% by 2033. The competitive landscape is characterized by intense competition among established players and emerging companies offering a wide range of automated solutions, each aiming to capture larger market shares.
Leading Markets & Segments in Lab Automation For In-Vitro Diagnostics Market
North America currently dominates the Lab Automation for In-Vitro Diagnostics market, driven by factors such as substantial investments in healthcare infrastructure, a high prevalence of chronic diseases, and the presence of major market players. Europe follows closely, presenting a substantial market opportunity. Within segments, the laboratory end-user segment holds the largest share, exceeding xx Million USD in revenue in 2025, due to the high demand for automated solutions for increased efficiency and productivity in clinical diagnostics. The Automated Liquid Handler segment is the most significant equipment category, owing to its wide-ranging applications in various laboratory procedures.
- Key Drivers for North America: High healthcare spending, advanced infrastructure, presence of key players.
- Key Drivers for Europe: Growing healthcare expenditure, robust regulatory environment, focus on improving healthcare outcomes.
- Dominant End-User Segment: Laboratories (xx Million USD in revenue in 2025)
- Dominant Equipment Segment: Automated Liquid Handlers.
Lab Automation For In-Vitro Diagnostics Market Product Developments
Recent advancements in lab automation for IVD focus on miniaturization, improved integration with existing laboratory information systems (LIS), and enhanced analytical capabilities. The trend is towards modular systems offering flexibility and scalability to cater to diverse laboratory needs. Integration of AI and machine learning enables more accurate and efficient diagnostics, while the development of user-friendly interfaces reduces training needs and enhances accessibility. These innovations offer substantial competitive advantages, ensuring faster turnaround times, reduced costs, and superior diagnostic accuracy.
Key Drivers of Lab Automation For In-Vitro Diagnostics Market Growth
The growth of the Lab Automation for In-Vitro Diagnostics market is predominantly driven by the rising prevalence of chronic diseases, the need for high-throughput testing in research, the increasing demand for faster and more accurate diagnostic results, and continuous technological advancements. Government initiatives promoting healthcare modernization and investments in laboratory infrastructure in both developed and developing countries further fuel market expansion. The increasing demand for improved efficiency and reduced operational costs in laboratories also drives the adoption of automated systems.
Challenges in the Lab Automation For In-Vitro Diagnostics Market Market
Challenges include the high initial investment cost of automated systems, which can be a barrier for smaller laboratories; the complexity of integrating different automated systems into existing workflows; and the ongoing need for skilled personnel to operate and maintain these sophisticated technologies. Furthermore, regulatory hurdles and stringent compliance requirements can delay product launches and increase development costs. Competition among established players and new entrants is intense. Supply chain disruptions, as experienced during recent global events, can also impact the availability and cost of components.
Emerging Opportunities in Lab Automation For In-Vitro Diagnostics Market
Long-term growth opportunities exist in the development of point-of-care diagnostics using miniaturized automated systems, the integration of AI and machine learning for improved diagnostics, and expansion into emerging markets with growing healthcare needs. Strategic partnerships between automation technology providers and diagnostic companies can enhance market penetration. The development of modular, customizable automation solutions to meet diverse laboratory requirements is another key area of opportunity.
Leading Players in the Lab Automation For In-Vitro Diagnostics Market Sector
- Becton Dickinson and Company
- Tecan Group Ltd
- Cognex Corporation
- Thermo Fisher Scientific Inc
- Abbott Laboratories
- Danaher Corporation
- Siemens Healthineers AG
- Agilent Technologies Inc
- PerkinElmer Inc
- Roche Holding AG
Key Milestones in Lab Automation For In-Vitro Diagnostics Market Industry
- October 2023: Roche launched the cobas connection modules (CCM) Vertical system in the US, enhancing laboratory efficiency and space optimization.
- February 2023: Siemens Healthineers and Unilabs announced a multi-year agreement valued at over USD 216.58 Million for the acquisition of over 400 laboratory analyzers.
Strategic Outlook for Lab Automation For In-Vitro Diagnostics Market Market
The future of the Lab Automation for In-Vitro Diagnostics market is bright, driven by continuous technological innovation, increasing demand for high-throughput testing, and expansion into new markets. Strategic partnerships, focusing on integrated solutions and global market reach, will be crucial for success. Companies that invest in research and development, prioritize user-friendly designs, and adapt to evolving regulatory landscapes are poised to capture significant market share in the years to come. The market's long-term growth potential is substantial, offering attractive opportunities for investors and industry players alike.
Lab Automation For In-Vitro Diagnostics Market Segmentation
-
1. Equipment
- 1.1. Automated Plate Handler
- 1.2. Automated Liquid Handler
- 1.3. Robotic Arm
- 1.4. Automated Storage and Retrieval System
- 1.5. Analyzer
-
2. End User
- 2.1. Academic
- 2.2. Laboratory
- 2.3. Other End Users
Lab Automation For In-Vitro Diagnostics Market Segmentation By Geography
- 1. North America
- 2. Europe
- 3. Asia
- 4. Australia and New Zealand
- 5. Latin America
- 6. Middle East and Africa
Lab Automation For In-Vitro Diagnostics Market REPORT HIGHLIGHTS
| Aspects | Details |
|---|---|
| Study Period | 2019-2033 |
| Base Year | 2024 |
| Estimated Year | 2025 |
| Forecast Period | 2025-2033 |
| Historical Period | 2019-2024 |
| Growth Rate | CAGR of 6.30% from 2019-2033 |
| Segmentation |
|
Table of Contents
- 1. Introduction
- 1.1. Research Scope
- 1.2. Market Segmentation
- 1.3. Research Methodology
- 1.4. Definitions and Assumptions
- 2. Executive Summary
- 2.1. Introduction
- 3. Market Dynamics
- 3.1. Introduction
- 3.2. Market Drivers
- 3.2.1. Flexibility and Adaptability of Lab Automation Systems; Digital Transformation for Laboratories with IoT
- 3.3. Market Restrains
- 3.3.1. Slow Adoption Rates by Small and Medium Laboratories; Lack of Skilled Laboratory Professionals
- 3.4. Market Trends
- 3.4.1. Adoption of Robotics Arms Aids the Market Growth
- 4. Market Factor Analysis
- 4.1. Porters Five Forces
- 4.2. Supply/Value Chain
- 4.3. PESTEL analysis
- 4.4. Market Entropy
- 4.5. Patent/Trademark Analysis
- 5. Global Lab Automation For In-Vitro Diagnostics Market Analysis, Insights and Forecast, 2019-2031
- 5.1. Market Analysis, Insights and Forecast - by Equipment
- 5.1.1. Automated Plate Handler
- 5.1.2. Automated Liquid Handler
- 5.1.3. Robotic Arm
- 5.1.4. Automated Storage and Retrieval System
- 5.1.5. Analyzer
- 5.2. Market Analysis, Insights and Forecast - by End User
- 5.2.1. Academic
- 5.2.2. Laboratory
- 5.2.3. Other End Users
- 5.3. Market Analysis, Insights and Forecast - by Region
- 5.3.1. North America
- 5.3.2. Europe
- 5.3.3. Asia
- 5.3.4. Australia and New Zealand
- 5.3.5. Latin America
- 5.3.6. Middle East and Africa
- 5.1. Market Analysis, Insights and Forecast - by Equipment
- 6. North America Lab Automation For In-Vitro Diagnostics Market Analysis, Insights and Forecast, 2019-2031
- 6.1. Market Analysis, Insights and Forecast - by Equipment
- 6.1.1. Automated Plate Handler
- 6.1.2. Automated Liquid Handler
- 6.1.3. Robotic Arm
- 6.1.4. Automated Storage and Retrieval System
- 6.1.5. Analyzer
- 6.2. Market Analysis, Insights and Forecast - by End User
- 6.2.1. Academic
- 6.2.2. Laboratory
- 6.2.3. Other End Users
- 6.1. Market Analysis, Insights and Forecast - by Equipment
- 7. Europe Lab Automation For In-Vitro Diagnostics Market Analysis, Insights and Forecast, 2019-2031
- 7.1. Market Analysis, Insights and Forecast - by Equipment
- 7.1.1. Automated Plate Handler
- 7.1.2. Automated Liquid Handler
- 7.1.3. Robotic Arm
- 7.1.4. Automated Storage and Retrieval System
- 7.1.5. Analyzer
- 7.2. Market Analysis, Insights and Forecast - by End User
- 7.2.1. Academic
- 7.2.2. Laboratory
- 7.2.3. Other End Users
- 7.1. Market Analysis, Insights and Forecast - by Equipment
- 8. Asia Lab Automation For In-Vitro Diagnostics Market Analysis, Insights and Forecast, 2019-2031
- 8.1. Market Analysis, Insights and Forecast - by Equipment
- 8.1.1. Automated Plate Handler
- 8.1.2. Automated Liquid Handler
- 8.1.3. Robotic Arm
- 8.1.4. Automated Storage and Retrieval System
- 8.1.5. Analyzer
- 8.2. Market Analysis, Insights and Forecast - by End User
- 8.2.1. Academic
- 8.2.2. Laboratory
- 8.2.3. Other End Users
- 8.1. Market Analysis, Insights and Forecast - by Equipment
- 9. Australia and New Zealand Lab Automation For In-Vitro Diagnostics Market Analysis, Insights and Forecast, 2019-2031
- 9.1. Market Analysis, Insights and Forecast - by Equipment
- 9.1.1. Automated Plate Handler
- 9.1.2. Automated Liquid Handler
- 9.1.3. Robotic Arm
- 9.1.4. Automated Storage and Retrieval System
- 9.1.5. Analyzer
- 9.2. Market Analysis, Insights and Forecast - by End User
- 9.2.1. Academic
- 9.2.2. Laboratory
- 9.2.3. Other End Users
- 9.1. Market Analysis, Insights and Forecast - by Equipment
- 10. Latin America Lab Automation For In-Vitro Diagnostics Market Analysis, Insights and Forecast, 2019-2031
- 10.1. Market Analysis, Insights and Forecast - by Equipment
- 10.1.1. Automated Plate Handler
- 10.1.2. Automated Liquid Handler
- 10.1.3. Robotic Arm
- 10.1.4. Automated Storage and Retrieval System
- 10.1.5. Analyzer
- 10.2. Market Analysis, Insights and Forecast - by End User
- 10.2.1. Academic
- 10.2.2. Laboratory
- 10.2.3. Other End Users
- 10.1. Market Analysis, Insights and Forecast - by Equipment
- 11. Middle East and Africa Lab Automation For In-Vitro Diagnostics Market Analysis, Insights and Forecast, 2019-2031
- 11.1. Market Analysis, Insights and Forecast - by Equipment
- 11.1.1. Automated Plate Handler
- 11.1.2. Automated Liquid Handler
- 11.1.3. Robotic Arm
- 11.1.4. Automated Storage and Retrieval System
- 11.1.5. Analyzer
- 11.2. Market Analysis, Insights and Forecast - by End User
- 11.2.1. Academic
- 11.2.2. Laboratory
- 11.2.3. Other End Users
- 11.1. Market Analysis, Insights and Forecast - by Equipment
- 12. North America Lab Automation For In-Vitro Diagnostics Market Analysis, Insights and Forecast, 2019-2031
- 12.1. Market Analysis, Insights and Forecast - By Country/Sub-region
- 12.1.1 United States
- 12.1.2 Canada
- 12.1.3 Mexico
- 13. Europe Lab Automation For In-Vitro Diagnostics Market Analysis, Insights and Forecast, 2019-2031
- 13.1. Market Analysis, Insights and Forecast - By Country/Sub-region
- 13.1.1 Germany
- 13.1.2 United Kingdom
- 13.1.3 France
- 13.1.4 Spain
- 13.1.5 Italy
- 13.1.6 Spain
- 13.1.7 Belgium
- 13.1.8 Netherland
- 13.1.9 Nordics
- 13.1.10 Rest of Europe
- 14. Asia Pacific Lab Automation For In-Vitro Diagnostics Market Analysis, Insights and Forecast, 2019-2031
- 14.1. Market Analysis, Insights and Forecast - By Country/Sub-region
- 14.1.1 China
- 14.1.2 Japan
- 14.1.3 India
- 14.1.4 South Korea
- 14.1.5 Southeast Asia
- 14.1.6 Australia
- 14.1.7 Indonesia
- 14.1.8 Phillipes
- 14.1.9 Singapore
- 14.1.10 Thailandc
- 14.1.11 Rest of Asia Pacific
- 15. South America Lab Automation For In-Vitro Diagnostics Market Analysis, Insights and Forecast, 2019-2031
- 15.1. Market Analysis, Insights and Forecast - By Country/Sub-region
- 15.1.1 Brazil
- 15.1.2 Argentina
- 15.1.3 Peru
- 15.1.4 Chile
- 15.1.5 Colombia
- 15.1.6 Ecuador
- 15.1.7 Venezuela
- 15.1.8 Rest of South America
- 16. North America Lab Automation For In-Vitro Diagnostics Market Analysis, Insights and Forecast, 2019-2031
- 16.1. Market Analysis, Insights and Forecast - By Country/Sub-region
- 16.1.1 United States
- 16.1.2 Canada
- 16.1.3 Mexico
- 17. MEA Lab Automation For In-Vitro Diagnostics Market Analysis, Insights and Forecast, 2019-2031
- 17.1. Market Analysis, Insights and Forecast - By Country/Sub-region
- 17.1.1 United Arab Emirates
- 17.1.2 Saudi Arabia
- 17.1.3 South Africa
- 17.1.4 Rest of Middle East and Africa
- 18. Competitive Analysis
- 18.1. Global Market Share Analysis 2024
- 18.2. Company Profiles
- 18.2.1 Becton Dickinson and Company
- 18.2.1.1. Overview
- 18.2.1.2. Products
- 18.2.1.3. SWOT Analysis
- 18.2.1.4. Recent Developments
- 18.2.1.5. Financials (Based on Availability)
- 18.2.2 Tecan Group Ltd
- 18.2.2.1. Overview
- 18.2.2.2. Products
- 18.2.2.3. SWOT Analysis
- 18.2.2.4. Recent Developments
- 18.2.2.5. Financials (Based on Availability)
- 18.2.3 Cognex Corporation
- 18.2.3.1. Overview
- 18.2.3.2. Products
- 18.2.3.3. SWOT Analysis
- 18.2.3.4. Recent Developments
- 18.2.3.5. Financials (Based on Availability)
- 18.2.4 Thermo Fisher Scientific Inc
- 18.2.4.1. Overview
- 18.2.4.2. Products
- 18.2.4.3. SWOT Analysis
- 18.2.4.4. Recent Developments
- 18.2.4.5. Financials (Based on Availability)
- 18.2.5 Abbott Laboratories
- 18.2.5.1. Overview
- 18.2.5.2. Products
- 18.2.5.3. SWOT Analysis
- 18.2.5.4. Recent Developments
- 18.2.5.5. Financials (Based on Availability)
- 18.2.6 Danaher Corporation
- 18.2.6.1. Overview
- 18.2.6.2. Products
- 18.2.6.3. SWOT Analysis
- 18.2.6.4. Recent Developments
- 18.2.6.5. Financials (Based on Availability)
- 18.2.7 Siemens Healthineers AG
- 18.2.7.1. Overview
- 18.2.7.2. Products
- 18.2.7.3. SWOT Analysis
- 18.2.7.4. Recent Developments
- 18.2.7.5. Financials (Based on Availability)
- 18.2.8 Agilent Technologies Inc
- 18.2.8.1. Overview
- 18.2.8.2. Products
- 18.2.8.3. SWOT Analysis
- 18.2.8.4. Recent Developments
- 18.2.8.5. Financials (Based on Availability)
- 18.2.9 PerkinElmer Inc
- 18.2.9.1. Overview
- 18.2.9.2. Products
- 18.2.9.3. SWOT Analysis
- 18.2.9.4. Recent Developments
- 18.2.9.5. Financials (Based on Availability)
- 18.2.10 Roche Holding AG
- 18.2.10.1. Overview
- 18.2.10.2. Products
- 18.2.10.3. SWOT Analysis
- 18.2.10.4. Recent Developments
- 18.2.10.5. Financials (Based on Availability)
- 18.2.1 Becton Dickinson and Company
List of Figures
- Figure 1: Global Lab Automation For In-Vitro Diagnostics Market Revenue Breakdown (Million, %) by Region 2024 & 2032
- Figure 2: Global Lab Automation For In-Vitro Diagnostics Market Volume Breakdown (K Unit, %) by Region 2024 & 2032
- Figure 3: North America Lab Automation For In-Vitro Diagnostics Market Revenue (Million), by Country 2024 & 2032
- Figure 4: North America Lab Automation For In-Vitro Diagnostics Market Volume (K Unit), by Country 2024 & 2032
- Figure 5: North America Lab Automation For In-Vitro Diagnostics Market Revenue Share (%), by Country 2024 & 2032
- Figure 6: North America Lab Automation For In-Vitro Diagnostics Market Volume Share (%), by Country 2024 & 2032
- Figure 7: Europe Lab Automation For In-Vitro Diagnostics Market Revenue (Million), by Country 2024 & 2032
- Figure 8: Europe Lab Automation For In-Vitro Diagnostics Market Volume (K Unit), by Country 2024 & 2032
- Figure 9: Europe Lab Automation For In-Vitro Diagnostics Market Revenue Share (%), by Country 2024 & 2032
- Figure 10: Europe Lab Automation For In-Vitro Diagnostics Market Volume Share (%), by Country 2024 & 2032
- Figure 11: Asia Pacific Lab Automation For In-Vitro Diagnostics Market Revenue (Million), by Country 2024 & 2032
- Figure 12: Asia Pacific Lab Automation For In-Vitro Diagnostics Market Volume (K Unit), by Country 2024 & 2032
- Figure 13: Asia Pacific Lab Automation For In-Vitro Diagnostics Market Revenue Share (%), by Country 2024 & 2032
- Figure 14: Asia Pacific Lab Automation For In-Vitro Diagnostics Market Volume Share (%), by Country 2024 & 2032
- Figure 15: South America Lab Automation For In-Vitro Diagnostics Market Revenue (Million), by Country 2024 & 2032
- Figure 16: South America Lab Automation For In-Vitro Diagnostics Market Volume (K Unit), by Country 2024 & 2032
- Figure 17: South America Lab Automation For In-Vitro Diagnostics Market Revenue Share (%), by Country 2024 & 2032
- Figure 18: South America Lab Automation For In-Vitro Diagnostics Market Volume Share (%), by Country 2024 & 2032
- Figure 19: North America Lab Automation For In-Vitro Diagnostics Market Revenue (Million), by Country 2024 & 2032
- Figure 20: North America Lab Automation For In-Vitro Diagnostics Market Volume (K Unit), by Country 2024 & 2032
- Figure 21: North America Lab Automation For In-Vitro Diagnostics Market Revenue Share (%), by Country 2024 & 2032
- Figure 22: North America Lab Automation For In-Vitro Diagnostics Market Volume Share (%), by Country 2024 & 2032
- Figure 23: MEA Lab Automation For In-Vitro Diagnostics Market Revenue (Million), by Country 2024 & 2032
- Figure 24: MEA Lab Automation For In-Vitro Diagnostics Market Volume (K Unit), by Country 2024 & 2032
- Figure 25: MEA Lab Automation For In-Vitro Diagnostics Market Revenue Share (%), by Country 2024 & 2032
- Figure 26: MEA Lab Automation For In-Vitro Diagnostics Market Volume Share (%), by Country 2024 & 2032
- Figure 27: North America Lab Automation For In-Vitro Diagnostics Market Revenue (Million), by Equipment 2024 & 2032
- Figure 28: North America Lab Automation For In-Vitro Diagnostics Market Volume (K Unit), by Equipment 2024 & 2032
- Figure 29: North America Lab Automation For In-Vitro Diagnostics Market Revenue Share (%), by Equipment 2024 & 2032
- Figure 30: North America Lab Automation For In-Vitro Diagnostics Market Volume Share (%), by Equipment 2024 & 2032
- Figure 31: North America Lab Automation For In-Vitro Diagnostics Market Revenue (Million), by End User 2024 & 2032
- Figure 32: North America Lab Automation For In-Vitro Diagnostics Market Volume (K Unit), by End User 2024 & 2032
- Figure 33: North America Lab Automation For In-Vitro Diagnostics Market Revenue Share (%), by End User 2024 & 2032
- Figure 34: North America Lab Automation For In-Vitro Diagnostics Market Volume Share (%), by End User 2024 & 2032
- Figure 35: North America Lab Automation For In-Vitro Diagnostics Market Revenue (Million), by Country 2024 & 2032
- Figure 36: North America Lab Automation For In-Vitro Diagnostics Market Volume (K Unit), by Country 2024 & 2032
- Figure 37: North America Lab Automation For In-Vitro Diagnostics Market Revenue Share (%), by Country 2024 & 2032
- Figure 38: North America Lab Automation For In-Vitro Diagnostics Market Volume Share (%), by Country 2024 & 2032
- Figure 39: Europe Lab Automation For In-Vitro Diagnostics Market Revenue (Million), by Equipment 2024 & 2032
- Figure 40: Europe Lab Automation For In-Vitro Diagnostics Market Volume (K Unit), by Equipment 2024 & 2032
- Figure 41: Europe Lab Automation For In-Vitro Diagnostics Market Revenue Share (%), by Equipment 2024 & 2032
- Figure 42: Europe Lab Automation For In-Vitro Diagnostics Market Volume Share (%), by Equipment 2024 & 2032
- Figure 43: Europe Lab Automation For In-Vitro Diagnostics Market Revenue (Million), by End User 2024 & 2032
- Figure 44: Europe Lab Automation For In-Vitro Diagnostics Market Volume (K Unit), by End User 2024 & 2032
- Figure 45: Europe Lab Automation For In-Vitro Diagnostics Market Revenue Share (%), by End User 2024 & 2032
- Figure 46: Europe Lab Automation For In-Vitro Diagnostics Market Volume Share (%), by End User 2024 & 2032
- Figure 47: Europe Lab Automation For In-Vitro Diagnostics Market Revenue (Million), by Country 2024 & 2032
- Figure 48: Europe Lab Automation For In-Vitro Diagnostics Market Volume (K Unit), by Country 2024 & 2032
- Figure 49: Europe Lab Automation For In-Vitro Diagnostics Market Revenue Share (%), by Country 2024 & 2032
- Figure 50: Europe Lab Automation For In-Vitro Diagnostics Market Volume Share (%), by Country 2024 & 2032
- Figure 51: Asia Lab Automation For In-Vitro Diagnostics Market Revenue (Million), by Equipment 2024 & 2032
- Figure 52: Asia Lab Automation For In-Vitro Diagnostics Market Volume (K Unit), by Equipment 2024 & 2032
- Figure 53: Asia Lab Automation For In-Vitro Diagnostics Market Revenue Share (%), by Equipment 2024 & 2032
- Figure 54: Asia Lab Automation For In-Vitro Diagnostics Market Volume Share (%), by Equipment 2024 & 2032
- Figure 55: Asia Lab Automation For In-Vitro Diagnostics Market Revenue (Million), by End User 2024 & 2032
- Figure 56: Asia Lab Automation For In-Vitro Diagnostics Market Volume (K Unit), by End User 2024 & 2032
- Figure 57: Asia Lab Automation For In-Vitro Diagnostics Market Revenue Share (%), by End User 2024 & 2032
- Figure 58: Asia Lab Automation For In-Vitro Diagnostics Market Volume Share (%), by End User 2024 & 2032
- Figure 59: Asia Lab Automation For In-Vitro Diagnostics Market Revenue (Million), by Country 2024 & 2032
- Figure 60: Asia Lab Automation For In-Vitro Diagnostics Market Volume (K Unit), by Country 2024 & 2032
- Figure 61: Asia Lab Automation For In-Vitro Diagnostics Market Revenue Share (%), by Country 2024 & 2032
- Figure 62: Asia Lab Automation For In-Vitro Diagnostics Market Volume Share (%), by Country 2024 & 2032
- Figure 63: Australia and New Zealand Lab Automation For In-Vitro Diagnostics Market Revenue (Million), by Equipment 2024 & 2032
- Figure 64: Australia and New Zealand Lab Automation For In-Vitro Diagnostics Market Volume (K Unit), by Equipment 2024 & 2032
- Figure 65: Australia and New Zealand Lab Automation For In-Vitro Diagnostics Market Revenue Share (%), by Equipment 2024 & 2032
- Figure 66: Australia and New Zealand Lab Automation For In-Vitro Diagnostics Market Volume Share (%), by Equipment 2024 & 2032
- Figure 67: Australia and New Zealand Lab Automation For In-Vitro Diagnostics Market Revenue (Million), by End User 2024 & 2032
- Figure 68: Australia and New Zealand Lab Automation For In-Vitro Diagnostics Market Volume (K Unit), by End User 2024 & 2032
- Figure 69: Australia and New Zealand Lab Automation For In-Vitro Diagnostics Market Revenue Share (%), by End User 2024 & 2032
- Figure 70: Australia and New Zealand Lab Automation For In-Vitro Diagnostics Market Volume Share (%), by End User 2024 & 2032
- Figure 71: Australia and New Zealand Lab Automation For In-Vitro Diagnostics Market Revenue (Million), by Country 2024 & 2032
- Figure 72: Australia and New Zealand Lab Automation For In-Vitro Diagnostics Market Volume (K Unit), by Country 2024 & 2032
- Figure 73: Australia and New Zealand Lab Automation For In-Vitro Diagnostics Market Revenue Share (%), by Country 2024 & 2032
- Figure 74: Australia and New Zealand Lab Automation For In-Vitro Diagnostics Market Volume Share (%), by Country 2024 & 2032
- Figure 75: Latin America Lab Automation For In-Vitro Diagnostics Market Revenue (Million), by Equipment 2024 & 2032
- Figure 76: Latin America Lab Automation For In-Vitro Diagnostics Market Volume (K Unit), by Equipment 2024 & 2032
- Figure 77: Latin America Lab Automation For In-Vitro Diagnostics Market Revenue Share (%), by Equipment 2024 & 2032
- Figure 78: Latin America Lab Automation For In-Vitro Diagnostics Market Volume Share (%), by Equipment 2024 & 2032
- Figure 79: Latin America Lab Automation For In-Vitro Diagnostics Market Revenue (Million), by End User 2024 & 2032
- Figure 80: Latin America Lab Automation For In-Vitro Diagnostics Market Volume (K Unit), by End User 2024 & 2032
- Figure 81: Latin America Lab Automation For In-Vitro Diagnostics Market Revenue Share (%), by End User 2024 & 2032
- Figure 82: Latin America Lab Automation For In-Vitro Diagnostics Market Volume Share (%), by End User 2024 & 2032
- Figure 83: Latin America Lab Automation For In-Vitro Diagnostics Market Revenue (Million), by Country 2024 & 2032
- Figure 84: Latin America Lab Automation For In-Vitro Diagnostics Market Volume (K Unit), by Country 2024 & 2032
- Figure 85: Latin America Lab Automation For In-Vitro Diagnostics Market Revenue Share (%), by Country 2024 & 2032
- Figure 86: Latin America Lab Automation For In-Vitro Diagnostics Market Volume Share (%), by Country 2024 & 2032
- Figure 87: Middle East and Africa Lab Automation For In-Vitro Diagnostics Market Revenue (Million), by Equipment 2024 & 2032
- Figure 88: Middle East and Africa Lab Automation For In-Vitro Diagnostics Market Volume (K Unit), by Equipment 2024 & 2032
- Figure 89: Middle East and Africa Lab Automation For In-Vitro Diagnostics Market Revenue Share (%), by Equipment 2024 & 2032
- Figure 90: Middle East and Africa Lab Automation For In-Vitro Diagnostics Market Volume Share (%), by Equipment 2024 & 2032
- Figure 91: Middle East and Africa Lab Automation For In-Vitro Diagnostics Market Revenue (Million), by End User 2024 & 2032
- Figure 92: Middle East and Africa Lab Automation For In-Vitro Diagnostics Market Volume (K Unit), by End User 2024 & 2032
- Figure 93: Middle East and Africa Lab Automation For In-Vitro Diagnostics Market Revenue Share (%), by End User 2024 & 2032
- Figure 94: Middle East and Africa Lab Automation For In-Vitro Diagnostics Market Volume Share (%), by End User 2024 & 2032
- Figure 95: Middle East and Africa Lab Automation For In-Vitro Diagnostics Market Revenue (Million), by Country 2024 & 2032
- Figure 96: Middle East and Africa Lab Automation For In-Vitro Diagnostics Market Volume (K Unit), by Country 2024 & 2032
- Figure 97: Middle East and Africa Lab Automation For In-Vitro Diagnostics Market Revenue Share (%), by Country 2024 & 2032
- Figure 98: Middle East and Africa Lab Automation For In-Vitro Diagnostics Market Volume Share (%), by Country 2024 & 2032
List of Tables
- Table 1: Global Lab Automation For In-Vitro Diagnostics Market Revenue Million Forecast, by Region 2019 & 2032
- Table 2: Global Lab Automation For In-Vitro Diagnostics Market Volume K Unit Forecast, by Region 2019 & 2032
- Table 3: Global Lab Automation For In-Vitro Diagnostics Market Revenue Million Forecast, by Equipment 2019 & 2032
- Table 4: Global Lab Automation For In-Vitro Diagnostics Market Volume K Unit Forecast, by Equipment 2019 & 2032
- Table 5: Global Lab Automation For In-Vitro Diagnostics Market Revenue Million Forecast, by End User 2019 & 2032
- Table 6: Global Lab Automation For In-Vitro Diagnostics Market Volume K Unit Forecast, by End User 2019 & 2032
- Table 7: Global Lab Automation For In-Vitro Diagnostics Market Revenue Million Forecast, by Region 2019 & 2032
- Table 8: Global Lab Automation For In-Vitro Diagnostics Market Volume K Unit Forecast, by Region 2019 & 2032
- Table 9: Global Lab Automation For In-Vitro Diagnostics Market Revenue Million Forecast, by Country 2019 & 2032
- Table 10: Global Lab Automation For In-Vitro Diagnostics Market Volume K Unit Forecast, by Country 2019 & 2032
- Table 11: United States Lab Automation For In-Vitro Diagnostics Market Revenue (Million) Forecast, by Application 2019 & 2032
- Table 12: United States Lab Automation For In-Vitro Diagnostics Market Volume (K Unit) Forecast, by Application 2019 & 2032
- Table 13: Canada Lab Automation For In-Vitro Diagnostics Market Revenue (Million) Forecast, by Application 2019 & 2032
- Table 14: Canada Lab Automation For In-Vitro Diagnostics Market Volume (K Unit) Forecast, by Application 2019 & 2032
- Table 15: Mexico Lab Automation For In-Vitro Diagnostics Market Revenue (Million) Forecast, by Application 2019 & 2032
- Table 16: Mexico Lab Automation For In-Vitro Diagnostics Market Volume (K Unit) Forecast, by Application 2019 & 2032
- Table 17: Global Lab Automation For In-Vitro Diagnostics Market Revenue Million Forecast, by Country 2019 & 2032
- Table 18: Global Lab Automation For In-Vitro Diagnostics Market Volume K Unit Forecast, by Country 2019 & 2032
- Table 19: Germany Lab Automation For In-Vitro Diagnostics Market Revenue (Million) Forecast, by Application 2019 & 2032
- Table 20: Germany Lab Automation For In-Vitro Diagnostics Market Volume (K Unit) Forecast, by Application 2019 & 2032
- Table 21: United Kingdom Lab Automation For In-Vitro Diagnostics Market Revenue (Million) Forecast, by Application 2019 & 2032
- Table 22: United Kingdom Lab Automation For In-Vitro Diagnostics Market Volume (K Unit) Forecast, by Application 2019 & 2032
- Table 23: France Lab Automation For In-Vitro Diagnostics Market Revenue (Million) Forecast, by Application 2019 & 2032
- Table 24: France Lab Automation For In-Vitro Diagnostics Market Volume (K Unit) Forecast, by Application 2019 & 2032
- Table 25: Spain Lab Automation For In-Vitro Diagnostics Market Revenue (Million) Forecast, by Application 2019 & 2032
- Table 26: Spain Lab Automation For In-Vitro Diagnostics Market Volume (K Unit) Forecast, by Application 2019 & 2032
- Table 27: Italy Lab Automation For In-Vitro Diagnostics Market Revenue (Million) Forecast, by Application 2019 & 2032
- Table 28: Italy Lab Automation For In-Vitro Diagnostics Market Volume (K Unit) Forecast, by Application 2019 & 2032
- Table 29: Spain Lab Automation For In-Vitro Diagnostics Market Revenue (Million) Forecast, by Application 2019 & 2032
- Table 30: Spain Lab Automation For In-Vitro Diagnostics Market Volume (K Unit) Forecast, by Application 2019 & 2032
- Table 31: Belgium Lab Automation For In-Vitro Diagnostics Market Revenue (Million) Forecast, by Application 2019 & 2032
- Table 32: Belgium Lab Automation For In-Vitro Diagnostics Market Volume (K Unit) Forecast, by Application 2019 & 2032
- Table 33: Netherland Lab Automation For In-Vitro Diagnostics Market Revenue (Million) Forecast, by Application 2019 & 2032
- Table 34: Netherland Lab Automation For In-Vitro Diagnostics Market Volume (K Unit) Forecast, by Application 2019 & 2032
- Table 35: Nordics Lab Automation For In-Vitro Diagnostics Market Revenue (Million) Forecast, by Application 2019 & 2032
- Table 36: Nordics Lab Automation For In-Vitro Diagnostics Market Volume (K Unit) Forecast, by Application 2019 & 2032
- Table 37: Rest of Europe Lab Automation For In-Vitro Diagnostics Market Revenue (Million) Forecast, by Application 2019 & 2032
- Table 38: Rest of Europe Lab Automation For In-Vitro Diagnostics Market Volume (K Unit) Forecast, by Application 2019 & 2032
- Table 39: Global Lab Automation For In-Vitro Diagnostics Market Revenue Million Forecast, by Country 2019 & 2032
- Table 40: Global Lab Automation For In-Vitro Diagnostics Market Volume K Unit Forecast, by Country 2019 & 2032
- Table 41: China Lab Automation For In-Vitro Diagnostics Market Revenue (Million) Forecast, by Application 2019 & 2032
- Table 42: China Lab Automation For In-Vitro Diagnostics Market Volume (K Unit) Forecast, by Application 2019 & 2032
- Table 43: Japan Lab Automation For In-Vitro Diagnostics Market Revenue (Million) Forecast, by Application 2019 & 2032
- Table 44: Japan Lab Automation For In-Vitro Diagnostics Market Volume (K Unit) Forecast, by Application 2019 & 2032
- Table 45: India Lab Automation For In-Vitro Diagnostics Market Revenue (Million) Forecast, by Application 2019 & 2032
- Table 46: India Lab Automation For In-Vitro Diagnostics Market Volume (K Unit) Forecast, by Application 2019 & 2032
- Table 47: South Korea Lab Automation For In-Vitro Diagnostics Market Revenue (Million) Forecast, by Application 2019 & 2032
- Table 48: South Korea Lab Automation For In-Vitro Diagnostics Market Volume (K Unit) Forecast, by Application 2019 & 2032
- Table 49: Southeast Asia Lab Automation For In-Vitro Diagnostics Market Revenue (Million) Forecast, by Application 2019 & 2032
- Table 50: Southeast Asia Lab Automation For In-Vitro Diagnostics Market Volume (K Unit) Forecast, by Application 2019 & 2032
- Table 51: Australia Lab Automation For In-Vitro Diagnostics Market Revenue (Million) Forecast, by Application 2019 & 2032
- Table 52: Australia Lab Automation For In-Vitro Diagnostics Market Volume (K Unit) Forecast, by Application 2019 & 2032
- Table 53: Indonesia Lab Automation For In-Vitro Diagnostics Market Revenue (Million) Forecast, by Application 2019 & 2032
- Table 54: Indonesia Lab Automation For In-Vitro Diagnostics Market Volume (K Unit) Forecast, by Application 2019 & 2032
- Table 55: Phillipes Lab Automation For In-Vitro Diagnostics Market Revenue (Million) Forecast, by Application 2019 & 2032
- Table 56: Phillipes Lab Automation For In-Vitro Diagnostics Market Volume (K Unit) Forecast, by Application 2019 & 2032
- Table 57: Singapore Lab Automation For In-Vitro Diagnostics Market Revenue (Million) Forecast, by Application 2019 & 2032
- Table 58: Singapore Lab Automation For In-Vitro Diagnostics Market Volume (K Unit) Forecast, by Application 2019 & 2032
- Table 59: Thailandc Lab Automation For In-Vitro Diagnostics Market Revenue (Million) Forecast, by Application 2019 & 2032
- Table 60: Thailandc Lab Automation For In-Vitro Diagnostics Market Volume (K Unit) Forecast, by Application 2019 & 2032
- Table 61: Rest of Asia Pacific Lab Automation For In-Vitro Diagnostics Market Revenue (Million) Forecast, by Application 2019 & 2032
- Table 62: Rest of Asia Pacific Lab Automation For In-Vitro Diagnostics Market Volume (K Unit) Forecast, by Application 2019 & 2032
- Table 63: Global Lab Automation For In-Vitro Diagnostics Market Revenue Million Forecast, by Country 2019 & 2032
- Table 64: Global Lab Automation For In-Vitro Diagnostics Market Volume K Unit Forecast, by Country 2019 & 2032
- Table 65: Brazil Lab Automation For In-Vitro Diagnostics Market Revenue (Million) Forecast, by Application 2019 & 2032
- Table 66: Brazil Lab Automation For In-Vitro Diagnostics Market Volume (K Unit) Forecast, by Application 2019 & 2032
- Table 67: Argentina Lab Automation For In-Vitro Diagnostics Market Revenue (Million) Forecast, by Application 2019 & 2032
- Table 68: Argentina Lab Automation For In-Vitro Diagnostics Market Volume (K Unit) Forecast, by Application 2019 & 2032
- Table 69: Peru Lab Automation For In-Vitro Diagnostics Market Revenue (Million) Forecast, by Application 2019 & 2032
- Table 70: Peru Lab Automation For In-Vitro Diagnostics Market Volume (K Unit) Forecast, by Application 2019 & 2032
- Table 71: Chile Lab Automation For In-Vitro Diagnostics Market Revenue (Million) Forecast, by Application 2019 & 2032
- Table 72: Chile Lab Automation For In-Vitro Diagnostics Market Volume (K Unit) Forecast, by Application 2019 & 2032
- Table 73: Colombia Lab Automation For In-Vitro Diagnostics Market Revenue (Million) Forecast, by Application 2019 & 2032
- Table 74: Colombia Lab Automation For In-Vitro Diagnostics Market Volume (K Unit) Forecast, by Application 2019 & 2032
- Table 75: Ecuador Lab Automation For In-Vitro Diagnostics Market Revenue (Million) Forecast, by Application 2019 & 2032
- Table 76: Ecuador Lab Automation For In-Vitro Diagnostics Market Volume (K Unit) Forecast, by Application 2019 & 2032
- Table 77: Venezuela Lab Automation For In-Vitro Diagnostics Market Revenue (Million) Forecast, by Application 2019 & 2032
- Table 78: Venezuela Lab Automation For In-Vitro Diagnostics Market Volume (K Unit) Forecast, by Application 2019 & 2032
- Table 79: Rest of South America Lab Automation For In-Vitro Diagnostics Market Revenue (Million) Forecast, by Application 2019 & 2032
- Table 80: Rest of South America Lab Automation For In-Vitro Diagnostics Market Volume (K Unit) Forecast, by Application 2019 & 2032
- Table 81: Global Lab Automation For In-Vitro Diagnostics Market Revenue Million Forecast, by Country 2019 & 2032
- Table 82: Global Lab Automation For In-Vitro Diagnostics Market Volume K Unit Forecast, by Country 2019 & 2032
- Table 83: United States Lab Automation For In-Vitro Diagnostics Market Revenue (Million) Forecast, by Application 2019 & 2032
- Table 84: United States Lab Automation For In-Vitro Diagnostics Market Volume (K Unit) Forecast, by Application 2019 & 2032
- Table 85: Canada Lab Automation For In-Vitro Diagnostics Market Revenue (Million) Forecast, by Application 2019 & 2032
- Table 86: Canada Lab Automation For In-Vitro Diagnostics Market Volume (K Unit) Forecast, by Application 2019 & 2032
- Table 87: Mexico Lab Automation For In-Vitro Diagnostics Market Revenue (Million) Forecast, by Application 2019 & 2032
- Table 88: Mexico Lab Automation For In-Vitro Diagnostics Market Volume (K Unit) Forecast, by Application 2019 & 2032
- Table 89: Global Lab Automation For In-Vitro Diagnostics Market Revenue Million Forecast, by Country 2019 & 2032
- Table 90: Global Lab Automation For In-Vitro Diagnostics Market Volume K Unit Forecast, by Country 2019 & 2032
- Table 91: United Arab Emirates Lab Automation For In-Vitro Diagnostics Market Revenue (Million) Forecast, by Application 2019 & 2032
- Table 92: United Arab Emirates Lab Automation For In-Vitro Diagnostics Market Volume (K Unit) Forecast, by Application 2019 & 2032
- Table 93: Saudi Arabia Lab Automation For In-Vitro Diagnostics Market Revenue (Million) Forecast, by Application 2019 & 2032
- Table 94: Saudi Arabia Lab Automation For In-Vitro Diagnostics Market Volume (K Unit) Forecast, by Application 2019 & 2032
- Table 95: South Africa Lab Automation For In-Vitro Diagnostics Market Revenue (Million) Forecast, by Application 2019 & 2032
- Table 96: South Africa Lab Automation For In-Vitro Diagnostics Market Volume (K Unit) Forecast, by Application 2019 & 2032
- Table 97: Rest of Middle East and Africa Lab Automation For In-Vitro Diagnostics Market Revenue (Million) Forecast, by Application 2019 & 2032
- Table 98: Rest of Middle East and Africa Lab Automation For In-Vitro Diagnostics Market Volume (K Unit) Forecast, by Application 2019 & 2032
- Table 99: Global Lab Automation For In-Vitro Diagnostics Market Revenue Million Forecast, by Equipment 2019 & 2032
- Table 100: Global Lab Automation For In-Vitro Diagnostics Market Volume K Unit Forecast, by Equipment 2019 & 2032
- Table 101: Global Lab Automation For In-Vitro Diagnostics Market Revenue Million Forecast, by End User 2019 & 2032
- Table 102: Global Lab Automation For In-Vitro Diagnostics Market Volume K Unit Forecast, by End User 2019 & 2032
- Table 103: Global Lab Automation For In-Vitro Diagnostics Market Revenue Million Forecast, by Country 2019 & 2032
- Table 104: Global Lab Automation For In-Vitro Diagnostics Market Volume K Unit Forecast, by Country 2019 & 2032
- Table 105: Global Lab Automation For In-Vitro Diagnostics Market Revenue Million Forecast, by Equipment 2019 & 2032
- Table 106: Global Lab Automation For In-Vitro Diagnostics Market Volume K Unit Forecast, by Equipment 2019 & 2032
- Table 107: Global Lab Automation For In-Vitro Diagnostics Market Revenue Million Forecast, by End User 2019 & 2032
- Table 108: Global Lab Automation For In-Vitro Diagnostics Market Volume K Unit Forecast, by End User 2019 & 2032
- Table 109: Global Lab Automation For In-Vitro Diagnostics Market Revenue Million Forecast, by Country 2019 & 2032
- Table 110: Global Lab Automation For In-Vitro Diagnostics Market Volume K Unit Forecast, by Country 2019 & 2032
- Table 111: Global Lab Automation For In-Vitro Diagnostics Market Revenue Million Forecast, by Equipment 2019 & 2032
- Table 112: Global Lab Automation For In-Vitro Diagnostics Market Volume K Unit Forecast, by Equipment 2019 & 2032
- Table 113: Global Lab Automation For In-Vitro Diagnostics Market Revenue Million Forecast, by End User 2019 & 2032
- Table 114: Global Lab Automation For In-Vitro Diagnostics Market Volume K Unit Forecast, by End User 2019 & 2032
- Table 115: Global Lab Automation For In-Vitro Diagnostics Market Revenue Million Forecast, by Country 2019 & 2032
- Table 116: Global Lab Automation For In-Vitro Diagnostics Market Volume K Unit Forecast, by Country 2019 & 2032
- Table 117: Global Lab Automation For In-Vitro Diagnostics Market Revenue Million Forecast, by Equipment 2019 & 2032
- Table 118: Global Lab Automation For In-Vitro Diagnostics Market Volume K Unit Forecast, by Equipment 2019 & 2032
- Table 119: Global Lab Automation For In-Vitro Diagnostics Market Revenue Million Forecast, by End User 2019 & 2032
- Table 120: Global Lab Automation For In-Vitro Diagnostics Market Volume K Unit Forecast, by End User 2019 & 2032
- Table 121: Global Lab Automation For In-Vitro Diagnostics Market Revenue Million Forecast, by Country 2019 & 2032
- Table 122: Global Lab Automation For In-Vitro Diagnostics Market Volume K Unit Forecast, by Country 2019 & 2032
- Table 123: Global Lab Automation For In-Vitro Diagnostics Market Revenue Million Forecast, by Equipment 2019 & 2032
- Table 124: Global Lab Automation For In-Vitro Diagnostics Market Volume K Unit Forecast, by Equipment 2019 & 2032
- Table 125: Global Lab Automation For In-Vitro Diagnostics Market Revenue Million Forecast, by End User 2019 & 2032
- Table 126: Global Lab Automation For In-Vitro Diagnostics Market Volume K Unit Forecast, by End User 2019 & 2032
- Table 127: Global Lab Automation For In-Vitro Diagnostics Market Revenue Million Forecast, by Country 2019 & 2032
- Table 128: Global Lab Automation For In-Vitro Diagnostics Market Volume K Unit Forecast, by Country 2019 & 2032
- Table 129: Global Lab Automation For In-Vitro Diagnostics Market Revenue Million Forecast, by Equipment 2019 & 2032
- Table 130: Global Lab Automation For In-Vitro Diagnostics Market Volume K Unit Forecast, by Equipment 2019 & 2032
- Table 131: Global Lab Automation For In-Vitro Diagnostics Market Revenue Million Forecast, by End User 2019 & 2032
- Table 132: Global Lab Automation For In-Vitro Diagnostics Market Volume K Unit Forecast, by End User 2019 & 2032
- Table 133: Global Lab Automation For In-Vitro Diagnostics Market Revenue Million Forecast, by Country 2019 & 2032
- Table 134: Global Lab Automation For In-Vitro Diagnostics Market Volume K Unit Forecast, by Country 2019 & 2032
Frequently Asked Questions
1. What is the projected Compound Annual Growth Rate (CAGR) of the Lab Automation For In-Vitro Diagnostics Market?
The projected CAGR is approximately 6.30%.
2. Which companies are prominent players in the Lab Automation For In-Vitro Diagnostics Market?
Key companies in the market include Becton Dickinson and Company, Tecan Group Ltd, Cognex Corporation, Thermo Fisher Scientific Inc, Abbott Laboratories, Danaher Corporation, Siemens Healthineers AG, Agilent Technologies Inc, PerkinElmer Inc, Roche Holding AG.
3. What are the main segments of the Lab Automation For In-Vitro Diagnostics Market?
The market segments include Equipment, End User.
4. Can you provide details about the market size?
The market size is estimated to be USD 5.75 Million as of 2022.
5. What are some drivers contributing to market growth?
Flexibility and Adaptability of Lab Automation Systems; Digital Transformation for Laboratories with IoT.
6. What are the notable trends driving market growth?
Adoption of Robotics Arms Aids the Market Growth.
7. Are there any restraints impacting market growth?
Slow Adoption Rates by Small and Medium Laboratories; Lack of Skilled Laboratory Professionals.
8. Can you provide examples of recent developments in the market?
October 2023 - Roche announced the U.S. launch of the cobas connection modules (CCM) Vertical, the elevator and overhead components of its fully automated and modular CCM system to assist low-, mid-, and high-volume laboratories in optimizing space, productivity, and patient care.
9. What pricing options are available for accessing the report?
Pricing options include single-user, multi-user, and enterprise licenses priced at USD 4750, USD 5250, and USD 8750 respectively.
10. Is the market size provided in terms of value or volume?
The market size is provided in terms of value, measured in Million and volume, measured in K Unit.
11. Are there any specific market keywords associated with the report?
Yes, the market keyword associated with the report is "Lab Automation For In-Vitro Diagnostics Market," which aids in identifying and referencing the specific market segment covered.
12. How do I determine which pricing option suits my needs best?
The pricing options vary based on user requirements and access needs. Individual users may opt for single-user licenses, while businesses requiring broader access may choose multi-user or enterprise licenses for cost-effective access to the report.
13. Are there any additional resources or data provided in the Lab Automation For In-Vitro Diagnostics Market report?
While the report offers comprehensive insights, it's advisable to review the specific contents or supplementary materials provided to ascertain if additional resources or data are available.
14. How can I stay updated on further developments or reports in the Lab Automation For In-Vitro Diagnostics Market?
To stay informed about further developments, trends, and reports in the Lab Automation For In-Vitro Diagnostics Market, consider subscribing to industry newsletters, following relevant companies and organizations, or regularly checking reputable industry news sources and publications.
Methodology
Step 1 - Identification of Relevant Samples Size from Population Database


Step 2 - Approaches for Defining Global Market Size (Value, Volume* & Price*)

Note*: In applicable scenarios
Step 3 - Data Sources
Primary Research
- Web Analytics
- Survey Reports
- Research Institute
- Latest Research Reports
- Opinion Leaders
Secondary Research
- Annual Reports
- White Paper
- Latest Press Release
- Industry Association
- Paid Database
- Investor Presentations

Step 4 - Data Triangulation
Involves using different sources of information in order to increase the validity of a study
These sources are likely to be stakeholders in a program - participants, other researchers, program staff, other community members, and so on.
Then we put all data in single framework & apply various statistical tools to find out the dynamic on the market.
During the analysis stage, feedback from the stakeholder groups would be compared to determine areas of agreement as well as areas of divergence
