

Key Insights
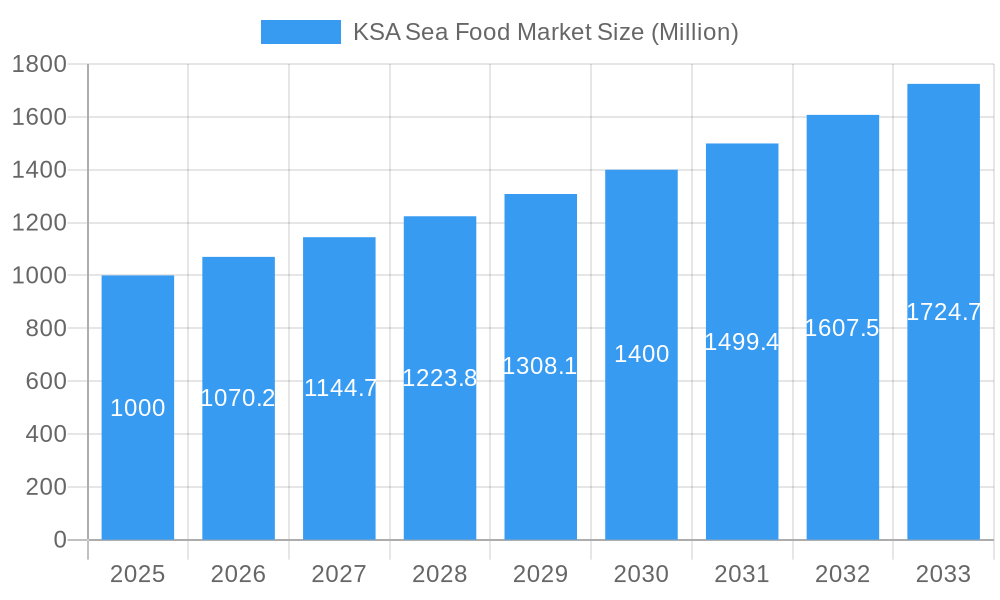
The Kingdom of Saudi Arabia (KSA) seafood market is poised for significant expansion, propelled by a growing population, rising disposable incomes, and an increasing consumer focus on healthier dietary choices. The demand for a wide array of seafood, including fish and shrimp, is a key driver of market growth. The convenience of processed and ready-to-eat seafood products is also contributing to market dynamics. While the food service sector plays a role, retail channels such as supermarkets are the primary drivers of consumer purchases for home consumption. Government support for sustainable aquaculture and domestic seafood production further underpins market development. However, reliance on imports to meet demand and global price volatility present potential challenges. Key players like Almunajem Foods and Saudi Fisheries Company highlight a competitive market structure. The KSA seafood market is projected to achieve a compound annual growth rate (CAGR) of 2.78%, with an estimated market size of 1 billion by the base year 2025. Future growth is expected to be further bolstered by inbound tourism and the associated demand within the hospitality sector.
KSA Sea Food Market Market Size (In Billion)
The KSA seafood market is segmented by product type and distribution channel, offering varied opportunities. The frozen seafood segment is anticipated to retain a substantial share, primarily due to its extended shelf life and convenience. Consumer preference for healthier options will also drive demand for fresh and chilled seafood. Consumption patterns exhibit regional disparities, with urban centers showing higher demand. Strategic collaborations, investments in sustainable aquaculture, and efficient supply chain management are vital for market players to leverage growth opportunities. The market's success hinges on effectively balancing domestic production and imports to ensure supply and competitive pricing while navigating global market uncertainties. The expansion of e-commerce and online delivery platforms will also be instrumental in shaping the future of the KSA seafood industry.
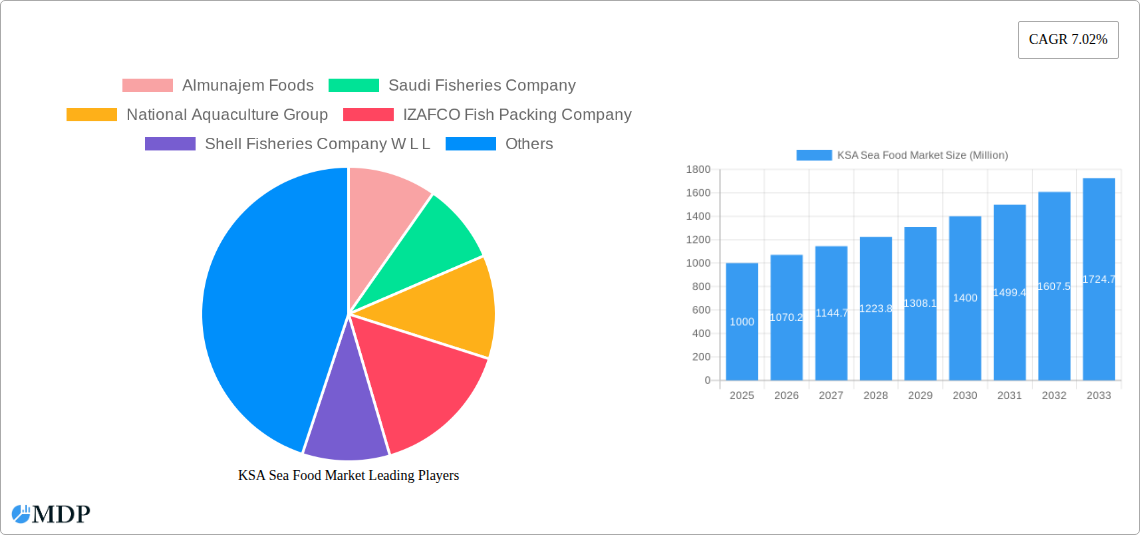
KSA Sea Food Market Company Market Share
KSA Seafood Market: A Comprehensive Report (2019-2033)
This comprehensive report provides an in-depth analysis of the Kingdom of Saudi Arabia (KSA) seafood market, offering valuable insights for industry stakeholders, investors, and businesses operating within this dynamic sector. Covering the period from 2019 to 2033, with a base year of 2025, this report projects a market worth xx Million USD by 2033. It meticulously analyzes market trends, competitive dynamics, and emerging opportunities, offering actionable intelligence to navigate the complexities of the KSA seafood landscape. Key players like Almunajem Foods, Saudi Fisheries Company, and National Aquaculture Group are profiled, along with an examination of key segments including fish, shrimp, and other seafood, across various forms and distribution channels.
KSA Sea Food Market Market Dynamics & Concentration
The KSA seafood market is characterized by a moderate level of concentration, with several key players holding significant market share. Almunajem Foods and Saudi Fisheries Company are estimated to hold a combined market share of approximately xx%, reflecting their established presence and extensive distribution networks. However, the market also displays a significant number of smaller, regional players, creating a diverse competitive landscape.
Market dynamics are influenced by several factors:
- Innovation Drivers: Technological advancements in aquaculture, processing, and packaging are driving efficiency and product quality improvements.
- Regulatory Frameworks: Government regulations concerning food safety, sustainability, and import/export procedures significantly impact market operations.
- Product Substitutes: Competition from alternative protein sources and imported seafood products exerts pressure on pricing and market share.
- End-User Trends: Growing health consciousness and changing dietary preferences are influencing consumer demand for specific seafood types and processing methods.
- M&A Activities: The number of mergers and acquisitions in the sector has been relatively low in recent years (xx deals between 2019 and 2024), indicating a consolidation trend.
KSA Sea Food Market Industry Trends & Analysis
The KSA seafood market exhibits a robust growth trajectory, driven primarily by rising disposable incomes, increasing population, and a growing preference for seafood as a part of a healthy diet. The market is projected to register a Compound Annual Growth Rate (CAGR) of xx% during the forecast period (2025-2033). Market penetration of frozen seafood remains high, exceeding xx%, while the demand for fresh and chilled seafood is steadily increasing, reflecting consumer preferences for higher-quality products. Technological disruptions, such as advancements in aquaculture techniques and improved cold chain logistics, are contributing to market expansion. Competitive dynamics are intense, with players focusing on brand building, product diversification, and strategic partnerships to gain market share.
Leading Markets & Segments in KSA Sea Food Market
The frozen seafood segment dominates the KSA market, accounting for approximately xx% of total volume, driven by its extended shelf life and cost-effectiveness. Within seafood types, fish accounts for the largest share, followed by shrimp and other seafood. The off-trade distribution channel (retail) is more prevalent than the on-trade (foodservice) channel, reflecting the significant contribution of retail supermarkets and hypermarkets.
Key Drivers of Frozen Seafood Dominance:
- Longer Shelf Life: Enables efficient storage and transportation, reducing waste.
- Cost-Effectiveness: Offers price advantages compared to fresh/chilled options.
- Wide Availability: Easily accessible through various retail channels.
Key Drivers of Fish Segment Dominance:
- Cultural Preferences: Fish is a staple in Saudi cuisine.
- Wide Variety: Offers a range of species to cater to diverse preferences.
- Domestic Production: Significant contribution from local aquaculture and fishing activities.
KSA Sea Food Market Product Developments
Recent product innovations have focused on value-added products, such as ready-to-eat meals and marinated seafood, catering to busy lifestyles and increasing convenience demands. Technological advancements in processing and packaging are improving product quality, safety, and shelf life, while sustainability initiatives are gaining traction, influencing consumer choices. Market fit is largely driven by consumer demand for convenient, high-quality, and sustainably sourced seafood.
Key Drivers of KSA Sea Food Market Growth
Several factors are driving the growth of the KSA seafood market:
- Government Support: Initiatives to promote aquaculture and sustainable fishing practices.
- Economic Growth: Rising disposable incomes are fueling demand for higher-value seafood products.
- Tourism: The growing tourism sector increases seafood consumption in hotels and restaurants.
- Population Growth: An increasing population creates a larger consumer base.
Challenges in the KSA Sea Food Market Market
Challenges include:
- Regulatory Compliance: Stringent food safety regulations and import procedures can increase costs.
- Supply Chain inefficiencies: Logistics and cold chain infrastructure require further development.
- Price Volatility: Fluctuations in global seafood prices can impact profitability.
- Competition from Imports: Imports from other countries can pose a competitive threat to local producers.
Emerging Opportunities in KSA Sea Food Market
Emerging opportunities include:
- Growth of Aquaculture: Expansion of aquaculture production to meet increasing demand.
- Value-Added Products: Developing ready-to-eat meals and other convenience products.
- E-commerce: Leveraging online platforms to reach a wider consumer base.
- Sustainable Practices: Adopting sustainable fishing and aquaculture practices to meet growing consumer demand for responsible seafood.
Leading Players in the KSA Sea Food Market Sector
- Almunajem Foods
- Saudi Fisheries Company
- National Aquaculture Group
- IZAFCO Fish Packing Company
- Shell Fisheries Company W L L
- Arab Fisheries Co
- The Savola Group
- Tabuk Fisheries Co
Key Milestones in KSA Sea Food Market Industry
- November 2023: NAQUA and SALIC sign a strategic partnership, significantly boosting NAQUA's capital and market position. This signals a major shift towards consolidation and investment in the aquaculture sector.
- February 2022: Asmak's distribution agreement with Fish Farm expands its market reach and product offerings, enhancing its competitive advantage. This highlights the increasing importance of strategic alliances and distribution networks.
- January 2022: NAQUA's ambitious plan to expand its production capacity demonstrates confidence in future market growth and the company's commitment to supplying the growing domestic demand. This indicates a significant expansion in the aquaculture sector's production capacity.
Strategic Outlook for KSA Sea Food Market Market
The KSA seafood market holds significant growth potential, driven by favorable demographics, economic expansion, and a growing preference for healthy and diverse diets. Strategic opportunities exist for companies focusing on sustainable aquaculture, value-added products, and efficient supply chain management. Investing in advanced technologies and fostering strategic partnerships will be critical for success in this competitive and evolving market. The market is expected to continue its strong growth trajectory, driven by the factors mentioned above, and presents significant opportunities for both established players and new entrants.
KSA Sea Food Market Segmentation
-
1. Type
- 1.1. Fish
- 1.2. Shrimp
- 1.3. Other Seafood
-
2. Form
- 2.1. Canned
- 2.2. Fresh / Chilled
- 2.3. Frozen
- 2.4. Processed
-
3. Distribution Channel
-
3.1. Off-Trade
- 3.1.1. Convenience Stores
- 3.1.2. Online Channel
- 3.1.3. Supermarkets and Hypermarkets
- 3.1.4. Others
- 3.2. On-Trade
-
3.1. Off-Trade
KSA Sea Food Market Segmentation By Geography
-
1. North America
- 1.1. United States
- 1.2. Canada
- 1.3. Mexico
-
2. South America
- 2.1. Brazil
- 2.2. Argentina
- 2.3. Rest of South America
-
3. Europe
- 3.1. United Kingdom
- 3.2. Germany
- 3.3. France
- 3.4. Italy
- 3.5. Spain
- 3.6. Russia
- 3.7. Benelux
- 3.8. Nordics
- 3.9. Rest of Europe
-
4. Middle East & Africa
- 4.1. Turkey
- 4.2. Israel
- 4.3. GCC
- 4.4. North Africa
- 4.5. South Africa
- 4.6. Rest of Middle East & Africa
-
5. Asia Pacific
- 5.1. China
- 5.2. India
- 5.3. Japan
- 5.4. South Korea
- 5.5. ASEAN
- 5.6. Oceania
- 5.7. Rest of Asia Pacific
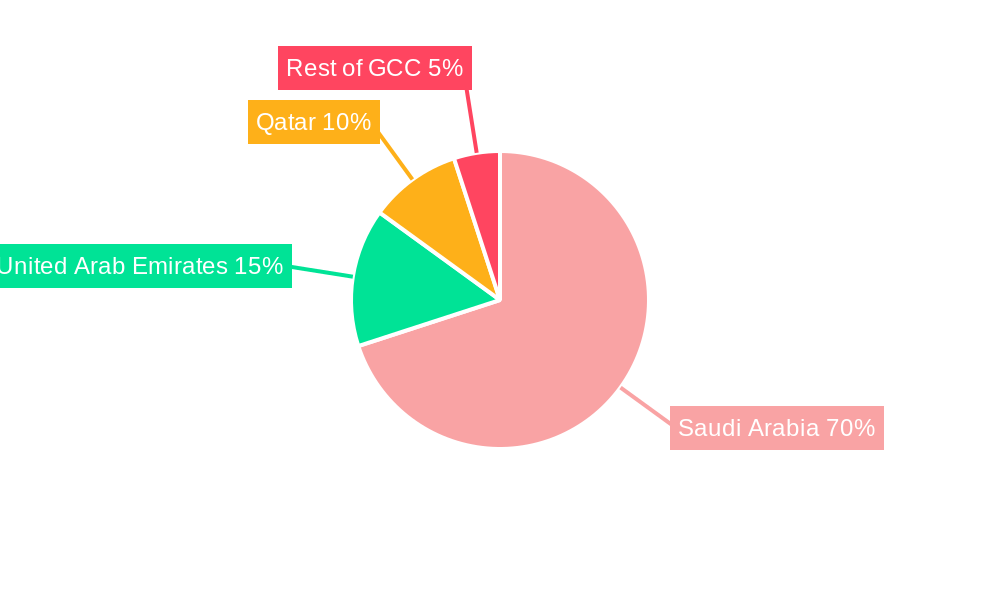
KSA Sea Food Market Regional Market Share
Geographic Coverage of KSA Sea Food Market
KSA Sea Food Market REPORT HIGHLIGHTS
| Aspects | Details |
|---|---|
| Study Period | 2020-2034 |
| Base Year | 2025 |
| Estimated Year | 2026 |
| Forecast Period | 2026-2034 |
| Historical Period | 2020-2025 |
| Growth Rate | CAGR of 2.78% from 2020-2034 |
| Segmentation |
|
Table of Contents
- 1. Introduction
- 1.1. Research Scope
- 1.2. Market Segmentation
- 1.3. Research Methodology
- 1.4. Definitions and Assumptions
- 2. Executive Summary
- 2.1. Introduction
- 3. Market Dynamics
- 3.1. Introduction
- 3.2. Market Drivers
- 3.2.1. Rising Demand for Clean Label Food & Beverage Products; Rising Demand for Dairy Products
- 3.3. Market Restrains
- 3.3.1. Presence of Preservatives in Ready Meals may Hamper the Market Growth
- 3.4. Market Trends
- 3.4.1. OTHER KEY INDUSTRY TRENDS COVERED IN THE REPORT
- 4. Market Factor Analysis
- 4.1. Porters Five Forces
- 4.2. Supply/Value Chain
- 4.3. PESTEL analysis
- 4.4. Market Entropy
- 4.5. Patent/Trademark Analysis
- 5. Global KSA Sea Food Market Analysis, Insights and Forecast, 2020-2032
- 5.1. Market Analysis, Insights and Forecast - by Type
- 5.1.1. Fish
- 5.1.2. Shrimp
- 5.1.3. Other Seafood
- 5.2. Market Analysis, Insights and Forecast - by Form
- 5.2.1. Canned
- 5.2.2. Fresh / Chilled
- 5.2.3. Frozen
- 5.2.4. Processed
- 5.3. Market Analysis, Insights and Forecast - by Distribution Channel
- 5.3.1. Off-Trade
- 5.3.1.1. Convenience Stores
- 5.3.1.2. Online Channel
- 5.3.1.3. Supermarkets and Hypermarkets
- 5.3.1.4. Others
- 5.3.2. On-Trade
- 5.3.1. Off-Trade
- 5.4. Market Analysis, Insights and Forecast - by Region
- 5.4.1. North America
- 5.4.2. South America
- 5.4.3. Europe
- 5.4.4. Middle East & Africa
- 5.4.5. Asia Pacific
- 5.1. Market Analysis, Insights and Forecast - by Type
- 6. North America KSA Sea Food Market Analysis, Insights and Forecast, 2020-2032
- 6.1. Market Analysis, Insights and Forecast - by Type
- 6.1.1. Fish
- 6.1.2. Shrimp
- 6.1.3. Other Seafood
- 6.2. Market Analysis, Insights and Forecast - by Form
- 6.2.1. Canned
- 6.2.2. Fresh / Chilled
- 6.2.3. Frozen
- 6.2.4. Processed
- 6.3. Market Analysis, Insights and Forecast - by Distribution Channel
- 6.3.1. Off-Trade
- 6.3.1.1. Convenience Stores
- 6.3.1.2. Online Channel
- 6.3.1.3. Supermarkets and Hypermarkets
- 6.3.1.4. Others
- 6.3.2. On-Trade
- 6.3.1. Off-Trade
- 6.1. Market Analysis, Insights and Forecast - by Type
- 7. South America KSA Sea Food Market Analysis, Insights and Forecast, 2020-2032
- 7.1. Market Analysis, Insights and Forecast - by Type
- 7.1.1. Fish
- 7.1.2. Shrimp
- 7.1.3. Other Seafood
- 7.2. Market Analysis, Insights and Forecast - by Form
- 7.2.1. Canned
- 7.2.2. Fresh / Chilled
- 7.2.3. Frozen
- 7.2.4. Processed
- 7.3. Market Analysis, Insights and Forecast - by Distribution Channel
- 7.3.1. Off-Trade
- 7.3.1.1. Convenience Stores
- 7.3.1.2. Online Channel
- 7.3.1.3. Supermarkets and Hypermarkets
- 7.3.1.4. Others
- 7.3.2. On-Trade
- 7.3.1. Off-Trade
- 7.1. Market Analysis, Insights and Forecast - by Type
- 8. Europe KSA Sea Food Market Analysis, Insights and Forecast, 2020-2032
- 8.1. Market Analysis, Insights and Forecast - by Type
- 8.1.1. Fish
- 8.1.2. Shrimp
- 8.1.3. Other Seafood
- 8.2. Market Analysis, Insights and Forecast - by Form
- 8.2.1. Canned
- 8.2.2. Fresh / Chilled
- 8.2.3. Frozen
- 8.2.4. Processed
- 8.3. Market Analysis, Insights and Forecast - by Distribution Channel
- 8.3.1. Off-Trade
- 8.3.1.1. Convenience Stores
- 8.3.1.2. Online Channel
- 8.3.1.3. Supermarkets and Hypermarkets
- 8.3.1.4. Others
- 8.3.2. On-Trade
- 8.3.1. Off-Trade
- 8.1. Market Analysis, Insights and Forecast - by Type
- 9. Middle East & Africa KSA Sea Food Market Analysis, Insights and Forecast, 2020-2032
- 9.1. Market Analysis, Insights and Forecast - by Type
- 9.1.1. Fish
- 9.1.2. Shrimp
- 9.1.3. Other Seafood
- 9.2. Market Analysis, Insights and Forecast - by Form
- 9.2.1. Canned
- 9.2.2. Fresh / Chilled
- 9.2.3. Frozen
- 9.2.4. Processed
- 9.3. Market Analysis, Insights and Forecast - by Distribution Channel
- 9.3.1. Off-Trade
- 9.3.1.1. Convenience Stores
- 9.3.1.2. Online Channel
- 9.3.1.3. Supermarkets and Hypermarkets
- 9.3.1.4. Others
- 9.3.2. On-Trade
- 9.3.1. Off-Trade
- 9.1. Market Analysis, Insights and Forecast - by Type
- 10. Asia Pacific KSA Sea Food Market Analysis, Insights and Forecast, 2020-2032
- 10.1. Market Analysis, Insights and Forecast - by Type
- 10.1.1. Fish
- 10.1.2. Shrimp
- 10.1.3. Other Seafood
- 10.2. Market Analysis, Insights and Forecast - by Form
- 10.2.1. Canned
- 10.2.2. Fresh / Chilled
- 10.2.3. Frozen
- 10.2.4. Processed
- 10.3. Market Analysis, Insights and Forecast - by Distribution Channel
- 10.3.1. Off-Trade
- 10.3.1.1. Convenience Stores
- 10.3.1.2. Online Channel
- 10.3.1.3. Supermarkets and Hypermarkets
- 10.3.1.4. Others
- 10.3.2. On-Trade
- 10.3.1. Off-Trade
- 10.1. Market Analysis, Insights and Forecast - by Type
- 11. Competitive Analysis
- 11.1. Global Market Share Analysis 2025
- 11.2. Company Profiles
- 11.2.1 Almunajem Foods
- 11.2.1.1. Overview
- 11.2.1.2. Products
- 11.2.1.3. SWOT Analysis
- 11.2.1.4. Recent Developments
- 11.2.1.5. Financials (Based on Availability)
- 11.2.2 Saudi Fisheries Company
- 11.2.2.1. Overview
- 11.2.2.2. Products
- 11.2.2.3. SWOT Analysis
- 11.2.2.4. Recent Developments
- 11.2.2.5. Financials (Based on Availability)
- 11.2.3 National Aquaculture Group
- 11.2.3.1. Overview
- 11.2.3.2. Products
- 11.2.3.3. SWOT Analysis
- 11.2.3.4. Recent Developments
- 11.2.3.5. Financials (Based on Availability)
- 11.2.4 IZAFCO Fish Packing Company
- 11.2.4.1. Overview
- 11.2.4.2. Products
- 11.2.4.3. SWOT Analysis
- 11.2.4.4. Recent Developments
- 11.2.4.5. Financials (Based on Availability)
- 11.2.5 Shell Fisheries Company W L L
- 11.2.5.1. Overview
- 11.2.5.2. Products
- 11.2.5.3. SWOT Analysis
- 11.2.5.4. Recent Developments
- 11.2.5.5. Financials (Based on Availability)
- 11.2.6 Arab Fisheries Co
- 11.2.6.1. Overview
- 11.2.6.2. Products
- 11.2.6.3. SWOT Analysis
- 11.2.6.4. Recent Developments
- 11.2.6.5. Financials (Based on Availability)
- 11.2.7 The Savola Grou
- 11.2.7.1. Overview
- 11.2.7.2. Products
- 11.2.7.3. SWOT Analysis
- 11.2.7.4. Recent Developments
- 11.2.7.5. Financials (Based on Availability)
- 11.2.8 Tabuk Fisheries Co
- 11.2.8.1. Overview
- 11.2.8.2. Products
- 11.2.8.3. SWOT Analysis
- 11.2.8.4. Recent Developments
- 11.2.8.5. Financials (Based on Availability)
- 11.2.1 Almunajem Foods
List of Figures
- Figure 1: Global KSA Sea Food Market Revenue Breakdown (billion, %) by Region 2025 & 2033
- Figure 2: Global KSA Sea Food Market Volume Breakdown (K Tons, %) by Region 2025 & 2033
- Figure 3: North America KSA Sea Food Market Revenue (billion), by Type 2025 & 2033
- Figure 4: North America KSA Sea Food Market Volume (K Tons), by Type 2025 & 2033
- Figure 5: North America KSA Sea Food Market Revenue Share (%), by Type 2025 & 2033
- Figure 6: North America KSA Sea Food Market Volume Share (%), by Type 2025 & 2033
- Figure 7: North America KSA Sea Food Market Revenue (billion), by Form 2025 & 2033
- Figure 8: North America KSA Sea Food Market Volume (K Tons), by Form 2025 & 2033
- Figure 9: North America KSA Sea Food Market Revenue Share (%), by Form 2025 & 2033
- Figure 10: North America KSA Sea Food Market Volume Share (%), by Form 2025 & 2033
- Figure 11: North America KSA Sea Food Market Revenue (billion), by Distribution Channel 2025 & 2033
- Figure 12: North America KSA Sea Food Market Volume (K Tons), by Distribution Channel 2025 & 2033
- Figure 13: North America KSA Sea Food Market Revenue Share (%), by Distribution Channel 2025 & 2033
- Figure 14: North America KSA Sea Food Market Volume Share (%), by Distribution Channel 2025 & 2033
- Figure 15: North America KSA Sea Food Market Revenue (billion), by Country 2025 & 2033
- Figure 16: North America KSA Sea Food Market Volume (K Tons), by Country 2025 & 2033
- Figure 17: North America KSA Sea Food Market Revenue Share (%), by Country 2025 & 2033
- Figure 18: North America KSA Sea Food Market Volume Share (%), by Country 2025 & 2033
- Figure 19: South America KSA Sea Food Market Revenue (billion), by Type 2025 & 2033
- Figure 20: South America KSA Sea Food Market Volume (K Tons), by Type 2025 & 2033
- Figure 21: South America KSA Sea Food Market Revenue Share (%), by Type 2025 & 2033
- Figure 22: South America KSA Sea Food Market Volume Share (%), by Type 2025 & 2033
- Figure 23: South America KSA Sea Food Market Revenue (billion), by Form 2025 & 2033
- Figure 24: South America KSA Sea Food Market Volume (K Tons), by Form 2025 & 2033
- Figure 25: South America KSA Sea Food Market Revenue Share (%), by Form 2025 & 2033
- Figure 26: South America KSA Sea Food Market Volume Share (%), by Form 2025 & 2033
- Figure 27: South America KSA Sea Food Market Revenue (billion), by Distribution Channel 2025 & 2033
- Figure 28: South America KSA Sea Food Market Volume (K Tons), by Distribution Channel 2025 & 2033
- Figure 29: South America KSA Sea Food Market Revenue Share (%), by Distribution Channel 2025 & 2033
- Figure 30: South America KSA Sea Food Market Volume Share (%), by Distribution Channel 2025 & 2033
- Figure 31: South America KSA Sea Food Market Revenue (billion), by Country 2025 & 2033
- Figure 32: South America KSA Sea Food Market Volume (K Tons), by Country 2025 & 2033
- Figure 33: South America KSA Sea Food Market Revenue Share (%), by Country 2025 & 2033
- Figure 34: South America KSA Sea Food Market Volume Share (%), by Country 2025 & 2033
- Figure 35: Europe KSA Sea Food Market Revenue (billion), by Type 2025 & 2033
- Figure 36: Europe KSA Sea Food Market Volume (K Tons), by Type 2025 & 2033
- Figure 37: Europe KSA Sea Food Market Revenue Share (%), by Type 2025 & 2033
- Figure 38: Europe KSA Sea Food Market Volume Share (%), by Type 2025 & 2033
- Figure 39: Europe KSA Sea Food Market Revenue (billion), by Form 2025 & 2033
- Figure 40: Europe KSA Sea Food Market Volume (K Tons), by Form 2025 & 2033
- Figure 41: Europe KSA Sea Food Market Revenue Share (%), by Form 2025 & 2033
- Figure 42: Europe KSA Sea Food Market Volume Share (%), by Form 2025 & 2033
- Figure 43: Europe KSA Sea Food Market Revenue (billion), by Distribution Channel 2025 & 2033
- Figure 44: Europe KSA Sea Food Market Volume (K Tons), by Distribution Channel 2025 & 2033
- Figure 45: Europe KSA Sea Food Market Revenue Share (%), by Distribution Channel 2025 & 2033
- Figure 46: Europe KSA Sea Food Market Volume Share (%), by Distribution Channel 2025 & 2033
- Figure 47: Europe KSA Sea Food Market Revenue (billion), by Country 2025 & 2033
- Figure 48: Europe KSA Sea Food Market Volume (K Tons), by Country 2025 & 2033
- Figure 49: Europe KSA Sea Food Market Revenue Share (%), by Country 2025 & 2033
- Figure 50: Europe KSA Sea Food Market Volume Share (%), by Country 2025 & 2033
- Figure 51: Middle East & Africa KSA Sea Food Market Revenue (billion), by Type 2025 & 2033
- Figure 52: Middle East & Africa KSA Sea Food Market Volume (K Tons), by Type 2025 & 2033
- Figure 53: Middle East & Africa KSA Sea Food Market Revenue Share (%), by Type 2025 & 2033
- Figure 54: Middle East & Africa KSA Sea Food Market Volume Share (%), by Type 2025 & 2033
- Figure 55: Middle East & Africa KSA Sea Food Market Revenue (billion), by Form 2025 & 2033
- Figure 56: Middle East & Africa KSA Sea Food Market Volume (K Tons), by Form 2025 & 2033
- Figure 57: Middle East & Africa KSA Sea Food Market Revenue Share (%), by Form 2025 & 2033
- Figure 58: Middle East & Africa KSA Sea Food Market Volume Share (%), by Form 2025 & 2033
- Figure 59: Middle East & Africa KSA Sea Food Market Revenue (billion), by Distribution Channel 2025 & 2033
- Figure 60: Middle East & Africa KSA Sea Food Market Volume (K Tons), by Distribution Channel 2025 & 2033
- Figure 61: Middle East & Africa KSA Sea Food Market Revenue Share (%), by Distribution Channel 2025 & 2033
- Figure 62: Middle East & Africa KSA Sea Food Market Volume Share (%), by Distribution Channel 2025 & 2033
- Figure 63: Middle East & Africa KSA Sea Food Market Revenue (billion), by Country 2025 & 2033
- Figure 64: Middle East & Africa KSA Sea Food Market Volume (K Tons), by Country 2025 & 2033
- Figure 65: Middle East & Africa KSA Sea Food Market Revenue Share (%), by Country 2025 & 2033
- Figure 66: Middle East & Africa KSA Sea Food Market Volume Share (%), by Country 2025 & 2033
- Figure 67: Asia Pacific KSA Sea Food Market Revenue (billion), by Type 2025 & 2033
- Figure 68: Asia Pacific KSA Sea Food Market Volume (K Tons), by Type 2025 & 2033
- Figure 69: Asia Pacific KSA Sea Food Market Revenue Share (%), by Type 2025 & 2033
- Figure 70: Asia Pacific KSA Sea Food Market Volume Share (%), by Type 2025 & 2033
- Figure 71: Asia Pacific KSA Sea Food Market Revenue (billion), by Form 2025 & 2033
- Figure 72: Asia Pacific KSA Sea Food Market Volume (K Tons), by Form 2025 & 2033
- Figure 73: Asia Pacific KSA Sea Food Market Revenue Share (%), by Form 2025 & 2033
- Figure 74: Asia Pacific KSA Sea Food Market Volume Share (%), by Form 2025 & 2033
- Figure 75: Asia Pacific KSA Sea Food Market Revenue (billion), by Distribution Channel 2025 & 2033
- Figure 76: Asia Pacific KSA Sea Food Market Volume (K Tons), by Distribution Channel 2025 & 2033
- Figure 77: Asia Pacific KSA Sea Food Market Revenue Share (%), by Distribution Channel 2025 & 2033
- Figure 78: Asia Pacific KSA Sea Food Market Volume Share (%), by Distribution Channel 2025 & 2033
- Figure 79: Asia Pacific KSA Sea Food Market Revenue (billion), by Country 2025 & 2033
- Figure 80: Asia Pacific KSA Sea Food Market Volume (K Tons), by Country 2025 & 2033
- Figure 81: Asia Pacific KSA Sea Food Market Revenue Share (%), by Country 2025 & 2033
- Figure 82: Asia Pacific KSA Sea Food Market Volume Share (%), by Country 2025 & 2033
List of Tables
- Table 1: Global KSA Sea Food Market Revenue billion Forecast, by Type 2020 & 2033
- Table 2: Global KSA Sea Food Market Volume K Tons Forecast, by Type 2020 & 2033
- Table 3: Global KSA Sea Food Market Revenue billion Forecast, by Form 2020 & 2033
- Table 4: Global KSA Sea Food Market Volume K Tons Forecast, by Form 2020 & 2033
- Table 5: Global KSA Sea Food Market Revenue billion Forecast, by Distribution Channel 2020 & 2033
- Table 6: Global KSA Sea Food Market Volume K Tons Forecast, by Distribution Channel 2020 & 2033
- Table 7: Global KSA Sea Food Market Revenue billion Forecast, by Region 2020 & 2033
- Table 8: Global KSA Sea Food Market Volume K Tons Forecast, by Region 2020 & 2033
- Table 9: Global KSA Sea Food Market Revenue billion Forecast, by Type 2020 & 2033
- Table 10: Global KSA Sea Food Market Volume K Tons Forecast, by Type 2020 & 2033
- Table 11: Global KSA Sea Food Market Revenue billion Forecast, by Form 2020 & 2033
- Table 12: Global KSA Sea Food Market Volume K Tons Forecast, by Form 2020 & 2033
- Table 13: Global KSA Sea Food Market Revenue billion Forecast, by Distribution Channel 2020 & 2033
- Table 14: Global KSA Sea Food Market Volume K Tons Forecast, by Distribution Channel 2020 & 2033
- Table 15: Global KSA Sea Food Market Revenue billion Forecast, by Country 2020 & 2033
- Table 16: Global KSA Sea Food Market Volume K Tons Forecast, by Country 2020 & 2033
- Table 17: United States KSA Sea Food Market Revenue (billion) Forecast, by Application 2020 & 2033
- Table 18: United States KSA Sea Food Market Volume (K Tons) Forecast, by Application 2020 & 2033
- Table 19: Canada KSA Sea Food Market Revenue (billion) Forecast, by Application 2020 & 2033
- Table 20: Canada KSA Sea Food Market Volume (K Tons) Forecast, by Application 2020 & 2033
- Table 21: Mexico KSA Sea Food Market Revenue (billion) Forecast, by Application 2020 & 2033
- Table 22: Mexico KSA Sea Food Market Volume (K Tons) Forecast, by Application 2020 & 2033
- Table 23: Global KSA Sea Food Market Revenue billion Forecast, by Type 2020 & 2033
- Table 24: Global KSA Sea Food Market Volume K Tons Forecast, by Type 2020 & 2033
- Table 25: Global KSA Sea Food Market Revenue billion Forecast, by Form 2020 & 2033
- Table 26: Global KSA Sea Food Market Volume K Tons Forecast, by Form 2020 & 2033
- Table 27: Global KSA Sea Food Market Revenue billion Forecast, by Distribution Channel 2020 & 2033
- Table 28: Global KSA Sea Food Market Volume K Tons Forecast, by Distribution Channel 2020 & 2033
- Table 29: Global KSA Sea Food Market Revenue billion Forecast, by Country 2020 & 2033
- Table 30: Global KSA Sea Food Market Volume K Tons Forecast, by Country 2020 & 2033
- Table 31: Brazil KSA Sea Food Market Revenue (billion) Forecast, by Application 2020 & 2033
- Table 32: Brazil KSA Sea Food Market Volume (K Tons) Forecast, by Application 2020 & 2033
- Table 33: Argentina KSA Sea Food Market Revenue (billion) Forecast, by Application 2020 & 2033
- Table 34: Argentina KSA Sea Food Market Volume (K Tons) Forecast, by Application 2020 & 2033
- Table 35: Rest of South America KSA Sea Food Market Revenue (billion) Forecast, by Application 2020 & 2033
- Table 36: Rest of South America KSA Sea Food Market Volume (K Tons) Forecast, by Application 2020 & 2033
- Table 37: Global KSA Sea Food Market Revenue billion Forecast, by Type 2020 & 2033
- Table 38: Global KSA Sea Food Market Volume K Tons Forecast, by Type 2020 & 2033
- Table 39: Global KSA Sea Food Market Revenue billion Forecast, by Form 2020 & 2033
- Table 40: Global KSA Sea Food Market Volume K Tons Forecast, by Form 2020 & 2033
- Table 41: Global KSA Sea Food Market Revenue billion Forecast, by Distribution Channel 2020 & 2033
- Table 42: Global KSA Sea Food Market Volume K Tons Forecast, by Distribution Channel 2020 & 2033
- Table 43: Global KSA Sea Food Market Revenue billion Forecast, by Country 2020 & 2033
- Table 44: Global KSA Sea Food Market Volume K Tons Forecast, by Country 2020 & 2033
- Table 45: United Kingdom KSA Sea Food Market Revenue (billion) Forecast, by Application 2020 & 2033
- Table 46: United Kingdom KSA Sea Food Market Volume (K Tons) Forecast, by Application 2020 & 2033
- Table 47: Germany KSA Sea Food Market Revenue (billion) Forecast, by Application 2020 & 2033
- Table 48: Germany KSA Sea Food Market Volume (K Tons) Forecast, by Application 2020 & 2033
- Table 49: France KSA Sea Food Market Revenue (billion) Forecast, by Application 2020 & 2033
- Table 50: France KSA Sea Food Market Volume (K Tons) Forecast, by Application 2020 & 2033
- Table 51: Italy KSA Sea Food Market Revenue (billion) Forecast, by Application 2020 & 2033
- Table 52: Italy KSA Sea Food Market Volume (K Tons) Forecast, by Application 2020 & 2033
- Table 53: Spain KSA Sea Food Market Revenue (billion) Forecast, by Application 2020 & 2033
- Table 54: Spain KSA Sea Food Market Volume (K Tons) Forecast, by Application 2020 & 2033
- Table 55: Russia KSA Sea Food Market Revenue (billion) Forecast, by Application 2020 & 2033
- Table 56: Russia KSA Sea Food Market Volume (K Tons) Forecast, by Application 2020 & 2033
- Table 57: Benelux KSA Sea Food Market Revenue (billion) Forecast, by Application 2020 & 2033
- Table 58: Benelux KSA Sea Food Market Volume (K Tons) Forecast, by Application 2020 & 2033
- Table 59: Nordics KSA Sea Food Market Revenue (billion) Forecast, by Application 2020 & 2033
- Table 60: Nordics KSA Sea Food Market Volume (K Tons) Forecast, by Application 2020 & 2033
- Table 61: Rest of Europe KSA Sea Food Market Revenue (billion) Forecast, by Application 2020 & 2033
- Table 62: Rest of Europe KSA Sea Food Market Volume (K Tons) Forecast, by Application 2020 & 2033
- Table 63: Global KSA Sea Food Market Revenue billion Forecast, by Type 2020 & 2033
- Table 64: Global KSA Sea Food Market Volume K Tons Forecast, by Type 2020 & 2033
- Table 65: Global KSA Sea Food Market Revenue billion Forecast, by Form 2020 & 2033
- Table 66: Global KSA Sea Food Market Volume K Tons Forecast, by Form 2020 & 2033
- Table 67: Global KSA Sea Food Market Revenue billion Forecast, by Distribution Channel 2020 & 2033
- Table 68: Global KSA Sea Food Market Volume K Tons Forecast, by Distribution Channel 2020 & 2033
- Table 69: Global KSA Sea Food Market Revenue billion Forecast, by Country 2020 & 2033
- Table 70: Global KSA Sea Food Market Volume K Tons Forecast, by Country 2020 & 2033
- Table 71: Turkey KSA Sea Food Market Revenue (billion) Forecast, by Application 2020 & 2033
- Table 72: Turkey KSA Sea Food Market Volume (K Tons) Forecast, by Application 2020 & 2033
- Table 73: Israel KSA Sea Food Market Revenue (billion) Forecast, by Application 2020 & 2033
- Table 74: Israel KSA Sea Food Market Volume (K Tons) Forecast, by Application 2020 & 2033
- Table 75: GCC KSA Sea Food Market Revenue (billion) Forecast, by Application 2020 & 2033
- Table 76: GCC KSA Sea Food Market Volume (K Tons) Forecast, by Application 2020 & 2033
- Table 77: North Africa KSA Sea Food Market Revenue (billion) Forecast, by Application 2020 & 2033
- Table 78: North Africa KSA Sea Food Market Volume (K Tons) Forecast, by Application 2020 & 2033
- Table 79: South Africa KSA Sea Food Market Revenue (billion) Forecast, by Application 2020 & 2033
- Table 80: South Africa KSA Sea Food Market Volume (K Tons) Forecast, by Application 2020 & 2033
- Table 81: Rest of Middle East & Africa KSA Sea Food Market Revenue (billion) Forecast, by Application 2020 & 2033
- Table 82: Rest of Middle East & Africa KSA Sea Food Market Volume (K Tons) Forecast, by Application 2020 & 2033
- Table 83: Global KSA Sea Food Market Revenue billion Forecast, by Type 2020 & 2033
- Table 84: Global KSA Sea Food Market Volume K Tons Forecast, by Type 2020 & 2033
- Table 85: Global KSA Sea Food Market Revenue billion Forecast, by Form 2020 & 2033
- Table 86: Global KSA Sea Food Market Volume K Tons Forecast, by Form 2020 & 2033
- Table 87: Global KSA Sea Food Market Revenue billion Forecast, by Distribution Channel 2020 & 2033
- Table 88: Global KSA Sea Food Market Volume K Tons Forecast, by Distribution Channel 2020 & 2033
- Table 89: Global KSA Sea Food Market Revenue billion Forecast, by Country 2020 & 2033
- Table 90: Global KSA Sea Food Market Volume K Tons Forecast, by Country 2020 & 2033
- Table 91: China KSA Sea Food Market Revenue (billion) Forecast, by Application 2020 & 2033
- Table 92: China KSA Sea Food Market Volume (K Tons) Forecast, by Application 2020 & 2033
- Table 93: India KSA Sea Food Market Revenue (billion) Forecast, by Application 2020 & 2033
- Table 94: India KSA Sea Food Market Volume (K Tons) Forecast, by Application 2020 & 2033
- Table 95: Japan KSA Sea Food Market Revenue (billion) Forecast, by Application 2020 & 2033
- Table 96: Japan KSA Sea Food Market Volume (K Tons) Forecast, by Application 2020 & 2033
- Table 97: South Korea KSA Sea Food Market Revenue (billion) Forecast, by Application 2020 & 2033
- Table 98: South Korea KSA Sea Food Market Volume (K Tons) Forecast, by Application 2020 & 2033
- Table 99: ASEAN KSA Sea Food Market Revenue (billion) Forecast, by Application 2020 & 2033
- Table 100: ASEAN KSA Sea Food Market Volume (K Tons) Forecast, by Application 2020 & 2033
- Table 101: Oceania KSA Sea Food Market Revenue (billion) Forecast, by Application 2020 & 2033
- Table 102: Oceania KSA Sea Food Market Volume (K Tons) Forecast, by Application 2020 & 2033
- Table 103: Rest of Asia Pacific KSA Sea Food Market Revenue (billion) Forecast, by Application 2020 & 2033
- Table 104: Rest of Asia Pacific KSA Sea Food Market Volume (K Tons) Forecast, by Application 2020 & 2033
Frequently Asked Questions
1. What is the projected Compound Annual Growth Rate (CAGR) of the KSA Sea Food Market?
The projected CAGR is approximately 2.78%.
2. Which companies are prominent players in the KSA Sea Food Market?
Key companies in the market include Almunajem Foods, Saudi Fisheries Company, National Aquaculture Group, IZAFCO Fish Packing Company, Shell Fisheries Company W L L, Arab Fisheries Co, The Savola Grou, Tabuk Fisheries Co.
3. What are the main segments of the KSA Sea Food Market?
The market segments include Type, Form, Distribution Channel.
4. Can you provide details about the market size?
The market size is estimated to be USD 1 billion as of 2022.
5. What are some drivers contributing to market growth?
Rising Demand for Clean Label Food & Beverage Products; Rising Demand for Dairy Products.
6. What are the notable trends driving market growth?
OTHER KEY INDUSTRY TRENDS COVERED IN THE REPORT.
7. Are there any restraints impacting market growth?
Presence of Preservatives in Ready Meals may Hamper the Market Growth.
8. Can you provide examples of recent developments in the market?
November 2023: NAQUA and the Saudi Agricultural and Livestock Investment Company (SALIC) have signed a strategic partnership contract. Under this agreement, SALIC agreed to raise the capital for NAQUA by way of primary investment and consequently holds a 42.4% shareholding in the NAQUA company.February 2022: Asmak announced a strategic distribution agreement with Fish Farm, a UAE-based aquaculture company. Under this agreement, Asmak distributes fish farm products to capture a wider audience locally and regionally through its processing facility and strong distribution channels, including wholesale, foodservice, and retail.January 2022: NAQUA plans to expand its production capacity from 60,000 tons of fish a year to 250,000 tons of fish a year by 2030.
9. What pricing options are available for accessing the report?
Pricing options include single-user, multi-user, and enterprise licenses priced at USD 3800, USD 4500, and USD 5800 respectively.
10. Is the market size provided in terms of value or volume?
The market size is provided in terms of value, measured in billion and volume, measured in K Tons.
11. Are there any specific market keywords associated with the report?
Yes, the market keyword associated with the report is "KSA Sea Food Market," which aids in identifying and referencing the specific market segment covered.
12. How do I determine which pricing option suits my needs best?
The pricing options vary based on user requirements and access needs. Individual users may opt for single-user licenses, while businesses requiring broader access may choose multi-user or enterprise licenses for cost-effective access to the report.
13. Are there any additional resources or data provided in the KSA Sea Food Market report?
While the report offers comprehensive insights, it's advisable to review the specific contents or supplementary materials provided to ascertain if additional resources or data are available.
14. How can I stay updated on further developments or reports in the KSA Sea Food Market?
To stay informed about further developments, trends, and reports in the KSA Sea Food Market, consider subscribing to industry newsletters, following relevant companies and organizations, or regularly checking reputable industry news sources and publications.
Methodology
Step 1 - Identification of Relevant Samples Size from Population Database


Step 2 - Approaches for Defining Global Market Size (Value, Volume* & Price*)

Note*: In applicable scenarios
Step 3 - Data Sources
Primary Research
- Web Analytics
- Survey Reports
- Research Institute
- Latest Research Reports
- Opinion Leaders
Secondary Research
- Annual Reports
- White Paper
- Latest Press Release
- Industry Association
- Paid Database
- Investor Presentations

Step 4 - Data Triangulation
Involves using different sources of information in order to increase the validity of a study
These sources are likely to be stakeholders in a program - participants, other researchers, program staff, other community members, and so on.
Then we put all data in single framework & apply various statistical tools to find out the dynamic on the market.
During the analysis stage, feedback from the stakeholder groups would be compared to determine areas of agreement as well as areas of divergence