

Key Insights
The Internet of Things (IoT) security market is experiencing explosive growth, projected to reach a substantial size driven by the escalating adoption of IoT devices across diverse sectors. The market's compound annual growth rate (CAGR) of 33.53% from 2019 to 2024 indicates a significant upward trajectory. This rapid expansion is fueled by several key factors, including the increasing interconnectedness of devices, heightened awareness of cybersecurity threats targeting IoT ecosystems, and the stringent regulatory requirements mandating robust security measures for connected devices, particularly in sensitive industries like healthcare and finance. Software solutions currently dominate the market share, reflecting the ease of deployment and scalability offered by software-based security tools. However, the services segment is anticipated to experience robust growth, driven by the increasing need for specialized expertise in managing and maintaining complex IoT security infrastructures. Geographically, North America and Europe currently hold significant market share due to early adoption and mature technological infrastructure. However, the Asia-Pacific region is poised for remarkable growth, fueled by rapid industrialization, expanding digital infrastructure, and a surge in IoT deployments across various sectors.
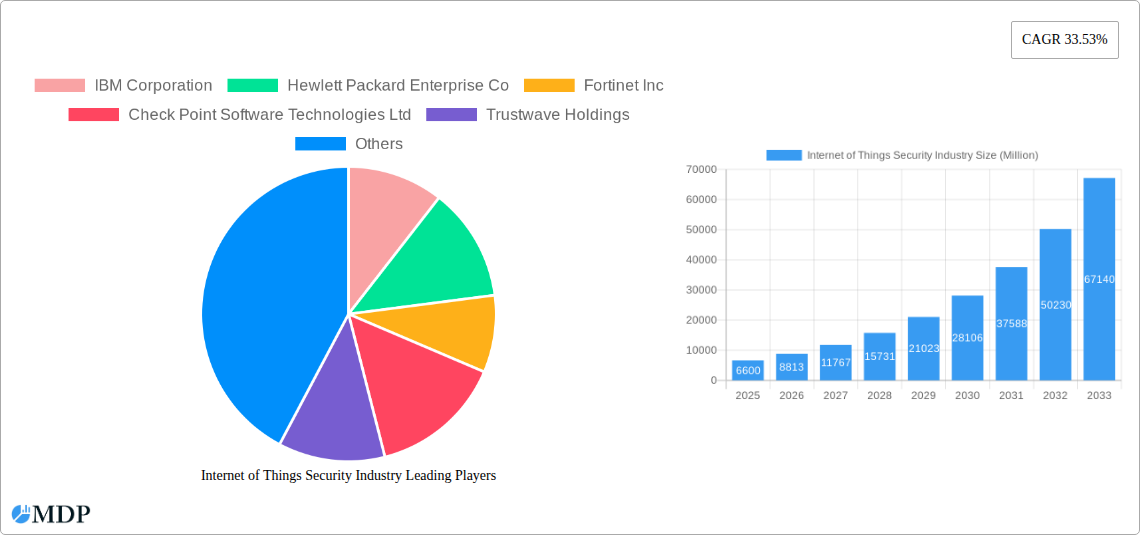
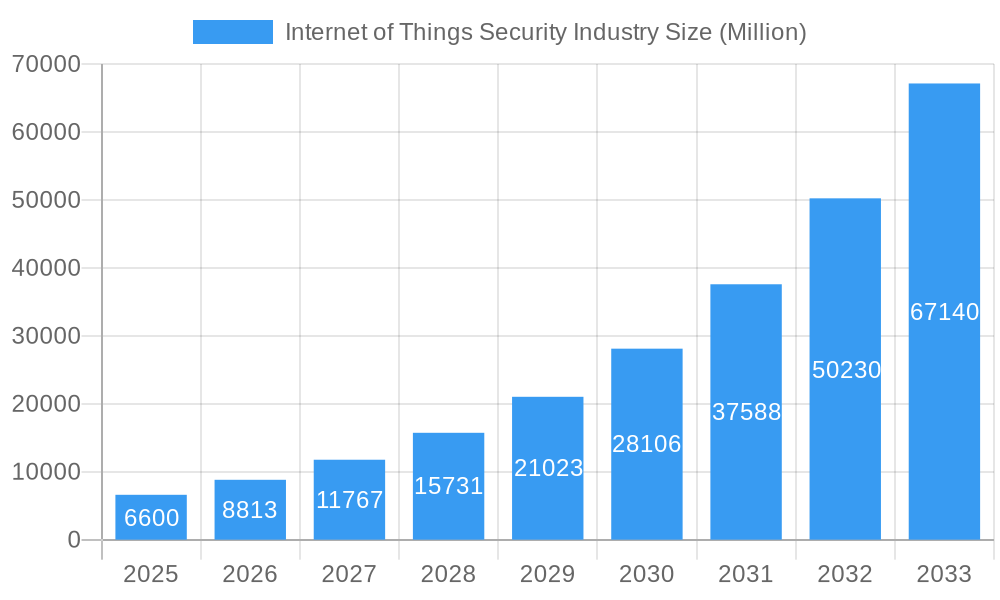
Internet of Things Security Industry Market Size (In Billion)
The competitive landscape is marked by the presence of both established technology giants like IBM and Cisco, and specialized cybersecurity firms such as Fortinet and Palo Alto Networks. These companies are vying for market dominance through continuous innovation, strategic partnerships, and acquisitions. Future growth will be significantly influenced by factors such as advancements in artificial intelligence (AI)-powered security solutions, the emergence of edge computing security technologies, and the development of standardized security protocols for IoT devices. The market's evolution is also shaped by evolving threat landscapes, necessitating ongoing adaptation and investment in robust security solutions to mitigate emerging vulnerabilities and protect against sophisticated cyberattacks. The forecast period (2025-2033) promises continued expansion, with regional variations reflecting the pace of digital transformation and IoT adoption in different parts of the world. The market size in 2025 is estimated to be significantly larger than the 2024 size, reflecting the sustained high-growth trajectory.
Internet of Things Security Industry Company Market Share
Unlock the Potential of the Booming Internet of Things (IoT) Security Market: A Comprehensive Report (2019-2033)
This comprehensive report provides an in-depth analysis of the Internet of Things (IoT) security market, projecting a market value exceeding $XX Million by 2033. Driven by the explosive growth of connected devices and increasing cybersecurity threats, the IoT security landscape presents both immense opportunities and significant challenges. This report offers actionable insights for industry stakeholders, investors, and businesses seeking to navigate this dynamic market. Our analysis covers the period from 2019 to 2033, with a base year of 2025 and a forecast period of 2025-2033. Key players analyzed include IBM Corporation, Hewlett Packard Enterprise Co, Fortinet Inc, Check Point Software Technologies Ltd, Trustwave Holdings, Cisco Systems Inc, Thales Group (Gemalto NV), Palo Alto Networks Inc, Broadcom Inc (Symantec Corporation), AT&T Inc, and Intel Corporation.
Internet of Things Security Industry Market Dynamics & Concentration
The IoT security market is characterized by a moderately concentrated landscape with several dominant players vying for market share. The market share of the top 5 players in 2025 is estimated at approximately 60%, indicating significant consolidation. Innovation is fueled by the constant evolution of cyber threats and the need for advanced security solutions. Stringent data privacy regulations, such as GDPR and CCPA, are driving demand for compliant security technologies. Product substitution is evident with the emergence of AI-powered security solutions replacing traditional methods. Furthermore, M&A activities are prevalent, with over XX deals recorded between 2019 and 2024, signaling strategic expansion and consolidation within the industry.
- Market Concentration: Top 5 players hold ~60% market share in 2025.
- M&A Activity: Over XX deals between 2019 and 2024.
- Innovation Drivers: Evolving cyber threats, AI integration, and regulatory compliance.
- End-User Trends: Growing adoption of IoT across various sectors demands robust security measures.
Internet of Things Security Industry Industry Trends & Analysis
The IoT security market exhibits a robust CAGR of XX% during the forecast period (2025-2033). Key growth drivers include the exponential rise in connected devices across diverse industries, the increasing sophistication of cyberattacks targeting IoT infrastructure, and rising awareness among businesses and consumers regarding data security and privacy. Technological advancements like AI and Machine Learning are revolutionizing threat detection and response capabilities. Market penetration is expected to reach XX% by 2033, showcasing the growing acceptance and adoption of IoT security solutions. Competitive dynamics are marked by product innovation, strategic partnerships, and aggressive marketing strategies by leading vendors.
Leading Markets & Segments in Internet of Things Security Industry
North America currently dominates the IoT security market, fueled by strong technological advancements, robust infrastructure, and a high density of IoT deployments. Within segments, Network Security holds the largest market share, followed by Endpoint Security. Software solutions currently lead the market, but Services are experiencing rapid growth due to the increasing need for managed security services. The Automotive, Healthcare, and BFSI (Banking, Financial Services, and Insurance) sectors represent significant end-user industries, driven by increasing data sensitivity and compliance requirements.
- Dominant Region: North America
- Leading Segment (By Type): Network Security
- Leading Segment (By Solution): Software
- Key End-User Industries: Automotive, Healthcare, BFSI
- Drivers: Strong technological infrastructure (North America); increasing data sensitivity and regulations (all leading segments).
Internet of Things Security Industry Product Developments
Recent product innovations focus on AI-driven threat detection, enhanced encryption techniques, and secure hardware components. These advancements address the increasing complexity and sophistication of cyber threats, offering improved security and efficiency. The market is witnessing a shift towards integrated security solutions that provide comprehensive protection across various IoT devices and platforms. This trend reflects a growing preference for holistic security approaches over fragmented solutions.
Key Drivers of Internet of Things Security Growth
The IoT security market's growth is propelled by several key factors. Technological advancements, including AI and machine learning, enhance threat detection and response capabilities. Government regulations like GDPR and CCPA are mandating robust security measures, while the expanding adoption of IoT across diverse industries necessitates comprehensive security solutions. The economic incentive of preventing costly data breaches is another strong driver for increased investment in IoT security.
Challenges in the Internet of Things Security Industry Market
Significant barriers exist, including interoperability issues across different IoT devices and platforms, the complexity of securing diverse IoT ecosystems, and a shortage of skilled cybersecurity professionals. Regulatory compliance requirements can also be complex and costly to meet. Furthermore, the ever-evolving nature of cyber threats necessitates continuous investment in R&D, posing a challenge for smaller players. These factors contribute to a restrained market growth, which is expected to be overcome through technological advancements and increased collaboration.
Emerging Opportunities in Internet of Things Security Industry
Significant opportunities exist in the development and deployment of AI-powered security solutions, enhanced blockchain-based security technologies, and the expansion of managed security services. Strategic partnerships between technology providers and end-user industries will facilitate the adoption of innovative security solutions, and the growth of IoT in emerging economies presents a vast untapped market potential.
Leading Players in the Internet of Things Security Industry Sector
Key Milestones in Internet of Things Security Industry Industry
- 2020: Increased focus on zero-trust security models.
- 2021: Significant rise in ransomware attacks targeting IoT devices.
- 2022: Launch of several AI-powered IoT security platforms.
- 2023: Increased regulatory scrutiny on IoT data security.
- 2024: Several major mergers and acquisitions in the industry.
Strategic Outlook for Internet of Things Security Market
The IoT security market is poised for substantial growth driven by technological innovation, regulatory compliance mandates, and the increasing adoption of IoT across various sectors. Strategic partnerships, aggressive R&D investments, and a focus on providing comprehensive and user-friendly security solutions will be crucial for success in this highly competitive landscape. The long-term potential of the market is immense, particularly as the number of connected devices continues its rapid growth trajectory.
Internet of Things Security Industry Segmentation
-
1. Type of Security
- 1.1. Network Security
- 1.2. End-point Security
-
2. Solution
- 2.1. Software
- 2.2. Services
-
3. End-user Industry
- 3.1. Automotive
- 3.2. Healthcare
- 3.3. Government
- 3.4. Manufacturing
- 3.5. Energy & power
- 3.6. Retail
- 3.7. BFSI
- 3.8. Others End-user Industries
Internet of Things Security Industry Segmentation By Geography
-
1. North America
- 1.1. United States
- 1.2. Canada
-
2. Europe
- 2.1. United Kingdom
- 2.2. Germany
- 2.3. France
- 2.4. Rest of Europe
-
3. Asia Pacific
- 3.1. China
- 3.2. Japan
- 3.3. India
- 3.4. South Korea
- 3.5. Rest of Asia Pacific
-
4. Latin America
- 4.1. Mexico
- 4.2. Brazil
- 4.3. Rest of Latin America
- 5. Middle East
-
6. United Arab Emirates
- 6.1. Saudi Arabia
- 6.2. Rest of Middle East
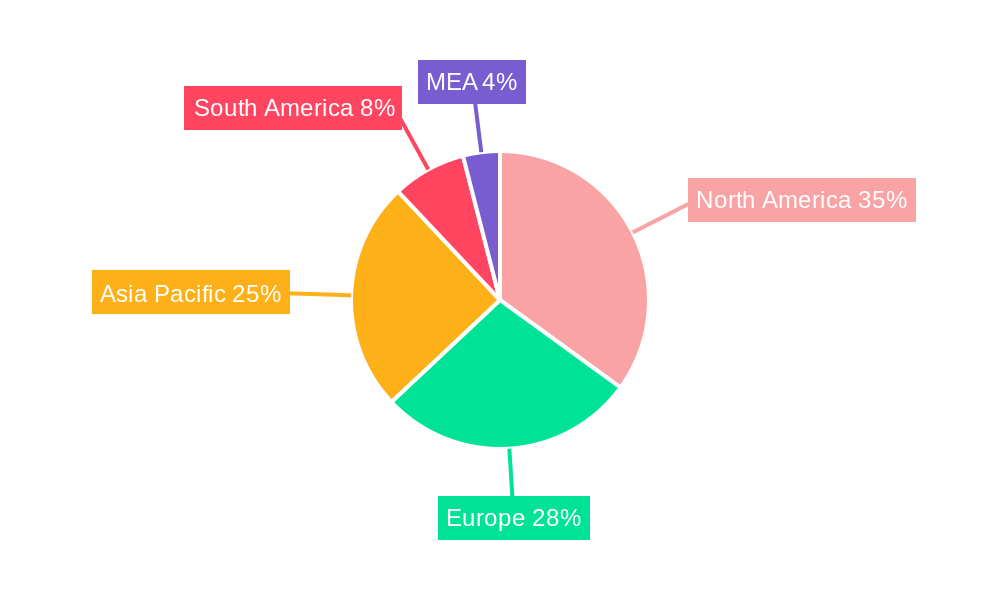
Internet of Things Security Industry Regional Market Share
Geographic Coverage of Internet of Things Security Industry
Internet of Things Security Industry REPORT HIGHLIGHTS
| Aspects | Details |
|---|---|
| Study Period | 2020-2034 |
| Base Year | 2025 |
| Estimated Year | 2026 |
| Forecast Period | 2026-2034 |
| Historical Period | 2020-2025 |
| Growth Rate | CAGR of 33.53% from 2020-2034 |
| Segmentation |
|
Table of Contents
- 1. Introduction
- 1.1. Research Scope
- 1.2. Market Segmentation
- 1.3. Research Methodology
- 1.4. Definitions and Assumptions
- 2. Executive Summary
- 2.1. Introduction
- 3. Market Dynamics
- 3.1. Introduction
- 3.2. Market Drivers
- 3.2.1. ; Increasing Number of Data Breaches; Emergence of Smart Cities
- 3.3. Market Restrains
- 3.3.1 ; Growing Complexity among Devices
- 3.3.2 Coupled with the Lack of Ubiquitous Legislation
- 3.4. Market Trends
- 3.4.1. Network Security Is Expected to Witness the Fastest Growth Rate
- 4. Market Factor Analysis
- 4.1. Porters Five Forces
- 4.2. Supply/Value Chain
- 4.3. PESTEL analysis
- 4.4. Market Entropy
- 4.5. Patent/Trademark Analysis
- 5. Global Internet of Things Security Industry Analysis, Insights and Forecast, 2020-2032
- 5.1. Market Analysis, Insights and Forecast - by Type of Security
- 5.1.1. Network Security
- 5.1.2. End-point Security
- 5.2. Market Analysis, Insights and Forecast - by Solution
- 5.2.1. Software
- 5.2.2. Services
- 5.3. Market Analysis, Insights and Forecast - by End-user Industry
- 5.3.1. Automotive
- 5.3.2. Healthcare
- 5.3.3. Government
- 5.3.4. Manufacturing
- 5.3.5. Energy & power
- 5.3.6. Retail
- 5.3.7. BFSI
- 5.3.8. Others End-user Industries
- 5.4. Market Analysis, Insights and Forecast - by Region
- 5.4.1. North America
- 5.4.2. Europe
- 5.4.3. Asia Pacific
- 5.4.4. Latin America
- 5.4.5. Middle East
- 5.4.6. United Arab Emirates
- 5.1. Market Analysis, Insights and Forecast - by Type of Security
- 6. North America Internet of Things Security Industry Analysis, Insights and Forecast, 2020-2032
- 6.1. Market Analysis, Insights and Forecast - by Type of Security
- 6.1.1. Network Security
- 6.1.2. End-point Security
- 6.2. Market Analysis, Insights and Forecast - by Solution
- 6.2.1. Software
- 6.2.2. Services
- 6.3. Market Analysis, Insights and Forecast - by End-user Industry
- 6.3.1. Automotive
- 6.3.2. Healthcare
- 6.3.3. Government
- 6.3.4. Manufacturing
- 6.3.5. Energy & power
- 6.3.6. Retail
- 6.3.7. BFSI
- 6.3.8. Others End-user Industries
- 6.1. Market Analysis, Insights and Forecast - by Type of Security
- 7. Europe Internet of Things Security Industry Analysis, Insights and Forecast, 2020-2032
- 7.1. Market Analysis, Insights and Forecast - by Type of Security
- 7.1.1. Network Security
- 7.1.2. End-point Security
- 7.2. Market Analysis, Insights and Forecast - by Solution
- 7.2.1. Software
- 7.2.2. Services
- 7.3. Market Analysis, Insights and Forecast - by End-user Industry
- 7.3.1. Automotive
- 7.3.2. Healthcare
- 7.3.3. Government
- 7.3.4. Manufacturing
- 7.3.5. Energy & power
- 7.3.6. Retail
- 7.3.7. BFSI
- 7.3.8. Others End-user Industries
- 7.1. Market Analysis, Insights and Forecast - by Type of Security
- 8. Asia Pacific Internet of Things Security Industry Analysis, Insights and Forecast, 2020-2032
- 8.1. Market Analysis, Insights and Forecast - by Type of Security
- 8.1.1. Network Security
- 8.1.2. End-point Security
- 8.2. Market Analysis, Insights and Forecast - by Solution
- 8.2.1. Software
- 8.2.2. Services
- 8.3. Market Analysis, Insights and Forecast - by End-user Industry
- 8.3.1. Automotive
- 8.3.2. Healthcare
- 8.3.3. Government
- 8.3.4. Manufacturing
- 8.3.5. Energy & power
- 8.3.6. Retail
- 8.3.7. BFSI
- 8.3.8. Others End-user Industries
- 8.1. Market Analysis, Insights and Forecast - by Type of Security
- 9. Latin America Internet of Things Security Industry Analysis, Insights and Forecast, 2020-2032
- 9.1. Market Analysis, Insights and Forecast - by Type of Security
- 9.1.1. Network Security
- 9.1.2. End-point Security
- 9.2. Market Analysis, Insights and Forecast - by Solution
- 9.2.1. Software
- 9.2.2. Services
- 9.3. Market Analysis, Insights and Forecast - by End-user Industry
- 9.3.1. Automotive
- 9.3.2. Healthcare
- 9.3.3. Government
- 9.3.4. Manufacturing
- 9.3.5. Energy & power
- 9.3.6. Retail
- 9.3.7. BFSI
- 9.3.8. Others End-user Industries
- 9.1. Market Analysis, Insights and Forecast - by Type of Security
- 10. Middle East Internet of Things Security Industry Analysis, Insights and Forecast, 2020-2032
- 10.1. Market Analysis, Insights and Forecast - by Type of Security
- 10.1.1. Network Security
- 10.1.2. End-point Security
- 10.2. Market Analysis, Insights and Forecast - by Solution
- 10.2.1. Software
- 10.2.2. Services
- 10.3. Market Analysis, Insights and Forecast - by End-user Industry
- 10.3.1. Automotive
- 10.3.2. Healthcare
- 10.3.3. Government
- 10.3.4. Manufacturing
- 10.3.5. Energy & power
- 10.3.6. Retail
- 10.3.7. BFSI
- 10.3.8. Others End-user Industries
- 10.1. Market Analysis, Insights and Forecast - by Type of Security
- 11. United Arab Emirates Internet of Things Security Industry Analysis, Insights and Forecast, 2020-2032
- 11.1. Market Analysis, Insights and Forecast - by Type of Security
- 11.1.1. Network Security
- 11.1.2. End-point Security
- 11.2. Market Analysis, Insights and Forecast - by Solution
- 11.2.1. Software
- 11.2.2. Services
- 11.3. Market Analysis, Insights and Forecast - by End-user Industry
- 11.3.1. Automotive
- 11.3.2. Healthcare
- 11.3.3. Government
- 11.3.4. Manufacturing
- 11.3.5. Energy & power
- 11.3.6. Retail
- 11.3.7. BFSI
- 11.3.8. Others End-user Industries
- 11.1. Market Analysis, Insights and Forecast - by Type of Security
- 12. Competitive Analysis
- 12.1. Global Market Share Analysis 2025
- 12.2. Company Profiles
- 12.2.1 IBM Corporation
- 12.2.1.1. Overview
- 12.2.1.2. Products
- 12.2.1.3. SWOT Analysis
- 12.2.1.4. Recent Developments
- 12.2.1.5. Financials (Based on Availability)
- 12.2.2 Hewlett Packard Enterprise Co
- 12.2.2.1. Overview
- 12.2.2.2. Products
- 12.2.2.3. SWOT Analysis
- 12.2.2.4. Recent Developments
- 12.2.2.5. Financials (Based on Availability)
- 12.2.3 Fortinet Inc
- 12.2.3.1. Overview
- 12.2.3.2. Products
- 12.2.3.3. SWOT Analysis
- 12.2.3.4. Recent Developments
- 12.2.3.5. Financials (Based on Availability)
- 12.2.4 Check Point Software Technologies Ltd
- 12.2.4.1. Overview
- 12.2.4.2. Products
- 12.2.4.3. SWOT Analysis
- 12.2.4.4. Recent Developments
- 12.2.4.5. Financials (Based on Availability)
- 12.2.5 Trustwave Holdings
- 12.2.5.1. Overview
- 12.2.5.2. Products
- 12.2.5.3. SWOT Analysis
- 12.2.5.4. Recent Developments
- 12.2.5.5. Financials (Based on Availability)
- 12.2.6 Cisco Systems Inc
- 12.2.6.1. Overview
- 12.2.6.2. Products
- 12.2.6.3. SWOT Analysis
- 12.2.6.4. Recent Developments
- 12.2.6.5. Financials (Based on Availability)
- 12.2.7 Thales Group (Gemalto NV)
- 12.2.7.1. Overview
- 12.2.7.2. Products
- 12.2.7.3. SWOT Analysis
- 12.2.7.4. Recent Developments
- 12.2.7.5. Financials (Based on Availability)
- 12.2.8 Palo Alto Networks Inc
- 12.2.8.1. Overview
- 12.2.8.2. Products
- 12.2.8.3. SWOT Analysis
- 12.2.8.4. Recent Developments
- 12.2.8.5. Financials (Based on Availability)
- 12.2.9 Broadcom Inc (Symantec Corporation)
- 12.2.9.1. Overview
- 12.2.9.2. Products
- 12.2.9.3. SWOT Analysis
- 12.2.9.4. Recent Developments
- 12.2.9.5. Financials (Based on Availability)
- 12.2.10 AT&T Inc
- 12.2.10.1. Overview
- 12.2.10.2. Products
- 12.2.10.3. SWOT Analysis
- 12.2.10.4. Recent Developments
- 12.2.10.5. Financials (Based on Availability)
- 12.2.11 Intel Corporation
- 12.2.11.1. Overview
- 12.2.11.2. Products
- 12.2.11.3. SWOT Analysis
- 12.2.11.4. Recent Developments
- 12.2.11.5. Financials (Based on Availability)
- 12.2.1 IBM Corporation
List of Figures
- Figure 1: Global Internet of Things Security Industry Revenue Breakdown (Million, %) by Region 2025 & 2033
- Figure 2: North America Internet of Things Security Industry Revenue (Million), by Type of Security 2025 & 2033
- Figure 3: North America Internet of Things Security Industry Revenue Share (%), by Type of Security 2025 & 2033
- Figure 4: North America Internet of Things Security Industry Revenue (Million), by Solution 2025 & 2033
- Figure 5: North America Internet of Things Security Industry Revenue Share (%), by Solution 2025 & 2033
- Figure 6: North America Internet of Things Security Industry Revenue (Million), by End-user Industry 2025 & 2033
- Figure 7: North America Internet of Things Security Industry Revenue Share (%), by End-user Industry 2025 & 2033
- Figure 8: North America Internet of Things Security Industry Revenue (Million), by Country 2025 & 2033
- Figure 9: North America Internet of Things Security Industry Revenue Share (%), by Country 2025 & 2033
- Figure 10: Europe Internet of Things Security Industry Revenue (Million), by Type of Security 2025 & 2033
- Figure 11: Europe Internet of Things Security Industry Revenue Share (%), by Type of Security 2025 & 2033
- Figure 12: Europe Internet of Things Security Industry Revenue (Million), by Solution 2025 & 2033
- Figure 13: Europe Internet of Things Security Industry Revenue Share (%), by Solution 2025 & 2033
- Figure 14: Europe Internet of Things Security Industry Revenue (Million), by End-user Industry 2025 & 2033
- Figure 15: Europe Internet of Things Security Industry Revenue Share (%), by End-user Industry 2025 & 2033
- Figure 16: Europe Internet of Things Security Industry Revenue (Million), by Country 2025 & 2033
- Figure 17: Europe Internet of Things Security Industry Revenue Share (%), by Country 2025 & 2033
- Figure 18: Asia Pacific Internet of Things Security Industry Revenue (Million), by Type of Security 2025 & 2033
- Figure 19: Asia Pacific Internet of Things Security Industry Revenue Share (%), by Type of Security 2025 & 2033
- Figure 20: Asia Pacific Internet of Things Security Industry Revenue (Million), by Solution 2025 & 2033
- Figure 21: Asia Pacific Internet of Things Security Industry Revenue Share (%), by Solution 2025 & 2033
- Figure 22: Asia Pacific Internet of Things Security Industry Revenue (Million), by End-user Industry 2025 & 2033
- Figure 23: Asia Pacific Internet of Things Security Industry Revenue Share (%), by End-user Industry 2025 & 2033
- Figure 24: Asia Pacific Internet of Things Security Industry Revenue (Million), by Country 2025 & 2033
- Figure 25: Asia Pacific Internet of Things Security Industry Revenue Share (%), by Country 2025 & 2033
- Figure 26: Latin America Internet of Things Security Industry Revenue (Million), by Type of Security 2025 & 2033
- Figure 27: Latin America Internet of Things Security Industry Revenue Share (%), by Type of Security 2025 & 2033
- Figure 28: Latin America Internet of Things Security Industry Revenue (Million), by Solution 2025 & 2033
- Figure 29: Latin America Internet of Things Security Industry Revenue Share (%), by Solution 2025 & 2033
- Figure 30: Latin America Internet of Things Security Industry Revenue (Million), by End-user Industry 2025 & 2033
- Figure 31: Latin America Internet of Things Security Industry Revenue Share (%), by End-user Industry 2025 & 2033
- Figure 32: Latin America Internet of Things Security Industry Revenue (Million), by Country 2025 & 2033
- Figure 33: Latin America Internet of Things Security Industry Revenue Share (%), by Country 2025 & 2033
- Figure 34: Middle East Internet of Things Security Industry Revenue (Million), by Type of Security 2025 & 2033
- Figure 35: Middle East Internet of Things Security Industry Revenue Share (%), by Type of Security 2025 & 2033
- Figure 36: Middle East Internet of Things Security Industry Revenue (Million), by Solution 2025 & 2033
- Figure 37: Middle East Internet of Things Security Industry Revenue Share (%), by Solution 2025 & 2033
- Figure 38: Middle East Internet of Things Security Industry Revenue (Million), by End-user Industry 2025 & 2033
- Figure 39: Middle East Internet of Things Security Industry Revenue Share (%), by End-user Industry 2025 & 2033
- Figure 40: Middle East Internet of Things Security Industry Revenue (Million), by Country 2025 & 2033
- Figure 41: Middle East Internet of Things Security Industry Revenue Share (%), by Country 2025 & 2033
- Figure 42: United Arab Emirates Internet of Things Security Industry Revenue (Million), by Type of Security 2025 & 2033
- Figure 43: United Arab Emirates Internet of Things Security Industry Revenue Share (%), by Type of Security 2025 & 2033
- Figure 44: United Arab Emirates Internet of Things Security Industry Revenue (Million), by Solution 2025 & 2033
- Figure 45: United Arab Emirates Internet of Things Security Industry Revenue Share (%), by Solution 2025 & 2033
- Figure 46: United Arab Emirates Internet of Things Security Industry Revenue (Million), by End-user Industry 2025 & 2033
- Figure 47: United Arab Emirates Internet of Things Security Industry Revenue Share (%), by End-user Industry 2025 & 2033
- Figure 48: United Arab Emirates Internet of Things Security Industry Revenue (Million), by Country 2025 & 2033
- Figure 49: United Arab Emirates Internet of Things Security Industry Revenue Share (%), by Country 2025 & 2033
List of Tables
- Table 1: Global Internet of Things Security Industry Revenue Million Forecast, by Type of Security 2020 & 2033
- Table 2: Global Internet of Things Security Industry Revenue Million Forecast, by Solution 2020 & 2033
- Table 3: Global Internet of Things Security Industry Revenue Million Forecast, by End-user Industry 2020 & 2033
- Table 4: Global Internet of Things Security Industry Revenue Million Forecast, by Region 2020 & 2033
- Table 5: Global Internet of Things Security Industry Revenue Million Forecast, by Type of Security 2020 & 2033
- Table 6: Global Internet of Things Security Industry Revenue Million Forecast, by Solution 2020 & 2033
- Table 7: Global Internet of Things Security Industry Revenue Million Forecast, by End-user Industry 2020 & 2033
- Table 8: Global Internet of Things Security Industry Revenue Million Forecast, by Country 2020 & 2033
- Table 9: United States Internet of Things Security Industry Revenue (Million) Forecast, by Application 2020 & 2033
- Table 10: Canada Internet of Things Security Industry Revenue (Million) Forecast, by Application 2020 & 2033
- Table 11: Global Internet of Things Security Industry Revenue Million Forecast, by Type of Security 2020 & 2033
- Table 12: Global Internet of Things Security Industry Revenue Million Forecast, by Solution 2020 & 2033
- Table 13: Global Internet of Things Security Industry Revenue Million Forecast, by End-user Industry 2020 & 2033
- Table 14: Global Internet of Things Security Industry Revenue Million Forecast, by Country 2020 & 2033
- Table 15: United Kingdom Internet of Things Security Industry Revenue (Million) Forecast, by Application 2020 & 2033
- Table 16: Germany Internet of Things Security Industry Revenue (Million) Forecast, by Application 2020 & 2033
- Table 17: France Internet of Things Security Industry Revenue (Million) Forecast, by Application 2020 & 2033
- Table 18: Rest of Europe Internet of Things Security Industry Revenue (Million) Forecast, by Application 2020 & 2033
- Table 19: Global Internet of Things Security Industry Revenue Million Forecast, by Type of Security 2020 & 2033
- Table 20: Global Internet of Things Security Industry Revenue Million Forecast, by Solution 2020 & 2033
- Table 21: Global Internet of Things Security Industry Revenue Million Forecast, by End-user Industry 2020 & 2033
- Table 22: Global Internet of Things Security Industry Revenue Million Forecast, by Country 2020 & 2033
- Table 23: China Internet of Things Security Industry Revenue (Million) Forecast, by Application 2020 & 2033
- Table 24: Japan Internet of Things Security Industry Revenue (Million) Forecast, by Application 2020 & 2033
- Table 25: India Internet of Things Security Industry Revenue (Million) Forecast, by Application 2020 & 2033
- Table 26: South Korea Internet of Things Security Industry Revenue (Million) Forecast, by Application 2020 & 2033
- Table 27: Rest of Asia Pacific Internet of Things Security Industry Revenue (Million) Forecast, by Application 2020 & 2033
- Table 28: Global Internet of Things Security Industry Revenue Million Forecast, by Type of Security 2020 & 2033
- Table 29: Global Internet of Things Security Industry Revenue Million Forecast, by Solution 2020 & 2033
- Table 30: Global Internet of Things Security Industry Revenue Million Forecast, by End-user Industry 2020 & 2033
- Table 31: Global Internet of Things Security Industry Revenue Million Forecast, by Country 2020 & 2033
- Table 32: Mexico Internet of Things Security Industry Revenue (Million) Forecast, by Application 2020 & 2033
- Table 33: Brazil Internet of Things Security Industry Revenue (Million) Forecast, by Application 2020 & 2033
- Table 34: Rest of Latin America Internet of Things Security Industry Revenue (Million) Forecast, by Application 2020 & 2033
- Table 35: Global Internet of Things Security Industry Revenue Million Forecast, by Type of Security 2020 & 2033
- Table 36: Global Internet of Things Security Industry Revenue Million Forecast, by Solution 2020 & 2033
- Table 37: Global Internet of Things Security Industry Revenue Million Forecast, by End-user Industry 2020 & 2033
- Table 38: Global Internet of Things Security Industry Revenue Million Forecast, by Country 2020 & 2033
- Table 39: Global Internet of Things Security Industry Revenue Million Forecast, by Type of Security 2020 & 2033
- Table 40: Global Internet of Things Security Industry Revenue Million Forecast, by Solution 2020 & 2033
- Table 41: Global Internet of Things Security Industry Revenue Million Forecast, by End-user Industry 2020 & 2033
- Table 42: Global Internet of Things Security Industry Revenue Million Forecast, by Country 2020 & 2033
- Table 43: Saudi Arabia Internet of Things Security Industry Revenue (Million) Forecast, by Application 2020 & 2033
- Table 44: Rest of Middle East Internet of Things Security Industry Revenue (Million) Forecast, by Application 2020 & 2033
Frequently Asked Questions
1. What is the projected Compound Annual Growth Rate (CAGR) of the Internet of Things Security Industry?
The projected CAGR is approximately 33.53%.
2. Which companies are prominent players in the Internet of Things Security Industry?
Key companies in the market include IBM Corporation, Hewlett Packard Enterprise Co, Fortinet Inc, Check Point Software Technologies Ltd, Trustwave Holdings, Cisco Systems Inc, Thales Group (Gemalto NV), Palo Alto Networks Inc , Broadcom Inc (Symantec Corporation), AT&T Inc, Intel Corporation.
3. What are the main segments of the Internet of Things Security Industry?
The market segments include Type of Security, Solution, End-user Industry.
4. Can you provide details about the market size?
The market size is estimated to be USD 6.60 Million as of 2022.
5. What are some drivers contributing to market growth?
; Increasing Number of Data Breaches; Emergence of Smart Cities.
6. What are the notable trends driving market growth?
Network Security Is Expected to Witness the Fastest Growth Rate.
7. Are there any restraints impacting market growth?
; Growing Complexity among Devices. Coupled with the Lack of Ubiquitous Legislation.
8. Can you provide examples of recent developments in the market?
N/A
9. What pricing options are available for accessing the report?
Pricing options include single-user, multi-user, and enterprise licenses priced at USD 4750, USD 5250, and USD 8750 respectively.
10. Is the market size provided in terms of value or volume?
The market size is provided in terms of value, measured in Million.
11. Are there any specific market keywords associated with the report?
Yes, the market keyword associated with the report is "Internet of Things Security Industry," which aids in identifying and referencing the specific market segment covered.
12. How do I determine which pricing option suits my needs best?
The pricing options vary based on user requirements and access needs. Individual users may opt for single-user licenses, while businesses requiring broader access may choose multi-user or enterprise licenses for cost-effective access to the report.
13. Are there any additional resources or data provided in the Internet of Things Security Industry report?
While the report offers comprehensive insights, it's advisable to review the specific contents or supplementary materials provided to ascertain if additional resources or data are available.
14. How can I stay updated on further developments or reports in the Internet of Things Security Industry?
To stay informed about further developments, trends, and reports in the Internet of Things Security Industry, consider subscribing to industry newsletters, following relevant companies and organizations, or regularly checking reputable industry news sources and publications.
Methodology
Step 1 - Identification of Relevant Samples Size from Population Database


Step 2 - Approaches for Defining Global Market Size (Value, Volume* & Price*)

Note*: In applicable scenarios
Step 3 - Data Sources
Primary Research
- Web Analytics
- Survey Reports
- Research Institute
- Latest Research Reports
- Opinion Leaders
Secondary Research
- Annual Reports
- White Paper
- Latest Press Release
- Industry Association
- Paid Database
- Investor Presentations

Step 4 - Data Triangulation
Involves using different sources of information in order to increase the validity of a study
These sources are likely to be stakeholders in a program - participants, other researchers, program staff, other community members, and so on.
Then we put all data in single framework & apply various statistical tools to find out the dynamic on the market.
During the analysis stage, feedback from the stakeholder groups would be compared to determine areas of agreement as well as areas of divergence