

Key Insights
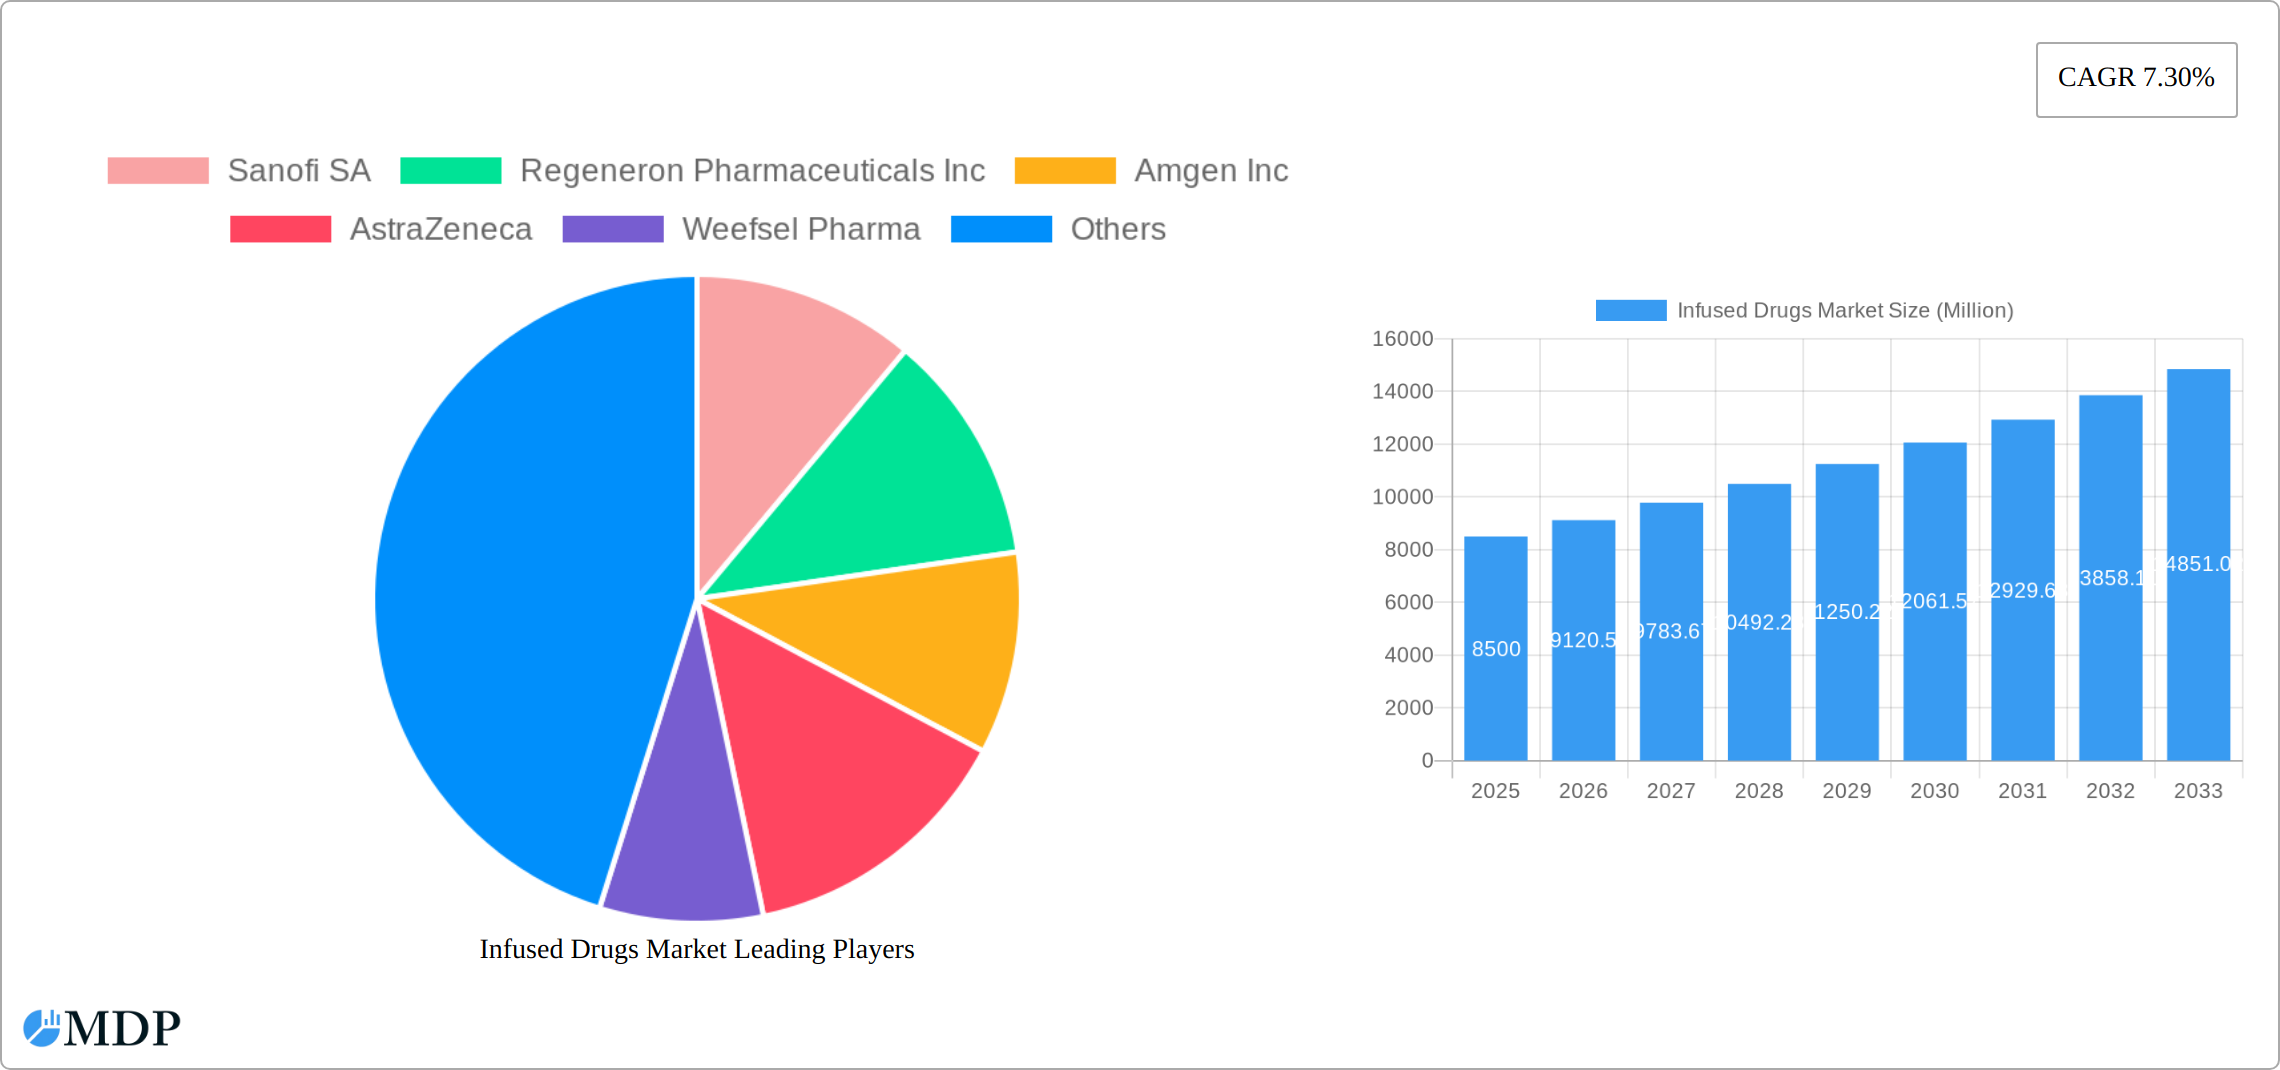
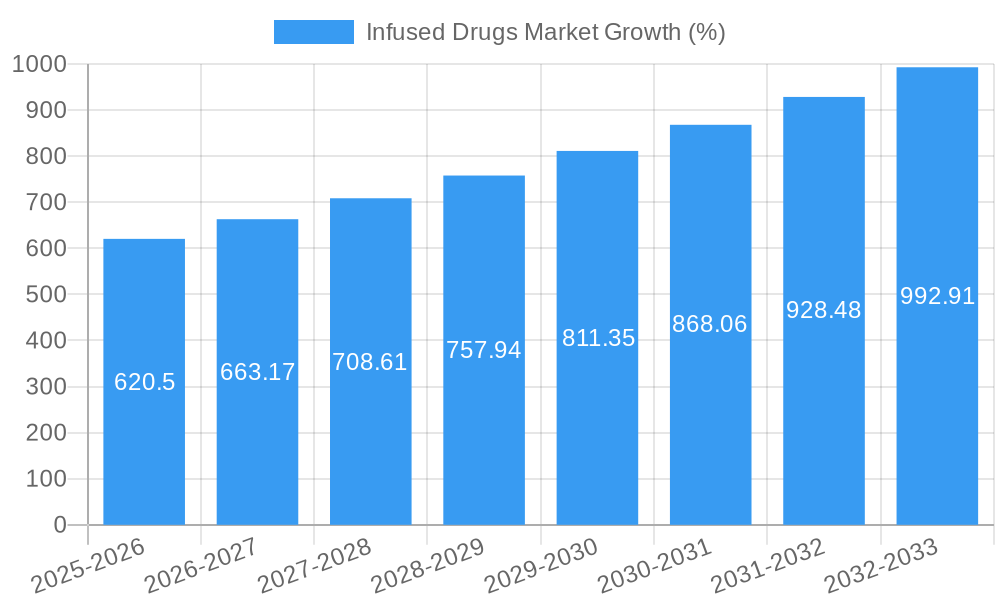
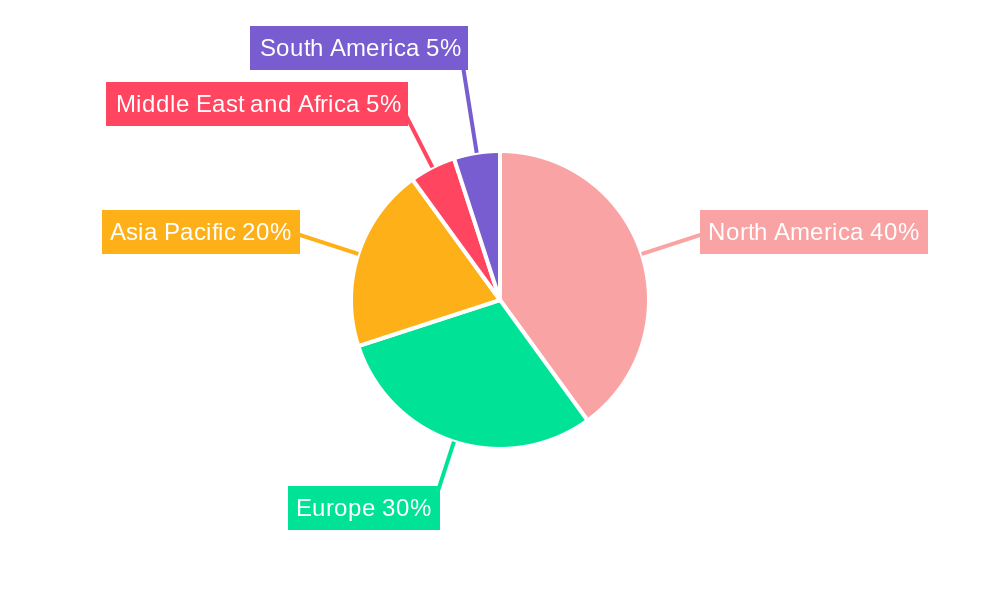
The infused drugs market, valued at $8.5 billion in 2025, is projected to experience robust growth, driven by a compound annual growth rate (CAGR) of 7.3% from 2025 to 2033. This expansion is fueled by several key factors. The increasing prevalence of chronic diseases like cancer, autoimmune disorders, and cardiovascular diseases necessitates the use of infused drugs for effective treatment. Advancements in drug delivery technologies, leading to improved efficacy and reduced side effects, are further bolstering market growth. The development of targeted therapies and biosimilars is also contributing to market expansion, offering cost-effective alternatives to existing treatments. Furthermore, rising healthcare expenditure globally and increasing government initiatives to improve healthcare infrastructure in developing economies are positively influencing market dynamics. The market is segmented by drug type (small molecules and biologics) and therapeutic area (oncology, gastrointestinal diseases, rheumatoid arthritis, immune deficiencies, cardiology, neurology, diabetes, and other therapeutic areas), each demonstrating varying growth trajectories based on specific disease prevalence and treatment advancements. North America and Europe currently hold a significant market share, owing to advanced healthcare infrastructure and high adoption rates, but the Asia-Pacific region is expected to witness substantial growth in the coming years due to increasing healthcare awareness and rising disposable incomes.
Competition within the infused drugs market is intense, with major players such as Sanofi SA, Regeneron Pharmaceuticals Inc, Amgen Inc, AstraZeneca, and Pfizer Inc continuously striving to innovate and expand their product portfolios. The market landscape is characterized by strategic alliances, mergers and acquisitions, and the development of novel infused drugs to maintain a competitive edge. However, high research and development costs, stringent regulatory approvals, and potential side effects associated with certain infused drugs pose significant challenges to market growth. The successful navigation of these challenges, along with continued focus on innovation and patient accessibility, will be crucial in driving future expansion of the infused drugs market.
Infused Drugs Market Report: A Comprehensive Analysis (2019-2033)
This comprehensive report provides a detailed analysis of the Infused Drugs Market, offering invaluable insights for stakeholders across the pharmaceutical industry. With a study period spanning 2019-2033, a base year of 2025, and a forecast period of 2025-2033, this report unveils crucial market dynamics, trends, and opportunities. The report encompasses market sizing, segmentation analysis, competitive landscape, and future projections, equipping you with the knowledge to make informed strategic decisions. Expect granular data, insightful analysis, and actionable recommendations to navigate the complexities of this dynamic market.
Infused Drugs Market Market Dynamics & Concentration
The Infused Drugs Market exhibits a moderately concentrated landscape, with a handful of multinational pharmaceutical giants holding significant market share. The market's dynamics are shaped by continuous innovation in drug delivery systems, stringent regulatory frameworks, and the emergence of biosimilar competition. Market concentration is expected to remain relatively stable throughout the forecast period, although strategic mergers and acquisitions (M&A) activity could alter the competitive dynamics. The top 10 players account for approximately xx% of the global market share in 2025. M&A activity in the historical period (2019-2024) saw approximately xx deals, mostly focused on expanding therapeutic areas and geographical reach. Innovation drivers include the development of targeted therapies, personalized medicine approaches, and advancements in drug delivery technologies, such as sustained-release formulations and improved infusion devices.
- Market Share: Top 10 players hold approximately xx% of the market in 2025.
- M&A Activity: Approximately xx deals observed between 2019 and 2024.
- Regulatory Landscape: Stringent regulatory approvals influence market entry and product lifecycle management.
- Product Substitutes: Biosimilars and generic infused drugs present competitive pressures.
- End-User Trends: Increasing prevalence of chronic diseases fuels demand for infused drugs.
Infused Drugs Market Industry Trends & Analysis
The Infused Drugs Market is projected to experience a Compound Annual Growth Rate (CAGR) of xx% during the forecast period (2025-2033). This robust growth is propelled by several factors, including the rising prevalence of chronic diseases like cancer, autoimmune disorders, and cardiovascular conditions, alongside increased healthcare expenditure globally. Technological disruptions, such as the advancement of targeted therapies and personalized medicine, are significantly influencing market growth. Consumer preferences are shifting towards more convenient and less invasive drug delivery methods, driving the adoption of subcutaneous and other advanced infusion technologies. The competitive landscape is characterized by intense R&D investments, strategic alliances, and a continuous influx of innovative products. Market penetration of biosimilars is increasing steadily, although brand-name drugs still dominate.
Leading Markets & Segments in Infused Drugs Market
The Oncology therapeutic area currently holds the largest market share within the Infused Drugs Market, driven by the increasing incidence of various cancer types and ongoing advancements in cancer therapies. North America and Europe represent the leading regional markets, fueled by high healthcare expenditure, robust healthcare infrastructure, and a large patient population. Within drug types, Biologics account for a larger share compared to small molecules, due to their high efficacy in treating complex diseases.
Leading Region: North America
Dominant Therapeutic Area: Oncology
Key Drivers for North America: High healthcare expenditure and advanced infrastructure.
Key Drivers for Europe: Similar to North America, coupled with proactive government policies promoting healthcare innovation.
Drug Type Dominance: Biologics
Other key segments and their driving forces (paragraphs):
Gastrointestinal Diseases: Increasing prevalence of inflammatory bowel disease and other GI disorders fuels segment growth.
Rheumatoid Arthritis: The rising incidence of RA and effectiveness of infused biologics contribute to substantial growth.
Immune Deficiencies: Growing awareness and better treatment options for immune deficiencies drive this segment.
Cardiology: Infused drugs are crucial in treating cardiovascular diseases, supporting significant market expansion.
Neurology: Innovative therapies for neurological disorders are driving segment growth, with Alzheimer's showing promising potential.
Diabetes: Infused insulin remains a cornerstone treatment, assuring stable growth in the segment.
Other Therapeutic Areas: This segment exhibits steady growth driven by the diversity of diseases treated with infused drugs.
Infused Drugs Market Product Developments
Recent product innovations focus on enhancing drug delivery systems, improving patient compliance, and reducing side effects. Subcutaneous delivery systems, smart infusion pumps, and personalized formulations are gaining traction. These advancements cater to the growing need for convenient and effective drug administration, enhancing market penetration and improving patient outcomes. The emphasis is on targeted therapies and biosimilars, offering cost-effective alternatives while maintaining therapeutic efficacy.
Key Drivers of Infused Drugs Market Growth
Several factors contribute to the Infused Drugs Market's expansion. Technological advancements, particularly in drug delivery systems and targeted therapies, are key drivers. The escalating prevalence of chronic diseases necessitates more effective treatments, further stimulating demand. Favorable regulatory policies and increased healthcare spending in many regions bolster market growth. For example, the recent approval of LEQEMBI highlights the potential for breakthrough therapies to significantly impact the market.
Challenges in the Infused Drugs Market Market
The market faces challenges including stringent regulatory approval processes, which can delay product launches and increase development costs. Supply chain disruptions and fluctuations in raw material prices can impact production and profitability. Intense competition from both established players and emerging biosimilar manufacturers adds pressure on pricing and market share. These factors could potentially reduce market growth by xx% if not adequately addressed.
Emerging Opportunities in Infused Drugs Market
Emerging opportunities lie in the development of novel drug delivery systems, the expansion into emerging markets, and strategic collaborations between pharmaceutical companies and biotechnology firms. Technological breakthroughs in areas like personalized medicine and gene therapy hold immense potential for future growth. The increasing focus on value-based healthcare and the adoption of innovative reimbursement models create new opportunities for market expansion.
Leading Players in the Infused Drugs Market Sector
- Sanofi SA
- Regeneron Pharmaceuticals Inc
- Amgen Inc
- AstraZeneca
- Weefsel Pharma
- Parenteral Drugs (India) Limited
- Teva Pharmaceutical Industries Ltd
- Eisai Co Ltd
- Bristol-Myers Squibb Company
- Pfizer Inc
Key Milestones in Infused Drugs Market Industry
- September 2023: Eisai Co. Ltd and Biogen Inc. secured approval for LEQEMBI intravenous infusion in Japan, marking a significant advancement in Alzheimer's disease treatment.
- August 2023: Roche’s Tecentriq SC, utilizing Halozyme’s Enhaze technology, received MHRA approval in Britain, demonstrating advancements in subcutaneous drug delivery.
Strategic Outlook for Infused Drugs Market Market
The Infused Drugs Market holds substantial long-term growth potential, driven by ongoing technological advancements, the rising prevalence of chronic diseases, and increased healthcare investments. Strategic partnerships, focused R&D efforts, and expansion into emerging markets will be crucial for success. Companies that effectively navigate regulatory hurdles and adapt to evolving consumer preferences will be best positioned to capture significant market share in the years to come.
Infused Drugs Market Segmentation
-
1. Drug Type
- 1.1. Small Molecules
- 1.2. Biologics
-
2. Therapeutic Area
- 2.1. Oncology
- 2.2. Gastrointestinal Diseases
- 2.3. Rheumatoid Arthritis
- 2.4. Immune Deficiencies
- 2.5. Cardiology
- 2.6. Neurology
- 2.7. Diabetes
- 2.8. Other Therapeutic Areas
Infused Drugs Market Segmentation By Geography
-
1. North America
- 1.1. United States
- 1.2. Canada
- 1.3. Mexico
-
2. Europe
- 2.1. Germany
- 2.2. United Kingdom
- 2.3. France
- 2.4. Italy
- 2.5. Spain
- 2.6. Rest of Europe
-
3. Asia Pacific
- 3.1. China
- 3.2. Japan
- 3.3. India
- 3.4. Australia
- 3.5. South Korea
- 3.6. Rest of Asia Pacific
-
4. Middle East and Africa
- 4.1. GCC
- 4.2. South Africa
- 4.3. Rest of Middle East and Africa
-
5. South America
- 5.1. Brazil
- 5.2. Argentina
- 5.3. Rest of South America
Infused Drugs Market REPORT HIGHLIGHTS
| Aspects | Details |
|---|---|
| Study Period | 2019-2033 |
| Base Year | 2024 |
| Estimated Year | 2025 |
| Forecast Period | 2025-2033 |
| Historical Period | 2019-2024 |
| Growth Rate | CAGR of 7.30% from 2019-2033 |
| Segmentation |
|
Table of Contents
- 1. Introduction
- 1.1. Research Scope
- 1.2. Market Segmentation
- 1.3. Research Methodology
- 1.4. Definitions and Assumptions
- 2. Executive Summary
- 2.1. Introduction
- 3. Market Dynamics
- 3.1. Introduction
- 3.2. Market Drivers
- 3.2.1. Increase in the Prevalence of Chronic Diseases; Increasing Geriatric Population
- 3.3. Market Restrains
- 3.3.1. Side Effects Associated with the Medications
- 3.4. Market Trends
- 3.4.1. Oncology is Expected to Have Significant Market Share During the Forecast Period
- 4. Market Factor Analysis
- 4.1. Porters Five Forces
- 4.2. Supply/Value Chain
- 4.3. PESTEL analysis
- 4.4. Market Entropy
- 4.5. Patent/Trademark Analysis
- 5. Global Infused Drugs Market Analysis, Insights and Forecast, 2019-2031
- 5.1. Market Analysis, Insights and Forecast - by Drug Type
- 5.1.1. Small Molecules
- 5.1.2. Biologics
- 5.2. Market Analysis, Insights and Forecast - by Therapeutic Area
- 5.2.1. Oncology
- 5.2.2. Gastrointestinal Diseases
- 5.2.3. Rheumatoid Arthritis
- 5.2.4. Immune Deficiencies
- 5.2.5. Cardiology
- 5.2.6. Neurology
- 5.2.7. Diabetes
- 5.2.8. Other Therapeutic Areas
- 5.3. Market Analysis, Insights and Forecast - by Region
- 5.3.1. North America
- 5.3.2. Europe
- 5.3.3. Asia Pacific
- 5.3.4. Middle East and Africa
- 5.3.5. South America
- 5.1. Market Analysis, Insights and Forecast - by Drug Type
- 6. North America Infused Drugs Market Analysis, Insights and Forecast, 2019-2031
- 6.1. Market Analysis, Insights and Forecast - by Drug Type
- 6.1.1. Small Molecules
- 6.1.2. Biologics
- 6.2. Market Analysis, Insights and Forecast - by Therapeutic Area
- 6.2.1. Oncology
- 6.2.2. Gastrointestinal Diseases
- 6.2.3. Rheumatoid Arthritis
- 6.2.4. Immune Deficiencies
- 6.2.5. Cardiology
- 6.2.6. Neurology
- 6.2.7. Diabetes
- 6.2.8. Other Therapeutic Areas
- 6.1. Market Analysis, Insights and Forecast - by Drug Type
- 7. Europe Infused Drugs Market Analysis, Insights and Forecast, 2019-2031
- 7.1. Market Analysis, Insights and Forecast - by Drug Type
- 7.1.1. Small Molecules
- 7.1.2. Biologics
- 7.2. Market Analysis, Insights and Forecast - by Therapeutic Area
- 7.2.1. Oncology
- 7.2.2. Gastrointestinal Diseases
- 7.2.3. Rheumatoid Arthritis
- 7.2.4. Immune Deficiencies
- 7.2.5. Cardiology
- 7.2.6. Neurology
- 7.2.7. Diabetes
- 7.2.8. Other Therapeutic Areas
- 7.1. Market Analysis, Insights and Forecast - by Drug Type
- 8. Asia Pacific Infused Drugs Market Analysis, Insights and Forecast, 2019-2031
- 8.1. Market Analysis, Insights and Forecast - by Drug Type
- 8.1.1. Small Molecules
- 8.1.2. Biologics
- 8.2. Market Analysis, Insights and Forecast - by Therapeutic Area
- 8.2.1. Oncology
- 8.2.2. Gastrointestinal Diseases
- 8.2.3. Rheumatoid Arthritis
- 8.2.4. Immune Deficiencies
- 8.2.5. Cardiology
- 8.2.6. Neurology
- 8.2.7. Diabetes
- 8.2.8. Other Therapeutic Areas
- 8.1. Market Analysis, Insights and Forecast - by Drug Type
- 9. Middle East and Africa Infused Drugs Market Analysis, Insights and Forecast, 2019-2031
- 9.1. Market Analysis, Insights and Forecast - by Drug Type
- 9.1.1. Small Molecules
- 9.1.2. Biologics
- 9.2. Market Analysis, Insights and Forecast - by Therapeutic Area
- 9.2.1. Oncology
- 9.2.2. Gastrointestinal Diseases
- 9.2.3. Rheumatoid Arthritis
- 9.2.4. Immune Deficiencies
- 9.2.5. Cardiology
- 9.2.6. Neurology
- 9.2.7. Diabetes
- 9.2.8. Other Therapeutic Areas
- 9.1. Market Analysis, Insights and Forecast - by Drug Type
- 10. South America Infused Drugs Market Analysis, Insights and Forecast, 2019-2031
- 10.1. Market Analysis, Insights and Forecast - by Drug Type
- 10.1.1. Small Molecules
- 10.1.2. Biologics
- 10.2. Market Analysis, Insights and Forecast - by Therapeutic Area
- 10.2.1. Oncology
- 10.2.2. Gastrointestinal Diseases
- 10.2.3. Rheumatoid Arthritis
- 10.2.4. Immune Deficiencies
- 10.2.5. Cardiology
- 10.2.6. Neurology
- 10.2.7. Diabetes
- 10.2.8. Other Therapeutic Areas
- 10.1. Market Analysis, Insights and Forecast - by Drug Type
- 11. North America Infused Drugs Market Analysis, Insights and Forecast, 2019-2031
- 11.1. Market Analysis, Insights and Forecast - By Country/Sub-region
- 11.1.1. undefined
- 12. Europe Infused Drugs Market Analysis, Insights and Forecast, 2019-2031
- 12.1. Market Analysis, Insights and Forecast - By Country/Sub-region
- 12.1.1. undefined
- 13. Asia Pacific Infused Drugs Market Analysis, Insights and Forecast, 2019-2031
- 13.1. Market Analysis, Insights and Forecast - By Country/Sub-region
- 13.1.1. undefined
- 14. Middle East and Africa Infused Drugs Market Analysis, Insights and Forecast, 2019-2031
- 14.1. Market Analysis, Insights and Forecast - By Country/Sub-region
- 14.1.1. undefined
- 15. South America Infused Drugs Market Analysis, Insights and Forecast, 2019-2031
- 15.1. Market Analysis, Insights and Forecast - By Country/Sub-region
- 15.1.1. undefined
- 16. Competitive Analysis
- 16.1. Global Market Share Analysis 2024
- 16.2. Company Profiles
- 16.2.1 Sanofi SA
- 16.2.1.1. Overview
- 16.2.1.2. Products
- 16.2.1.3. SWOT Analysis
- 16.2.1.4. Recent Developments
- 16.2.1.5. Financials (Based on Availability)
- 16.2.2 Regeneron Pharmaceuticals Inc
- 16.2.2.1. Overview
- 16.2.2.2. Products
- 16.2.2.3. SWOT Analysis
- 16.2.2.4. Recent Developments
- 16.2.2.5. Financials (Based on Availability)
- 16.2.3 Amgen Inc
- 16.2.3.1. Overview
- 16.2.3.2. Products
- 16.2.3.3. SWOT Analysis
- 16.2.3.4. Recent Developments
- 16.2.3.5. Financials (Based on Availability)
- 16.2.4 AstraZeneca
- 16.2.4.1. Overview
- 16.2.4.2. Products
- 16.2.4.3. SWOT Analysis
- 16.2.4.4. Recent Developments
- 16.2.4.5. Financials (Based on Availability)
- 16.2.5 Weefsel Pharma
- 16.2.5.1. Overview
- 16.2.5.2. Products
- 16.2.5.3. SWOT Analysis
- 16.2.5.4. Recent Developments
- 16.2.5.5. Financials (Based on Availability)
- 16.2.6 Parenteral Drugs (India) Limited
- 16.2.6.1. Overview
- 16.2.6.2. Products
- 16.2.6.3. SWOT Analysis
- 16.2.6.4. Recent Developments
- 16.2.6.5. Financials (Based on Availability)
- 16.2.7 Teva Pharmaceutical Industries Ltd
- 16.2.7.1. Overview
- 16.2.7.2. Products
- 16.2.7.3. SWOT Analysis
- 16.2.7.4. Recent Developments
- 16.2.7.5. Financials (Based on Availability)
- 16.2.8 Eisai Co Ltd
- 16.2.8.1. Overview
- 16.2.8.2. Products
- 16.2.8.3. SWOT Analysis
- 16.2.8.4. Recent Developments
- 16.2.8.5. Financials (Based on Availability)
- 16.2.9 Bristol-Myers Squibb Company
- 16.2.9.1. Overview
- 16.2.9.2. Products
- 16.2.9.3. SWOT Analysis
- 16.2.9.4. Recent Developments
- 16.2.9.5. Financials (Based on Availability)
- 16.2.10 Pfizer Inc
- 16.2.10.1. Overview
- 16.2.10.2. Products
- 16.2.10.3. SWOT Analysis
- 16.2.10.4. Recent Developments
- 16.2.10.5. Financials (Based on Availability)
- 16.2.1 Sanofi SA
List of Figures
- Figure 1: Global Infused Drugs Market Revenue Breakdown (Million, %) by Region 2024 & 2032
- Figure 2: Global Infused Drugs Market Volume Breakdown (K Unit, %) by Region 2024 & 2032
- Figure 3: North America Infused Drugs Market Revenue (Million), by Country 2024 & 2032
- Figure 4: North America Infused Drugs Market Volume (K Unit), by Country 2024 & 2032
- Figure 5: North America Infused Drugs Market Revenue Share (%), by Country 2024 & 2032
- Figure 6: North America Infused Drugs Market Volume Share (%), by Country 2024 & 2032
- Figure 7: Europe Infused Drugs Market Revenue (Million), by Country 2024 & 2032
- Figure 8: Europe Infused Drugs Market Volume (K Unit), by Country 2024 & 2032
- Figure 9: Europe Infused Drugs Market Revenue Share (%), by Country 2024 & 2032
- Figure 10: Europe Infused Drugs Market Volume Share (%), by Country 2024 & 2032
- Figure 11: Asia Pacific Infused Drugs Market Revenue (Million), by Country 2024 & 2032
- Figure 12: Asia Pacific Infused Drugs Market Volume (K Unit), by Country 2024 & 2032
- Figure 13: Asia Pacific Infused Drugs Market Revenue Share (%), by Country 2024 & 2032
- Figure 14: Asia Pacific Infused Drugs Market Volume Share (%), by Country 2024 & 2032
- Figure 15: Middle East and Africa Infused Drugs Market Revenue (Million), by Country 2024 & 2032
- Figure 16: Middle East and Africa Infused Drugs Market Volume (K Unit), by Country 2024 & 2032
- Figure 17: Middle East and Africa Infused Drugs Market Revenue Share (%), by Country 2024 & 2032
- Figure 18: Middle East and Africa Infused Drugs Market Volume Share (%), by Country 2024 & 2032
- Figure 19: South America Infused Drugs Market Revenue (Million), by Country 2024 & 2032
- Figure 20: South America Infused Drugs Market Volume (K Unit), by Country 2024 & 2032
- Figure 21: South America Infused Drugs Market Revenue Share (%), by Country 2024 & 2032
- Figure 22: South America Infused Drugs Market Volume Share (%), by Country 2024 & 2032
- Figure 23: North America Infused Drugs Market Revenue (Million), by Drug Type 2024 & 2032
- Figure 24: North America Infused Drugs Market Volume (K Unit), by Drug Type 2024 & 2032
- Figure 25: North America Infused Drugs Market Revenue Share (%), by Drug Type 2024 & 2032
- Figure 26: North America Infused Drugs Market Volume Share (%), by Drug Type 2024 & 2032
- Figure 27: North America Infused Drugs Market Revenue (Million), by Therapeutic Area 2024 & 2032
- Figure 28: North America Infused Drugs Market Volume (K Unit), by Therapeutic Area 2024 & 2032
- Figure 29: North America Infused Drugs Market Revenue Share (%), by Therapeutic Area 2024 & 2032
- Figure 30: North America Infused Drugs Market Volume Share (%), by Therapeutic Area 2024 & 2032
- Figure 31: North America Infused Drugs Market Revenue (Million), by Country 2024 & 2032
- Figure 32: North America Infused Drugs Market Volume (K Unit), by Country 2024 & 2032
- Figure 33: North America Infused Drugs Market Revenue Share (%), by Country 2024 & 2032
- Figure 34: North America Infused Drugs Market Volume Share (%), by Country 2024 & 2032
- Figure 35: Europe Infused Drugs Market Revenue (Million), by Drug Type 2024 & 2032
- Figure 36: Europe Infused Drugs Market Volume (K Unit), by Drug Type 2024 & 2032
- Figure 37: Europe Infused Drugs Market Revenue Share (%), by Drug Type 2024 & 2032
- Figure 38: Europe Infused Drugs Market Volume Share (%), by Drug Type 2024 & 2032
- Figure 39: Europe Infused Drugs Market Revenue (Million), by Therapeutic Area 2024 & 2032
- Figure 40: Europe Infused Drugs Market Volume (K Unit), by Therapeutic Area 2024 & 2032
- Figure 41: Europe Infused Drugs Market Revenue Share (%), by Therapeutic Area 2024 & 2032
- Figure 42: Europe Infused Drugs Market Volume Share (%), by Therapeutic Area 2024 & 2032
- Figure 43: Europe Infused Drugs Market Revenue (Million), by Country 2024 & 2032
- Figure 44: Europe Infused Drugs Market Volume (K Unit), by Country 2024 & 2032
- Figure 45: Europe Infused Drugs Market Revenue Share (%), by Country 2024 & 2032
- Figure 46: Europe Infused Drugs Market Volume Share (%), by Country 2024 & 2032
- Figure 47: Asia Pacific Infused Drugs Market Revenue (Million), by Drug Type 2024 & 2032
- Figure 48: Asia Pacific Infused Drugs Market Volume (K Unit), by Drug Type 2024 & 2032
- Figure 49: Asia Pacific Infused Drugs Market Revenue Share (%), by Drug Type 2024 & 2032
- Figure 50: Asia Pacific Infused Drugs Market Volume Share (%), by Drug Type 2024 & 2032
- Figure 51: Asia Pacific Infused Drugs Market Revenue (Million), by Therapeutic Area 2024 & 2032
- Figure 52: Asia Pacific Infused Drugs Market Volume (K Unit), by Therapeutic Area 2024 & 2032
- Figure 53: Asia Pacific Infused Drugs Market Revenue Share (%), by Therapeutic Area 2024 & 2032
- Figure 54: Asia Pacific Infused Drugs Market Volume Share (%), by Therapeutic Area 2024 & 2032
- Figure 55: Asia Pacific Infused Drugs Market Revenue (Million), by Country 2024 & 2032
- Figure 56: Asia Pacific Infused Drugs Market Volume (K Unit), by Country 2024 & 2032
- Figure 57: Asia Pacific Infused Drugs Market Revenue Share (%), by Country 2024 & 2032
- Figure 58: Asia Pacific Infused Drugs Market Volume Share (%), by Country 2024 & 2032
- Figure 59: Middle East and Africa Infused Drugs Market Revenue (Million), by Drug Type 2024 & 2032
- Figure 60: Middle East and Africa Infused Drugs Market Volume (K Unit), by Drug Type 2024 & 2032
- Figure 61: Middle East and Africa Infused Drugs Market Revenue Share (%), by Drug Type 2024 & 2032
- Figure 62: Middle East and Africa Infused Drugs Market Volume Share (%), by Drug Type 2024 & 2032
- Figure 63: Middle East and Africa Infused Drugs Market Revenue (Million), by Therapeutic Area 2024 & 2032
- Figure 64: Middle East and Africa Infused Drugs Market Volume (K Unit), by Therapeutic Area 2024 & 2032
- Figure 65: Middle East and Africa Infused Drugs Market Revenue Share (%), by Therapeutic Area 2024 & 2032
- Figure 66: Middle East and Africa Infused Drugs Market Volume Share (%), by Therapeutic Area 2024 & 2032
- Figure 67: Middle East and Africa Infused Drugs Market Revenue (Million), by Country 2024 & 2032
- Figure 68: Middle East and Africa Infused Drugs Market Volume (K Unit), by Country 2024 & 2032
- Figure 69: Middle East and Africa Infused Drugs Market Revenue Share (%), by Country 2024 & 2032
- Figure 70: Middle East and Africa Infused Drugs Market Volume Share (%), by Country 2024 & 2032
- Figure 71: South America Infused Drugs Market Revenue (Million), by Drug Type 2024 & 2032
- Figure 72: South America Infused Drugs Market Volume (K Unit), by Drug Type 2024 & 2032
- Figure 73: South America Infused Drugs Market Revenue Share (%), by Drug Type 2024 & 2032
- Figure 74: South America Infused Drugs Market Volume Share (%), by Drug Type 2024 & 2032
- Figure 75: South America Infused Drugs Market Revenue (Million), by Therapeutic Area 2024 & 2032
- Figure 76: South America Infused Drugs Market Volume (K Unit), by Therapeutic Area 2024 & 2032
- Figure 77: South America Infused Drugs Market Revenue Share (%), by Therapeutic Area 2024 & 2032
- Figure 78: South America Infused Drugs Market Volume Share (%), by Therapeutic Area 2024 & 2032
- Figure 79: South America Infused Drugs Market Revenue (Million), by Country 2024 & 2032
- Figure 80: South America Infused Drugs Market Volume (K Unit), by Country 2024 & 2032
- Figure 81: South America Infused Drugs Market Revenue Share (%), by Country 2024 & 2032
- Figure 82: South America Infused Drugs Market Volume Share (%), by Country 2024 & 2032
List of Tables
- Table 1: Global Infused Drugs Market Revenue Million Forecast, by Region 2019 & 2032
- Table 2: Global Infused Drugs Market Volume K Unit Forecast, by Region 2019 & 2032
- Table 3: Global Infused Drugs Market Revenue Million Forecast, by Drug Type 2019 & 2032
- Table 4: Global Infused Drugs Market Volume K Unit Forecast, by Drug Type 2019 & 2032
- Table 5: Global Infused Drugs Market Revenue Million Forecast, by Therapeutic Area 2019 & 2032
- Table 6: Global Infused Drugs Market Volume K Unit Forecast, by Therapeutic Area 2019 & 2032
- Table 7: Global Infused Drugs Market Revenue Million Forecast, by Region 2019 & 2032
- Table 8: Global Infused Drugs Market Volume K Unit Forecast, by Region 2019 & 2032
- Table 9: Global Infused Drugs Market Revenue Million Forecast, by Country 2019 & 2032
- Table 10: Global Infused Drugs Market Volume K Unit Forecast, by Country 2019 & 2032
- Table 11: Global Infused Drugs Market Revenue Million Forecast, by Country 2019 & 2032
- Table 12: Global Infused Drugs Market Volume K Unit Forecast, by Country 2019 & 2032
- Table 13: Global Infused Drugs Market Revenue Million Forecast, by Country 2019 & 2032
- Table 14: Global Infused Drugs Market Volume K Unit Forecast, by Country 2019 & 2032
- Table 15: Global Infused Drugs Market Revenue Million Forecast, by Country 2019 & 2032
- Table 16: Global Infused Drugs Market Volume K Unit Forecast, by Country 2019 & 2032
- Table 17: Global Infused Drugs Market Revenue Million Forecast, by Country 2019 & 2032
- Table 18: Global Infused Drugs Market Volume K Unit Forecast, by Country 2019 & 2032
- Table 19: Global Infused Drugs Market Revenue Million Forecast, by Drug Type 2019 & 2032
- Table 20: Global Infused Drugs Market Volume K Unit Forecast, by Drug Type 2019 & 2032
- Table 21: Global Infused Drugs Market Revenue Million Forecast, by Therapeutic Area 2019 & 2032
- Table 22: Global Infused Drugs Market Volume K Unit Forecast, by Therapeutic Area 2019 & 2032
- Table 23: Global Infused Drugs Market Revenue Million Forecast, by Country 2019 & 2032
- Table 24: Global Infused Drugs Market Volume K Unit Forecast, by Country 2019 & 2032
- Table 25: United States Infused Drugs Market Revenue (Million) Forecast, by Application 2019 & 2032
- Table 26: United States Infused Drugs Market Volume (K Unit) Forecast, by Application 2019 & 2032
- Table 27: Canada Infused Drugs Market Revenue (Million) Forecast, by Application 2019 & 2032
- Table 28: Canada Infused Drugs Market Volume (K Unit) Forecast, by Application 2019 & 2032
- Table 29: Mexico Infused Drugs Market Revenue (Million) Forecast, by Application 2019 & 2032
- Table 30: Mexico Infused Drugs Market Volume (K Unit) Forecast, by Application 2019 & 2032
- Table 31: Global Infused Drugs Market Revenue Million Forecast, by Drug Type 2019 & 2032
- Table 32: Global Infused Drugs Market Volume K Unit Forecast, by Drug Type 2019 & 2032
- Table 33: Global Infused Drugs Market Revenue Million Forecast, by Therapeutic Area 2019 & 2032
- Table 34: Global Infused Drugs Market Volume K Unit Forecast, by Therapeutic Area 2019 & 2032
- Table 35: Global Infused Drugs Market Revenue Million Forecast, by Country 2019 & 2032
- Table 36: Global Infused Drugs Market Volume K Unit Forecast, by Country 2019 & 2032
- Table 37: Germany Infused Drugs Market Revenue (Million) Forecast, by Application 2019 & 2032
- Table 38: Germany Infused Drugs Market Volume (K Unit) Forecast, by Application 2019 & 2032
- Table 39: United Kingdom Infused Drugs Market Revenue (Million) Forecast, by Application 2019 & 2032
- Table 40: United Kingdom Infused Drugs Market Volume (K Unit) Forecast, by Application 2019 & 2032
- Table 41: France Infused Drugs Market Revenue (Million) Forecast, by Application 2019 & 2032
- Table 42: France Infused Drugs Market Volume (K Unit) Forecast, by Application 2019 & 2032
- Table 43: Italy Infused Drugs Market Revenue (Million) Forecast, by Application 2019 & 2032
- Table 44: Italy Infused Drugs Market Volume (K Unit) Forecast, by Application 2019 & 2032
- Table 45: Spain Infused Drugs Market Revenue (Million) Forecast, by Application 2019 & 2032
- Table 46: Spain Infused Drugs Market Volume (K Unit) Forecast, by Application 2019 & 2032
- Table 47: Rest of Europe Infused Drugs Market Revenue (Million) Forecast, by Application 2019 & 2032
- Table 48: Rest of Europe Infused Drugs Market Volume (K Unit) Forecast, by Application 2019 & 2032
- Table 49: Global Infused Drugs Market Revenue Million Forecast, by Drug Type 2019 & 2032
- Table 50: Global Infused Drugs Market Volume K Unit Forecast, by Drug Type 2019 & 2032
- Table 51: Global Infused Drugs Market Revenue Million Forecast, by Therapeutic Area 2019 & 2032
- Table 52: Global Infused Drugs Market Volume K Unit Forecast, by Therapeutic Area 2019 & 2032
- Table 53: Global Infused Drugs Market Revenue Million Forecast, by Country 2019 & 2032
- Table 54: Global Infused Drugs Market Volume K Unit Forecast, by Country 2019 & 2032
- Table 55: China Infused Drugs Market Revenue (Million) Forecast, by Application 2019 & 2032
- Table 56: China Infused Drugs Market Volume (K Unit) Forecast, by Application 2019 & 2032
- Table 57: Japan Infused Drugs Market Revenue (Million) Forecast, by Application 2019 & 2032
- Table 58: Japan Infused Drugs Market Volume (K Unit) Forecast, by Application 2019 & 2032
- Table 59: India Infused Drugs Market Revenue (Million) Forecast, by Application 2019 & 2032
- Table 60: India Infused Drugs Market Volume (K Unit) Forecast, by Application 2019 & 2032
- Table 61: Australia Infused Drugs Market Revenue (Million) Forecast, by Application 2019 & 2032
- Table 62: Australia Infused Drugs Market Volume (K Unit) Forecast, by Application 2019 & 2032
- Table 63: South Korea Infused Drugs Market Revenue (Million) Forecast, by Application 2019 & 2032
- Table 64: South Korea Infused Drugs Market Volume (K Unit) Forecast, by Application 2019 & 2032
- Table 65: Rest of Asia Pacific Infused Drugs Market Revenue (Million) Forecast, by Application 2019 & 2032
- Table 66: Rest of Asia Pacific Infused Drugs Market Volume (K Unit) Forecast, by Application 2019 & 2032
- Table 67: Global Infused Drugs Market Revenue Million Forecast, by Drug Type 2019 & 2032
- Table 68: Global Infused Drugs Market Volume K Unit Forecast, by Drug Type 2019 & 2032
- Table 69: Global Infused Drugs Market Revenue Million Forecast, by Therapeutic Area 2019 & 2032
- Table 70: Global Infused Drugs Market Volume K Unit Forecast, by Therapeutic Area 2019 & 2032
- Table 71: Global Infused Drugs Market Revenue Million Forecast, by Country 2019 & 2032
- Table 72: Global Infused Drugs Market Volume K Unit Forecast, by Country 2019 & 2032
- Table 73: GCC Infused Drugs Market Revenue (Million) Forecast, by Application 2019 & 2032
- Table 74: GCC Infused Drugs Market Volume (K Unit) Forecast, by Application 2019 & 2032
- Table 75: South Africa Infused Drugs Market Revenue (Million) Forecast, by Application 2019 & 2032
- Table 76: South Africa Infused Drugs Market Volume (K Unit) Forecast, by Application 2019 & 2032
- Table 77: Rest of Middle East and Africa Infused Drugs Market Revenue (Million) Forecast, by Application 2019 & 2032
- Table 78: Rest of Middle East and Africa Infused Drugs Market Volume (K Unit) Forecast, by Application 2019 & 2032
- Table 79: Global Infused Drugs Market Revenue Million Forecast, by Drug Type 2019 & 2032
- Table 80: Global Infused Drugs Market Volume K Unit Forecast, by Drug Type 2019 & 2032
- Table 81: Global Infused Drugs Market Revenue Million Forecast, by Therapeutic Area 2019 & 2032
- Table 82: Global Infused Drugs Market Volume K Unit Forecast, by Therapeutic Area 2019 & 2032
- Table 83: Global Infused Drugs Market Revenue Million Forecast, by Country 2019 & 2032
- Table 84: Global Infused Drugs Market Volume K Unit Forecast, by Country 2019 & 2032
- Table 85: Brazil Infused Drugs Market Revenue (Million) Forecast, by Application 2019 & 2032
- Table 86: Brazil Infused Drugs Market Volume (K Unit) Forecast, by Application 2019 & 2032
- Table 87: Argentina Infused Drugs Market Revenue (Million) Forecast, by Application 2019 & 2032
- Table 88: Argentina Infused Drugs Market Volume (K Unit) Forecast, by Application 2019 & 2032
- Table 89: Rest of South America Infused Drugs Market Revenue (Million) Forecast, by Application 2019 & 2032
- Table 90: Rest of South America Infused Drugs Market Volume (K Unit) Forecast, by Application 2019 & 2032
Frequently Asked Questions
1. What is the projected Compound Annual Growth Rate (CAGR) of the Infused Drugs Market?
The projected CAGR is approximately 7.30%.
2. Which companies are prominent players in the Infused Drugs Market?
Key companies in the market include Sanofi SA, Regeneron Pharmaceuticals Inc, Amgen Inc, AstraZeneca, Weefsel Pharma, Parenteral Drugs (India) Limited, Teva Pharmaceutical Industries Ltd, Eisai Co Ltd, Bristol-Myers Squibb Company, Pfizer Inc.
3. What are the main segments of the Infused Drugs Market?
The market segments include Drug Type, Therapeutic Area.
4. Can you provide details about the market size?
The market size is estimated to be USD 8.5 Million as of 2022.
5. What are some drivers contributing to market growth?
Increase in the Prevalence of Chronic Diseases; Increasing Geriatric Population.
6. What are the notable trends driving market growth?
Oncology is Expected to Have Significant Market Share During the Forecast Period.
7. Are there any restraints impacting market growth?
Side Effects Associated with the Medications.
8. Can you provide examples of recent developments in the market?
September 2023: Eisai Co. Ltd and Biogen Inc. reported the approval of LEQEMBI intravenous infusion, a humanized anti-soluble aggregated amyloid beta monoclonal antibody in Japan. This approval signifies its recognition as a treatment to decelerate the progression of mild cognitive impairment and dementia resulting from Alzheimer’s Disease.
9. What pricing options are available for accessing the report?
Pricing options include single-user, multi-user, and enterprise licenses priced at USD 4750, USD 5250, and USD 8750 respectively.
10. Is the market size provided in terms of value or volume?
The market size is provided in terms of value, measured in Million and volume, measured in K Unit.
11. Are there any specific market keywords associated with the report?
Yes, the market keyword associated with the report is "Infused Drugs Market," which aids in identifying and referencing the specific market segment covered.
12. How do I determine which pricing option suits my needs best?
The pricing options vary based on user requirements and access needs. Individual users may opt for single-user licenses, while businesses requiring broader access may choose multi-user or enterprise licenses for cost-effective access to the report.
13. Are there any additional resources or data provided in the Infused Drugs Market report?
While the report offers comprehensive insights, it's advisable to review the specific contents or supplementary materials provided to ascertain if additional resources or data are available.
14. How can I stay updated on further developments or reports in the Infused Drugs Market?
To stay informed about further developments, trends, and reports in the Infused Drugs Market, consider subscribing to industry newsletters, following relevant companies and organizations, or regularly checking reputable industry news sources and publications.
Methodology
Step 1 - Identification of Relevant Samples Size from Population Database


Step 2 - Approaches for Defining Global Market Size (Value, Volume* & Price*)

Note*: In applicable scenarios
Step 3 - Data Sources
Primary Research
- Web Analytics
- Survey Reports
- Research Institute
- Latest Research Reports
- Opinion Leaders
Secondary Research
- Annual Reports
- White Paper
- Latest Press Release
- Industry Association
- Paid Database
- Investor Presentations

Step 4 - Data Triangulation
Involves using different sources of information in order to increase the validity of a study
These sources are likely to be stakeholders in a program - participants, other researchers, program staff, other community members, and so on.
Then we put all data in single framework & apply various statistical tools to find out the dynamic on the market.
During the analysis stage, feedback from the stakeholder groups would be compared to determine areas of agreement as well as areas of divergence
