

Key Insights
The global incubator devices market is experiencing robust growth, projected to reach a substantial size driven by several key factors. The increasing prevalence of premature births and low birth weight infants necessitates advanced neonatal care, fueling demand for neonatal incubators. Technological advancements leading to improved functionalities such as temperature control, humidity monitoring, and integrated monitoring systems are also contributing significantly to market expansion. Furthermore, the rising number of hospitals and birthing centers, coupled with increasing investments in healthcare infrastructure in developing economies, are creating lucrative opportunities for market players. The market is segmented by product type (neonatal incubators, double-walled incubators, microbiological incubators, and others) and end-user (hospitals and birthing centers, diagnostic labs, and others). Neonatal incubators dominate the product segment due to their critical role in neonatal intensive care. Hospitals and birthing centers represent the largest end-user segment, owing to the high concentration of premature and low birth weight infants requiring specialized care within these facilities. Geographical expansion into emerging markets with increasing healthcare spending is another crucial driver for growth. While regulatory hurdles and high initial investment costs can pose challenges, the overall market outlook remains positive, driven by an unrelenting demand for advanced incubator technologies and improved patient care.
Competition in the incubator devices market is intense, with established players like GE Healthcare and Thermo Fisher Scientific alongside regional and specialized manufacturers. Key strategic initiatives include product innovation, collaborations and partnerships, and geographical expansion to capture market share. Manufacturers are focusing on developing smart incubators with integrated data management and remote monitoring capabilities to enhance efficiency and improve patient outcomes. The market's growth trajectory is expected to be influenced by factors like technological advancements, healthcare infrastructure development, and evolving regulatory landscapes. Understanding these dynamics is crucial for manufacturers to effectively strategize and maintain a competitive edge in this ever-evolving market. The forecast period suggests continuous, albeit potentially moderated, growth, reflecting a sustained need for advanced incubator technologies across diverse healthcare settings globally. Maintaining a strong focus on research and development and catering to specific regional needs will be crucial for continued success within this segment.
Incubator Devices Industry: A Comprehensive Market Report (2019-2033)
This comprehensive report provides a detailed analysis of the Incubator Devices industry, offering valuable insights for stakeholders, investors, and industry professionals. Covering the period from 2019 to 2033, with a focus on 2025, this report examines market dynamics, trends, leading players, and future opportunities within the $XX Million market.
Incubator Devices Industry Market Dynamics & Concentration
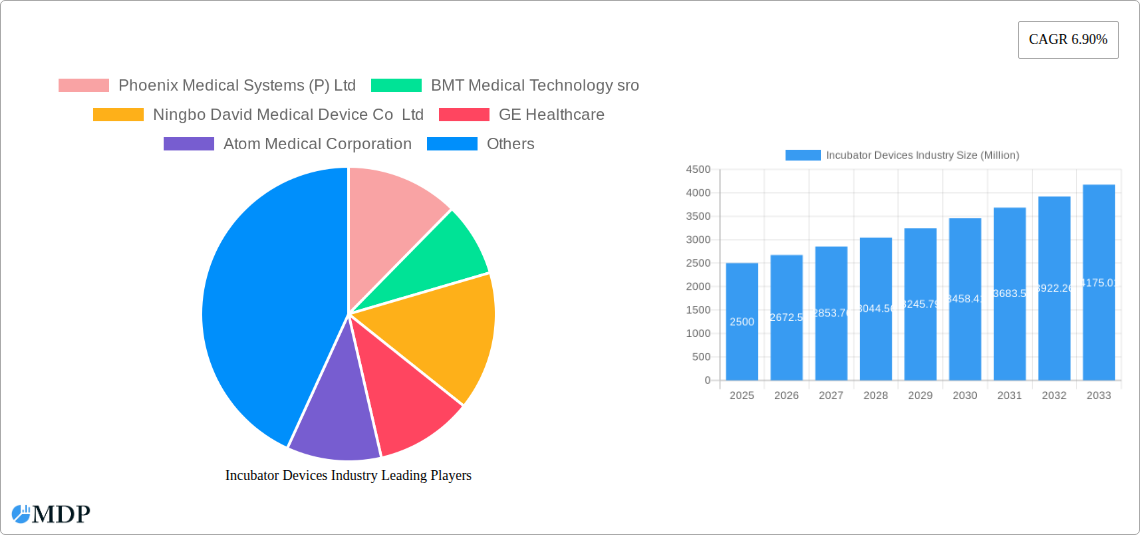
The global incubator devices market, valued at $XX Million in 2024, is characterized by a moderately concentrated landscape. Key players such as GE Healthcare, Thermo Fisher Scientific Inc, and Dragerwerk AG & Co KGaA hold significant market share, while several regional and specialized companies contribute to the overall market volume. The market share of the top 5 players is estimated at xx%.
Market Concentration Factors:
- High barriers to entry due to stringent regulatory requirements and significant R&D investments.
- Consolidation through mergers and acquisitions (M&A) activity, with an estimated xx M&A deals in the last 5 years.
- Increasing demand for technologically advanced incubators, driving innovation and competition.
- The presence of both large multinational corporations and smaller, specialized companies catering to niche segments.
Innovation Drivers:
- Advancements in temperature control, humidity regulation, and gas mixing technologies.
- Integration of monitoring systems for real-time data analysis and remote patient management.
- Development of portable and user-friendly devices for diverse applications.
Regulatory Frameworks:
- Stringent regulatory approvals (e.g., FDA, CE marking) impact product development timelines and market entry.
- Variations in regulatory landscapes across different regions create complexities for international players.
Product Substitutes:
- Limited direct substitutes exist, but alternative technologies and approaches (e.g., specialized warming systems) may impact market growth.
End-User Trends:
- Increasing adoption in hospitals and birthing centers due to rising birth rates and improved healthcare infrastructure.
- Growing demand from diagnostic labs for microbiological incubators, driven by advancements in medical research and diagnostics.
Incubator Devices Industry Industry Trends & Analysis
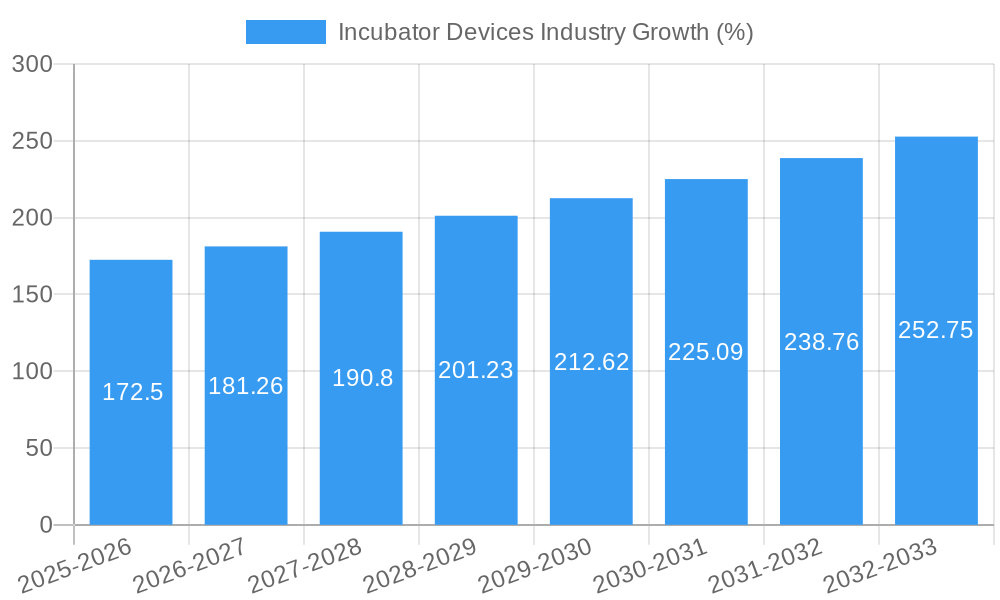
The incubator devices market is projected to experience a Compound Annual Growth Rate (CAGR) of xx% during the forecast period (2025-2033). This growth is primarily driven by several key factors: rising healthcare expenditure globally, technological advancements, increasing prevalence of premature births, and the growing demand for sophisticated medical equipment in developing economies. Market penetration rates are highest in developed nations, while significant growth potential exists in emerging markets.
Technological disruptions, particularly the integration of smart technologies and connectivity, are reshaping the industry. Consumer preferences are shifting towards user-friendly, energy-efficient, and technologically advanced incubators with improved safety features. Competitive dynamics are intense, with companies focusing on product differentiation, strategic partnerships, and geographic expansion to maintain market share.
Leading Markets & Segments in Incubator Devices Industry
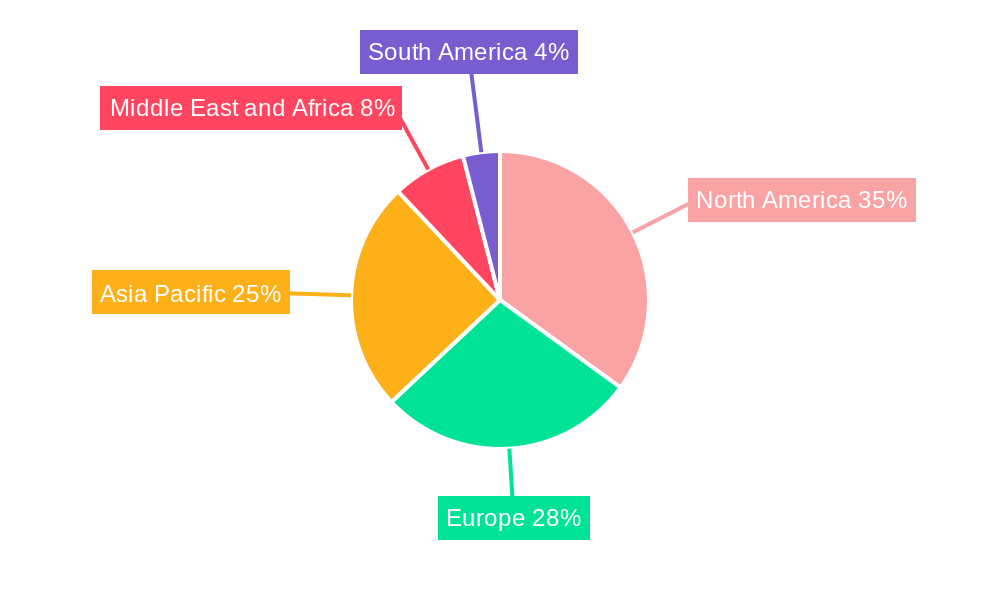
The North American region currently dominates the incubator devices market, driven by high healthcare spending, a robust healthcare infrastructure, and the presence of key players. Within product types, Neonatal Incubators comprise the largest segment, followed by Microbiological Incubators. Hospitals and Birthing Centers constitute the primary end-user segment, reflecting the critical role of incubators in neonatal care.
Key Drivers by Segment:
- Neonatal Incubators: High birth rates, increasing preterm births, and the need for advanced neonatal care.
- Microbiological Incubators: Growing demand for advanced diagnostic testing, research, and quality control in various industries.
- Hospitals and Birthing Centers: Expansion of healthcare facilities, improved healthcare infrastructure, and rising healthcare expenditure.
- Diagnostic Labs: Growing focus on infectious disease diagnosis, medical research, and advancements in microbiology.
Dominance Analysis: North America's dominance stems from a combination of high healthcare spending, strong regulatory frameworks supporting innovation, and a large pool of established players. However, emerging markets in Asia-Pacific and Latin America present significant growth opportunities due to rising healthcare investments and increasing demand for advanced medical technology.
Incubator Devices Industry Product Developments
Recent product innovations focus on improving temperature control precision, enhancing safety features, and integrating smart technologies for remote monitoring and data analysis. New incubators are smaller, more energy-efficient, and incorporate user-friendly interfaces. The integration of advanced sensors and connectivity enables real-time monitoring and data analysis, improving the efficiency and efficacy of incubator use. This directly improves patient outcomes and streamlines workflows within healthcare settings.
Key Drivers of Incubator Devices Industry Growth
Several factors fuel the growth of the incubator devices market:
- Technological advancements leading to improved functionality, energy efficiency, and safety features.
- Rising healthcare expenditure globally, increasing access to advanced medical technology.
- Favorable regulatory policies encouraging the adoption of innovative medical devices.
- Increased awareness of the importance of neonatal care and infectious disease control.
Challenges in the Incubator Devices Industry Market
The industry faces several challenges:
- Stringent regulatory approvals and compliance requirements increase costs and development time.
- Supply chain disruptions and material cost fluctuations can impact profitability.
- Intense competition from established players and new entrants pressures profit margins.
- The $XX Million market is sensitive to economic downturns, which can decrease spending on healthcare equipment.
Emerging Opportunities in Incubator Devices Industry
The market presents several significant growth opportunities:
- Development of portable and wireless incubators, expanding accessibility in remote areas.
- Integration of artificial intelligence (AI) and machine learning (ML) for predictive maintenance and remote monitoring.
- Strategic partnerships and collaborations to expand market reach and access new technologies.
- Expansion into emerging markets with significant unmet needs.
Leading Players in the Incubator Devices Industry Sector
- GE Healthcare
- Thermo Fisher Scientific Inc
- Dragerwerk AG & Co KGaA
- Phoenix Medical Systems (P) Ltd
- BMT Medical Technology sro
- Ningbo David Medical Device Co Ltd
- Atom Medical Corporation
- Andreas Hettich GmbH & Co KG
- Zhengzhou Dison Instrument and Meter Co Ltd
- Medhold Medical (PTY) Ltd
- Archimed (Natus Medical Incorporated)
- PHC Corporation
Key Milestones in Incubator Devices Industry Industry
- May 2022: Cook Medical launched the MINC+ benchtop incubator for IVF clinics, representing a significant advancement in assisted reproductive technology.
- October 2022: The launch of Unit-9, a medical technology incubator in Birmingham, UK, signifies increased investment in medical device innovation and development.
Strategic Outlook for Incubator Devices Industry Market
The incubator devices market holds significant long-term growth potential, driven by ongoing technological advancements, expanding healthcare infrastructure, and rising demand in emerging markets. Companies can leverage strategic partnerships, invest in R&D, and focus on product differentiation to capitalize on market opportunities. Expanding into new geographical regions and targeting underserved populations presents further opportunities for market expansion and substantial revenue growth in the coming years.
Incubator Devices Industry Segmentation
-
1. Product Type
-
1.1. Neonatal Incubators
- 1.1.1. Portable or Transport Incubator
- 1.1.2. Open Box Incubator
- 1.1.3. Close Box Incubator
- 1.1.4. Double Walled Incubator
- 1.2. Microbiological Incubators
- 1.3. Other Product Types
-
1.1. Neonatal Incubators
-
2. End User
- 2.1. Hospitals and Birthing Centers
- 2.2. Diagnostic Labs
- 2.3. Other End Users
Incubator Devices Industry Segmentation By Geography
-
1. North America
- 1.1. United States
- 1.2. Canada
- 1.3. Mexico
-
2. Europe
- 2.1. Germany
- 2.2. United Kingdom
- 2.3. France
- 2.4. Italy
- 2.5. Spain
- 2.6. Rest of Europe
-
3. Asia Pacific
- 3.1. China
- 3.2. Japan
- 3.3. India
- 3.4. Australia
- 3.5. South Korea
- 3.6. Rest of Asia Pacific
-
4. Middle East and Africa
- 4.1. GCC
- 4.2. South Africa
- 4.3. Rest of Middle East and Africa
-
5. South America
- 5.1. Brazil
- 5.2. Argentina
- 5.3. Rest of South America
Incubator Devices Industry REPORT HIGHLIGHTS
| Aspects | Details |
|---|---|
| Study Period | 2019-2033 |
| Base Year | 2024 |
| Estimated Year | 2025 |
| Forecast Period | 2025-2033 |
| Historical Period | 2019-2024 |
| Growth Rate | CAGR of 6.90% from 2019-2033 |
| Segmentation |
|
Table of Contents
- 1. Introduction
- 1.1. Research Scope
- 1.2. Market Segmentation
- 1.3. Research Methodology
- 1.4. Definitions and Assumptions
- 2. Executive Summary
- 2.1. Introduction
- 3. Market Dynamics
- 3.1. Introduction
- 3.2. Market Drivers
- 3.2.1. Rising Prevalence of Premature Babies; Low Birth Weight of Babies; Growing R&D in Healthcare
- 3.3. Market Restrains
- 3.3.1. High Cost of Incubators; Lack of Awareness in Emerging Economies
- 3.4. Market Trends
- 3.4.1. The Hospitals and Birthing Centers Segment is Expected to Witness a Healthy Growth Over the Forecast Period
- 4. Market Factor Analysis
- 4.1. Porters Five Forces
- 4.2. Supply/Value Chain
- 4.3. PESTEL analysis
- 4.4. Market Entropy
- 4.5. Patent/Trademark Analysis
- 5. Global Incubator Devices Industry Analysis, Insights and Forecast, 2019-2031
- 5.1. Market Analysis, Insights and Forecast - by Product Type
- 5.1.1. Neonatal Incubators
- 5.1.1.1. Portable or Transport Incubator
- 5.1.1.2. Open Box Incubator
- 5.1.1.3. Close Box Incubator
- 5.1.1.4. Double Walled Incubator
- 5.1.2. Microbiological Incubators
- 5.1.3. Other Product Types
- 5.1.1. Neonatal Incubators
- 5.2. Market Analysis, Insights and Forecast - by End User
- 5.2.1. Hospitals and Birthing Centers
- 5.2.2. Diagnostic Labs
- 5.2.3. Other End Users
- 5.3. Market Analysis, Insights and Forecast - by Region
- 5.3.1. North America
- 5.3.2. Europe
- 5.3.3. Asia Pacific
- 5.3.4. Middle East and Africa
- 5.3.5. South America
- 5.1. Market Analysis, Insights and Forecast - by Product Type
- 6. North America Incubator Devices Industry Analysis, Insights and Forecast, 2019-2031
- 6.1. Market Analysis, Insights and Forecast - by Product Type
- 6.1.1. Neonatal Incubators
- 6.1.1.1. Portable or Transport Incubator
- 6.1.1.2. Open Box Incubator
- 6.1.1.3. Close Box Incubator
- 6.1.1.4. Double Walled Incubator
- 6.1.2. Microbiological Incubators
- 6.1.3. Other Product Types
- 6.1.1. Neonatal Incubators
- 6.2. Market Analysis, Insights and Forecast - by End User
- 6.2.1. Hospitals and Birthing Centers
- 6.2.2. Diagnostic Labs
- 6.2.3. Other End Users
- 6.1. Market Analysis, Insights and Forecast - by Product Type
- 7. Europe Incubator Devices Industry Analysis, Insights and Forecast, 2019-2031
- 7.1. Market Analysis, Insights and Forecast - by Product Type
- 7.1.1. Neonatal Incubators
- 7.1.1.1. Portable or Transport Incubator
- 7.1.1.2. Open Box Incubator
- 7.1.1.3. Close Box Incubator
- 7.1.1.4. Double Walled Incubator
- 7.1.2. Microbiological Incubators
- 7.1.3. Other Product Types
- 7.1.1. Neonatal Incubators
- 7.2. Market Analysis, Insights and Forecast - by End User
- 7.2.1. Hospitals and Birthing Centers
- 7.2.2. Diagnostic Labs
- 7.2.3. Other End Users
- 7.1. Market Analysis, Insights and Forecast - by Product Type
- 8. Asia Pacific Incubator Devices Industry Analysis, Insights and Forecast, 2019-2031
- 8.1. Market Analysis, Insights and Forecast - by Product Type
- 8.1.1. Neonatal Incubators
- 8.1.1.1. Portable or Transport Incubator
- 8.1.1.2. Open Box Incubator
- 8.1.1.3. Close Box Incubator
- 8.1.1.4. Double Walled Incubator
- 8.1.2. Microbiological Incubators
- 8.1.3. Other Product Types
- 8.1.1. Neonatal Incubators
- 8.2. Market Analysis, Insights and Forecast - by End User
- 8.2.1. Hospitals and Birthing Centers
- 8.2.2. Diagnostic Labs
- 8.2.3. Other End Users
- 8.1. Market Analysis, Insights and Forecast - by Product Type
- 9. Middle East and Africa Incubator Devices Industry Analysis, Insights and Forecast, 2019-2031
- 9.1. Market Analysis, Insights and Forecast - by Product Type
- 9.1.1. Neonatal Incubators
- 9.1.1.1. Portable or Transport Incubator
- 9.1.1.2. Open Box Incubator
- 9.1.1.3. Close Box Incubator
- 9.1.1.4. Double Walled Incubator
- 9.1.2. Microbiological Incubators
- 9.1.3. Other Product Types
- 9.1.1. Neonatal Incubators
- 9.2. Market Analysis, Insights and Forecast - by End User
- 9.2.1. Hospitals and Birthing Centers
- 9.2.2. Diagnostic Labs
- 9.2.3. Other End Users
- 9.1. Market Analysis, Insights and Forecast - by Product Type
- 10. South America Incubator Devices Industry Analysis, Insights and Forecast, 2019-2031
- 10.1. Market Analysis, Insights and Forecast - by Product Type
- 10.1.1. Neonatal Incubators
- 10.1.1.1. Portable or Transport Incubator
- 10.1.1.2. Open Box Incubator
- 10.1.1.3. Close Box Incubator
- 10.1.1.4. Double Walled Incubator
- 10.1.2. Microbiological Incubators
- 10.1.3. Other Product Types
- 10.1.1. Neonatal Incubators
- 10.2. Market Analysis, Insights and Forecast - by End User
- 10.2.1. Hospitals and Birthing Centers
- 10.2.2. Diagnostic Labs
- 10.2.3. Other End Users
- 10.1. Market Analysis, Insights and Forecast - by Product Type
- 11. North America Incubator Devices Industry Analysis, Insights and Forecast, 2019-2031
- 11.1. Market Analysis, Insights and Forecast - By Country/Sub-region
- 11.1.1 United States
- 11.1.2 Canada
- 11.1.3 Mexico
- 12. Europe Incubator Devices Industry Analysis, Insights and Forecast, 2019-2031
- 12.1. Market Analysis, Insights and Forecast - By Country/Sub-region
- 12.1.1 Germany
- 12.1.2 United Kingdom
- 12.1.3 France
- 12.1.4 Italy
- 12.1.5 Spain
- 12.1.6 Rest of Europe
- 13. Asia Pacific Incubator Devices Industry Analysis, Insights and Forecast, 2019-2031
- 13.1. Market Analysis, Insights and Forecast - By Country/Sub-region
- 13.1.1 China
- 13.1.2 Japan
- 13.1.3 India
- 13.1.4 Australia
- 13.1.5 South Korea
- 13.1.6 Rest of Asia Pacific
- 14. Middle East and Africa Incubator Devices Industry Analysis, Insights and Forecast, 2019-2031
- 14.1. Market Analysis, Insights and Forecast - By Country/Sub-region
- 14.1.1 GCC
- 14.1.2 South Africa
- 14.1.3 Rest of Middle East and Africa
- 15. South America Incubator Devices Industry Analysis, Insights and Forecast, 2019-2031
- 15.1. Market Analysis, Insights and Forecast - By Country/Sub-region
- 15.1.1 Brazil
- 15.1.2 Argentina
- 15.1.3 Rest of South America
- 16. Competitive Analysis
- 16.1. Global Market Share Analysis 2024
- 16.2. Company Profiles
- 16.2.1 Phoenix Medical Systems (P) Ltd
- 16.2.1.1. Overview
- 16.2.1.2. Products
- 16.2.1.3. SWOT Analysis
- 16.2.1.4. Recent Developments
- 16.2.1.5. Financials (Based on Availability)
- 16.2.2 BMT Medical Technology sro
- 16.2.2.1. Overview
- 16.2.2.2. Products
- 16.2.2.3. SWOT Analysis
- 16.2.2.4. Recent Developments
- 16.2.2.5. Financials (Based on Availability)
- 16.2.3 Ningbo David Medical Device Co Ltd
- 16.2.3.1. Overview
- 16.2.3.2. Products
- 16.2.3.3. SWOT Analysis
- 16.2.3.4. Recent Developments
- 16.2.3.5. Financials (Based on Availability)
- 16.2.4 GE Healthcare
- 16.2.4.1. Overview
- 16.2.4.2. Products
- 16.2.4.3. SWOT Analysis
- 16.2.4.4. Recent Developments
- 16.2.4.5. Financials (Based on Availability)
- 16.2.5 Atom Medical Corporation
- 16.2.5.1. Overview
- 16.2.5.2. Products
- 16.2.5.3. SWOT Analysis
- 16.2.5.4. Recent Developments
- 16.2.5.5. Financials (Based on Availability)
- 16.2.6 Thermo Fisher Scientific Inc
- 16.2.6.1. Overview
- 16.2.6.2. Products
- 16.2.6.3. SWOT Analysis
- 16.2.6.4. Recent Developments
- 16.2.6.5. Financials (Based on Availability)
- 16.2.7 Andreas Hettich GmbH & Co KG
- 16.2.7.1. Overview
- 16.2.7.2. Products
- 16.2.7.3. SWOT Analysis
- 16.2.7.4. Recent Developments
- 16.2.7.5. Financials (Based on Availability)
- 16.2.8 Zhengzhou Dison Instrument and Meter Co Ltd
- 16.2.8.1. Overview
- 16.2.8.2. Products
- 16.2.8.3. SWOT Analysis
- 16.2.8.4. Recent Developments
- 16.2.8.5. Financials (Based on Availability)
- 16.2.9 Medhold Medical (PTY) Ltd
- 16.2.9.1. Overview
- 16.2.9.2. Products
- 16.2.9.3. SWOT Analysis
- 16.2.9.4. Recent Developments
- 16.2.9.5. Financials (Based on Availability)
- 16.2.10 Dragerwerk AG & Co KGaA
- 16.2.10.1. Overview
- 16.2.10.2. Products
- 16.2.10.3. SWOT Analysis
- 16.2.10.4. Recent Developments
- 16.2.10.5. Financials (Based on Availability)
- 16.2.11 Archimed (Natus Medical Incorporated)
- 16.2.11.1. Overview
- 16.2.11.2. Products
- 16.2.11.3. SWOT Analysis
- 16.2.11.4. Recent Developments
- 16.2.11.5. Financials (Based on Availability)
- 16.2.12 PHC Corporation
- 16.2.12.1. Overview
- 16.2.12.2. Products
- 16.2.12.3. SWOT Analysis
- 16.2.12.4. Recent Developments
- 16.2.12.5. Financials (Based on Availability)
- 16.2.1 Phoenix Medical Systems (P) Ltd
List of Figures
- Figure 1: Global Incubator Devices Industry Revenue Breakdown (Million, %) by Region 2024 & 2032
- Figure 2: Global Incubator Devices Industry Volume Breakdown (K Unit, %) by Region 2024 & 2032
- Figure 3: North America Incubator Devices Industry Revenue (Million), by Country 2024 & 2032
- Figure 4: North America Incubator Devices Industry Volume (K Unit), by Country 2024 & 2032
- Figure 5: North America Incubator Devices Industry Revenue Share (%), by Country 2024 & 2032
- Figure 6: North America Incubator Devices Industry Volume Share (%), by Country 2024 & 2032
- Figure 7: Europe Incubator Devices Industry Revenue (Million), by Country 2024 & 2032
- Figure 8: Europe Incubator Devices Industry Volume (K Unit), by Country 2024 & 2032
- Figure 9: Europe Incubator Devices Industry Revenue Share (%), by Country 2024 & 2032
- Figure 10: Europe Incubator Devices Industry Volume Share (%), by Country 2024 & 2032
- Figure 11: Asia Pacific Incubator Devices Industry Revenue (Million), by Country 2024 & 2032
- Figure 12: Asia Pacific Incubator Devices Industry Volume (K Unit), by Country 2024 & 2032
- Figure 13: Asia Pacific Incubator Devices Industry Revenue Share (%), by Country 2024 & 2032
- Figure 14: Asia Pacific Incubator Devices Industry Volume Share (%), by Country 2024 & 2032
- Figure 15: Middle East and Africa Incubator Devices Industry Revenue (Million), by Country 2024 & 2032
- Figure 16: Middle East and Africa Incubator Devices Industry Volume (K Unit), by Country 2024 & 2032
- Figure 17: Middle East and Africa Incubator Devices Industry Revenue Share (%), by Country 2024 & 2032
- Figure 18: Middle East and Africa Incubator Devices Industry Volume Share (%), by Country 2024 & 2032
- Figure 19: South America Incubator Devices Industry Revenue (Million), by Country 2024 & 2032
- Figure 20: South America Incubator Devices Industry Volume (K Unit), by Country 2024 & 2032
- Figure 21: South America Incubator Devices Industry Revenue Share (%), by Country 2024 & 2032
- Figure 22: South America Incubator Devices Industry Volume Share (%), by Country 2024 & 2032
- Figure 23: North America Incubator Devices Industry Revenue (Million), by Product Type 2024 & 2032
- Figure 24: North America Incubator Devices Industry Volume (K Unit), by Product Type 2024 & 2032
- Figure 25: North America Incubator Devices Industry Revenue Share (%), by Product Type 2024 & 2032
- Figure 26: North America Incubator Devices Industry Volume Share (%), by Product Type 2024 & 2032
- Figure 27: North America Incubator Devices Industry Revenue (Million), by End User 2024 & 2032
- Figure 28: North America Incubator Devices Industry Volume (K Unit), by End User 2024 & 2032
- Figure 29: North America Incubator Devices Industry Revenue Share (%), by End User 2024 & 2032
- Figure 30: North America Incubator Devices Industry Volume Share (%), by End User 2024 & 2032
- Figure 31: North America Incubator Devices Industry Revenue (Million), by Country 2024 & 2032
- Figure 32: North America Incubator Devices Industry Volume (K Unit), by Country 2024 & 2032
- Figure 33: North America Incubator Devices Industry Revenue Share (%), by Country 2024 & 2032
- Figure 34: North America Incubator Devices Industry Volume Share (%), by Country 2024 & 2032
- Figure 35: Europe Incubator Devices Industry Revenue (Million), by Product Type 2024 & 2032
- Figure 36: Europe Incubator Devices Industry Volume (K Unit), by Product Type 2024 & 2032
- Figure 37: Europe Incubator Devices Industry Revenue Share (%), by Product Type 2024 & 2032
- Figure 38: Europe Incubator Devices Industry Volume Share (%), by Product Type 2024 & 2032
- Figure 39: Europe Incubator Devices Industry Revenue (Million), by End User 2024 & 2032
- Figure 40: Europe Incubator Devices Industry Volume (K Unit), by End User 2024 & 2032
- Figure 41: Europe Incubator Devices Industry Revenue Share (%), by End User 2024 & 2032
- Figure 42: Europe Incubator Devices Industry Volume Share (%), by End User 2024 & 2032
- Figure 43: Europe Incubator Devices Industry Revenue (Million), by Country 2024 & 2032
- Figure 44: Europe Incubator Devices Industry Volume (K Unit), by Country 2024 & 2032
- Figure 45: Europe Incubator Devices Industry Revenue Share (%), by Country 2024 & 2032
- Figure 46: Europe Incubator Devices Industry Volume Share (%), by Country 2024 & 2032
- Figure 47: Asia Pacific Incubator Devices Industry Revenue (Million), by Product Type 2024 & 2032
- Figure 48: Asia Pacific Incubator Devices Industry Volume (K Unit), by Product Type 2024 & 2032
- Figure 49: Asia Pacific Incubator Devices Industry Revenue Share (%), by Product Type 2024 & 2032
- Figure 50: Asia Pacific Incubator Devices Industry Volume Share (%), by Product Type 2024 & 2032
- Figure 51: Asia Pacific Incubator Devices Industry Revenue (Million), by End User 2024 & 2032
- Figure 52: Asia Pacific Incubator Devices Industry Volume (K Unit), by End User 2024 & 2032
- Figure 53: Asia Pacific Incubator Devices Industry Revenue Share (%), by End User 2024 & 2032
- Figure 54: Asia Pacific Incubator Devices Industry Volume Share (%), by End User 2024 & 2032
- Figure 55: Asia Pacific Incubator Devices Industry Revenue (Million), by Country 2024 & 2032
- Figure 56: Asia Pacific Incubator Devices Industry Volume (K Unit), by Country 2024 & 2032
- Figure 57: Asia Pacific Incubator Devices Industry Revenue Share (%), by Country 2024 & 2032
- Figure 58: Asia Pacific Incubator Devices Industry Volume Share (%), by Country 2024 & 2032
- Figure 59: Middle East and Africa Incubator Devices Industry Revenue (Million), by Product Type 2024 & 2032
- Figure 60: Middle East and Africa Incubator Devices Industry Volume (K Unit), by Product Type 2024 & 2032
- Figure 61: Middle East and Africa Incubator Devices Industry Revenue Share (%), by Product Type 2024 & 2032
- Figure 62: Middle East and Africa Incubator Devices Industry Volume Share (%), by Product Type 2024 & 2032
- Figure 63: Middle East and Africa Incubator Devices Industry Revenue (Million), by End User 2024 & 2032
- Figure 64: Middle East and Africa Incubator Devices Industry Volume (K Unit), by End User 2024 & 2032
- Figure 65: Middle East and Africa Incubator Devices Industry Revenue Share (%), by End User 2024 & 2032
- Figure 66: Middle East and Africa Incubator Devices Industry Volume Share (%), by End User 2024 & 2032
- Figure 67: Middle East and Africa Incubator Devices Industry Revenue (Million), by Country 2024 & 2032
- Figure 68: Middle East and Africa Incubator Devices Industry Volume (K Unit), by Country 2024 & 2032
- Figure 69: Middle East and Africa Incubator Devices Industry Revenue Share (%), by Country 2024 & 2032
- Figure 70: Middle East and Africa Incubator Devices Industry Volume Share (%), by Country 2024 & 2032
- Figure 71: South America Incubator Devices Industry Revenue (Million), by Product Type 2024 & 2032
- Figure 72: South America Incubator Devices Industry Volume (K Unit), by Product Type 2024 & 2032
- Figure 73: South America Incubator Devices Industry Revenue Share (%), by Product Type 2024 & 2032
- Figure 74: South America Incubator Devices Industry Volume Share (%), by Product Type 2024 & 2032
- Figure 75: South America Incubator Devices Industry Revenue (Million), by End User 2024 & 2032
- Figure 76: South America Incubator Devices Industry Volume (K Unit), by End User 2024 & 2032
- Figure 77: South America Incubator Devices Industry Revenue Share (%), by End User 2024 & 2032
- Figure 78: South America Incubator Devices Industry Volume Share (%), by End User 2024 & 2032
- Figure 79: South America Incubator Devices Industry Revenue (Million), by Country 2024 & 2032
- Figure 80: South America Incubator Devices Industry Volume (K Unit), by Country 2024 & 2032
- Figure 81: South America Incubator Devices Industry Revenue Share (%), by Country 2024 & 2032
- Figure 82: South America Incubator Devices Industry Volume Share (%), by Country 2024 & 2032
List of Tables
- Table 1: Global Incubator Devices Industry Revenue Million Forecast, by Region 2019 & 2032
- Table 2: Global Incubator Devices Industry Volume K Unit Forecast, by Region 2019 & 2032
- Table 3: Global Incubator Devices Industry Revenue Million Forecast, by Product Type 2019 & 2032
- Table 4: Global Incubator Devices Industry Volume K Unit Forecast, by Product Type 2019 & 2032
- Table 5: Global Incubator Devices Industry Revenue Million Forecast, by End User 2019 & 2032
- Table 6: Global Incubator Devices Industry Volume K Unit Forecast, by End User 2019 & 2032
- Table 7: Global Incubator Devices Industry Revenue Million Forecast, by Region 2019 & 2032
- Table 8: Global Incubator Devices Industry Volume K Unit Forecast, by Region 2019 & 2032
- Table 9: Global Incubator Devices Industry Revenue Million Forecast, by Country 2019 & 2032
- Table 10: Global Incubator Devices Industry Volume K Unit Forecast, by Country 2019 & 2032
- Table 11: United States Incubator Devices Industry Revenue (Million) Forecast, by Application 2019 & 2032
- Table 12: United States Incubator Devices Industry Volume (K Unit) Forecast, by Application 2019 & 2032
- Table 13: Canada Incubator Devices Industry Revenue (Million) Forecast, by Application 2019 & 2032
- Table 14: Canada Incubator Devices Industry Volume (K Unit) Forecast, by Application 2019 & 2032
- Table 15: Mexico Incubator Devices Industry Revenue (Million) Forecast, by Application 2019 & 2032
- Table 16: Mexico Incubator Devices Industry Volume (K Unit) Forecast, by Application 2019 & 2032
- Table 17: Global Incubator Devices Industry Revenue Million Forecast, by Country 2019 & 2032
- Table 18: Global Incubator Devices Industry Volume K Unit Forecast, by Country 2019 & 2032
- Table 19: Germany Incubator Devices Industry Revenue (Million) Forecast, by Application 2019 & 2032
- Table 20: Germany Incubator Devices Industry Volume (K Unit) Forecast, by Application 2019 & 2032
- Table 21: United Kingdom Incubator Devices Industry Revenue (Million) Forecast, by Application 2019 & 2032
- Table 22: United Kingdom Incubator Devices Industry Volume (K Unit) Forecast, by Application 2019 & 2032
- Table 23: France Incubator Devices Industry Revenue (Million) Forecast, by Application 2019 & 2032
- Table 24: France Incubator Devices Industry Volume (K Unit) Forecast, by Application 2019 & 2032
- Table 25: Italy Incubator Devices Industry Revenue (Million) Forecast, by Application 2019 & 2032
- Table 26: Italy Incubator Devices Industry Volume (K Unit) Forecast, by Application 2019 & 2032
- Table 27: Spain Incubator Devices Industry Revenue (Million) Forecast, by Application 2019 & 2032
- Table 28: Spain Incubator Devices Industry Volume (K Unit) Forecast, by Application 2019 & 2032
- Table 29: Rest of Europe Incubator Devices Industry Revenue (Million) Forecast, by Application 2019 & 2032
- Table 30: Rest of Europe Incubator Devices Industry Volume (K Unit) Forecast, by Application 2019 & 2032
- Table 31: Global Incubator Devices Industry Revenue Million Forecast, by Country 2019 & 2032
- Table 32: Global Incubator Devices Industry Volume K Unit Forecast, by Country 2019 & 2032
- Table 33: China Incubator Devices Industry Revenue (Million) Forecast, by Application 2019 & 2032
- Table 34: China Incubator Devices Industry Volume (K Unit) Forecast, by Application 2019 & 2032
- Table 35: Japan Incubator Devices Industry Revenue (Million) Forecast, by Application 2019 & 2032
- Table 36: Japan Incubator Devices Industry Volume (K Unit) Forecast, by Application 2019 & 2032
- Table 37: India Incubator Devices Industry Revenue (Million) Forecast, by Application 2019 & 2032
- Table 38: India Incubator Devices Industry Volume (K Unit) Forecast, by Application 2019 & 2032
- Table 39: Australia Incubator Devices Industry Revenue (Million) Forecast, by Application 2019 & 2032
- Table 40: Australia Incubator Devices Industry Volume (K Unit) Forecast, by Application 2019 & 2032
- Table 41: South Korea Incubator Devices Industry Revenue (Million) Forecast, by Application 2019 & 2032
- Table 42: South Korea Incubator Devices Industry Volume (K Unit) Forecast, by Application 2019 & 2032
- Table 43: Rest of Asia Pacific Incubator Devices Industry Revenue (Million) Forecast, by Application 2019 & 2032
- Table 44: Rest of Asia Pacific Incubator Devices Industry Volume (K Unit) Forecast, by Application 2019 & 2032
- Table 45: Global Incubator Devices Industry Revenue Million Forecast, by Country 2019 & 2032
- Table 46: Global Incubator Devices Industry Volume K Unit Forecast, by Country 2019 & 2032
- Table 47: GCC Incubator Devices Industry Revenue (Million) Forecast, by Application 2019 & 2032
- Table 48: GCC Incubator Devices Industry Volume (K Unit) Forecast, by Application 2019 & 2032
- Table 49: South Africa Incubator Devices Industry Revenue (Million) Forecast, by Application 2019 & 2032
- Table 50: South Africa Incubator Devices Industry Volume (K Unit) Forecast, by Application 2019 & 2032
- Table 51: Rest of Middle East and Africa Incubator Devices Industry Revenue (Million) Forecast, by Application 2019 & 2032
- Table 52: Rest of Middle East and Africa Incubator Devices Industry Volume (K Unit) Forecast, by Application 2019 & 2032
- Table 53: Global Incubator Devices Industry Revenue Million Forecast, by Country 2019 & 2032
- Table 54: Global Incubator Devices Industry Volume K Unit Forecast, by Country 2019 & 2032
- Table 55: Brazil Incubator Devices Industry Revenue (Million) Forecast, by Application 2019 & 2032
- Table 56: Brazil Incubator Devices Industry Volume (K Unit) Forecast, by Application 2019 & 2032
- Table 57: Argentina Incubator Devices Industry Revenue (Million) Forecast, by Application 2019 & 2032
- Table 58: Argentina Incubator Devices Industry Volume (K Unit) Forecast, by Application 2019 & 2032
- Table 59: Rest of South America Incubator Devices Industry Revenue (Million) Forecast, by Application 2019 & 2032
- Table 60: Rest of South America Incubator Devices Industry Volume (K Unit) Forecast, by Application 2019 & 2032
- Table 61: Global Incubator Devices Industry Revenue Million Forecast, by Product Type 2019 & 2032
- Table 62: Global Incubator Devices Industry Volume K Unit Forecast, by Product Type 2019 & 2032
- Table 63: Global Incubator Devices Industry Revenue Million Forecast, by End User 2019 & 2032
- Table 64: Global Incubator Devices Industry Volume K Unit Forecast, by End User 2019 & 2032
- Table 65: Global Incubator Devices Industry Revenue Million Forecast, by Country 2019 & 2032
- Table 66: Global Incubator Devices Industry Volume K Unit Forecast, by Country 2019 & 2032
- Table 67: United States Incubator Devices Industry Revenue (Million) Forecast, by Application 2019 & 2032
- Table 68: United States Incubator Devices Industry Volume (K Unit) Forecast, by Application 2019 & 2032
- Table 69: Canada Incubator Devices Industry Revenue (Million) Forecast, by Application 2019 & 2032
- Table 70: Canada Incubator Devices Industry Volume (K Unit) Forecast, by Application 2019 & 2032
- Table 71: Mexico Incubator Devices Industry Revenue (Million) Forecast, by Application 2019 & 2032
- Table 72: Mexico Incubator Devices Industry Volume (K Unit) Forecast, by Application 2019 & 2032
- Table 73: Global Incubator Devices Industry Revenue Million Forecast, by Product Type 2019 & 2032
- Table 74: Global Incubator Devices Industry Volume K Unit Forecast, by Product Type 2019 & 2032
- Table 75: Global Incubator Devices Industry Revenue Million Forecast, by End User 2019 & 2032
- Table 76: Global Incubator Devices Industry Volume K Unit Forecast, by End User 2019 & 2032
- Table 77: Global Incubator Devices Industry Revenue Million Forecast, by Country 2019 & 2032
- Table 78: Global Incubator Devices Industry Volume K Unit Forecast, by Country 2019 & 2032
- Table 79: Germany Incubator Devices Industry Revenue (Million) Forecast, by Application 2019 & 2032
- Table 80: Germany Incubator Devices Industry Volume (K Unit) Forecast, by Application 2019 & 2032
- Table 81: United Kingdom Incubator Devices Industry Revenue (Million) Forecast, by Application 2019 & 2032
- Table 82: United Kingdom Incubator Devices Industry Volume (K Unit) Forecast, by Application 2019 & 2032
- Table 83: France Incubator Devices Industry Revenue (Million) Forecast, by Application 2019 & 2032
- Table 84: France Incubator Devices Industry Volume (K Unit) Forecast, by Application 2019 & 2032
- Table 85: Italy Incubator Devices Industry Revenue (Million) Forecast, by Application 2019 & 2032
- Table 86: Italy Incubator Devices Industry Volume (K Unit) Forecast, by Application 2019 & 2032
- Table 87: Spain Incubator Devices Industry Revenue (Million) Forecast, by Application 2019 & 2032
- Table 88: Spain Incubator Devices Industry Volume (K Unit) Forecast, by Application 2019 & 2032
- Table 89: Rest of Europe Incubator Devices Industry Revenue (Million) Forecast, by Application 2019 & 2032
- Table 90: Rest of Europe Incubator Devices Industry Volume (K Unit) Forecast, by Application 2019 & 2032
- Table 91: Global Incubator Devices Industry Revenue Million Forecast, by Product Type 2019 & 2032
- Table 92: Global Incubator Devices Industry Volume K Unit Forecast, by Product Type 2019 & 2032
- Table 93: Global Incubator Devices Industry Revenue Million Forecast, by End User 2019 & 2032
- Table 94: Global Incubator Devices Industry Volume K Unit Forecast, by End User 2019 & 2032
- Table 95: Global Incubator Devices Industry Revenue Million Forecast, by Country 2019 & 2032
- Table 96: Global Incubator Devices Industry Volume K Unit Forecast, by Country 2019 & 2032
- Table 97: China Incubator Devices Industry Revenue (Million) Forecast, by Application 2019 & 2032
- Table 98: China Incubator Devices Industry Volume (K Unit) Forecast, by Application 2019 & 2032
- Table 99: Japan Incubator Devices Industry Revenue (Million) Forecast, by Application 2019 & 2032
- Table 100: Japan Incubator Devices Industry Volume (K Unit) Forecast, by Application 2019 & 2032
- Table 101: India Incubator Devices Industry Revenue (Million) Forecast, by Application 2019 & 2032
- Table 102: India Incubator Devices Industry Volume (K Unit) Forecast, by Application 2019 & 2032
- Table 103: Australia Incubator Devices Industry Revenue (Million) Forecast, by Application 2019 & 2032
- Table 104: Australia Incubator Devices Industry Volume (K Unit) Forecast, by Application 2019 & 2032
- Table 105: South Korea Incubator Devices Industry Revenue (Million) Forecast, by Application 2019 & 2032
- Table 106: South Korea Incubator Devices Industry Volume (K Unit) Forecast, by Application 2019 & 2032
- Table 107: Rest of Asia Pacific Incubator Devices Industry Revenue (Million) Forecast, by Application 2019 & 2032
- Table 108: Rest of Asia Pacific Incubator Devices Industry Volume (K Unit) Forecast, by Application 2019 & 2032
- Table 109: Global Incubator Devices Industry Revenue Million Forecast, by Product Type 2019 & 2032
- Table 110: Global Incubator Devices Industry Volume K Unit Forecast, by Product Type 2019 & 2032
- Table 111: Global Incubator Devices Industry Revenue Million Forecast, by End User 2019 & 2032
- Table 112: Global Incubator Devices Industry Volume K Unit Forecast, by End User 2019 & 2032
- Table 113: Global Incubator Devices Industry Revenue Million Forecast, by Country 2019 & 2032
- Table 114: Global Incubator Devices Industry Volume K Unit Forecast, by Country 2019 & 2032
- Table 115: GCC Incubator Devices Industry Revenue (Million) Forecast, by Application 2019 & 2032
- Table 116: GCC Incubator Devices Industry Volume (K Unit) Forecast, by Application 2019 & 2032
- Table 117: South Africa Incubator Devices Industry Revenue (Million) Forecast, by Application 2019 & 2032
- Table 118: South Africa Incubator Devices Industry Volume (K Unit) Forecast, by Application 2019 & 2032
- Table 119: Rest of Middle East and Africa Incubator Devices Industry Revenue (Million) Forecast, by Application 2019 & 2032
- Table 120: Rest of Middle East and Africa Incubator Devices Industry Volume (K Unit) Forecast, by Application 2019 & 2032
- Table 121: Global Incubator Devices Industry Revenue Million Forecast, by Product Type 2019 & 2032
- Table 122: Global Incubator Devices Industry Volume K Unit Forecast, by Product Type 2019 & 2032
- Table 123: Global Incubator Devices Industry Revenue Million Forecast, by End User 2019 & 2032
- Table 124: Global Incubator Devices Industry Volume K Unit Forecast, by End User 2019 & 2032
- Table 125: Global Incubator Devices Industry Revenue Million Forecast, by Country 2019 & 2032
- Table 126: Global Incubator Devices Industry Volume K Unit Forecast, by Country 2019 & 2032
- Table 127: Brazil Incubator Devices Industry Revenue (Million) Forecast, by Application 2019 & 2032
- Table 128: Brazil Incubator Devices Industry Volume (K Unit) Forecast, by Application 2019 & 2032
- Table 129: Argentina Incubator Devices Industry Revenue (Million) Forecast, by Application 2019 & 2032
- Table 130: Argentina Incubator Devices Industry Volume (K Unit) Forecast, by Application 2019 & 2032
- Table 131: Rest of South America Incubator Devices Industry Revenue (Million) Forecast, by Application 2019 & 2032
- Table 132: Rest of South America Incubator Devices Industry Volume (K Unit) Forecast, by Application 2019 & 2032
Frequently Asked Questions
1. What is the projected Compound Annual Growth Rate (CAGR) of the Incubator Devices Industry?
The projected CAGR is approximately 6.90%.
2. Which companies are prominent players in the Incubator Devices Industry?
Key companies in the market include Phoenix Medical Systems (P) Ltd, BMT Medical Technology sro, Ningbo David Medical Device Co Ltd, GE Healthcare, Atom Medical Corporation, Thermo Fisher Scientific Inc, Andreas Hettich GmbH & Co KG, Zhengzhou Dison Instrument and Meter Co Ltd, Medhold Medical (PTY) Ltd, Dragerwerk AG & Co KGaA, Archimed (Natus Medical Incorporated), PHC Corporation.
3. What are the main segments of the Incubator Devices Industry?
The market segments include Product Type, End User.
4. Can you provide details about the market size?
The market size is estimated to be USD XX Million as of 2022.
5. What are some drivers contributing to market growth?
Rising Prevalence of Premature Babies; Low Birth Weight of Babies; Growing R&D in Healthcare.
6. What are the notable trends driving market growth?
The Hospitals and Birthing Centers Segment is Expected to Witness a Healthy Growth Over the Forecast Period.
7. Are there any restraints impacting market growth?
High Cost of Incubators; Lack of Awareness in Emerging Economies.
8. Can you provide examples of recent developments in the market?
October 2022: the University of Birmingham Enterprise, Greater Birmingham and Solihull Local Enterprise, and West mainlands Combined Authority launched Unit - 9, a medical technology incubator that facilitates medical research, proof of concept, and prototyping activity.
9. What pricing options are available for accessing the report?
Pricing options include single-user, multi-user, and enterprise licenses priced at USD 4750, USD 5250, and USD 8750 respectively.
10. Is the market size provided in terms of value or volume?
The market size is provided in terms of value, measured in Million and volume, measured in K Unit.
11. Are there any specific market keywords associated with the report?
Yes, the market keyword associated with the report is "Incubator Devices Industry," which aids in identifying and referencing the specific market segment covered.
12. How do I determine which pricing option suits my needs best?
The pricing options vary based on user requirements and access needs. Individual users may opt for single-user licenses, while businesses requiring broader access may choose multi-user or enterprise licenses for cost-effective access to the report.
13. Are there any additional resources or data provided in the Incubator Devices Industry report?
While the report offers comprehensive insights, it's advisable to review the specific contents or supplementary materials provided to ascertain if additional resources or data are available.
14. How can I stay updated on further developments or reports in the Incubator Devices Industry?
To stay informed about further developments, trends, and reports in the Incubator Devices Industry, consider subscribing to industry newsletters, following relevant companies and organizations, or regularly checking reputable industry news sources and publications.
Methodology
Step 1 - Identification of Relevant Samples Size from Population Database


Step 2 - Approaches for Defining Global Market Size (Value, Volume* & Price*)

Note*: In applicable scenarios
Step 3 - Data Sources
Primary Research
- Web Analytics
- Survey Reports
- Research Institute
- Latest Research Reports
- Opinion Leaders
Secondary Research
- Annual Reports
- White Paper
- Latest Press Release
- Industry Association
- Paid Database
- Investor Presentations

Step 4 - Data Triangulation
Involves using different sources of information in order to increase the validity of a study
These sources are likely to be stakeholders in a program - participants, other researchers, program staff, other community members, and so on.
Then we put all data in single framework & apply various statistical tools to find out the dynamic on the market.
During the analysis stage, feedback from the stakeholder groups would be compared to determine areas of agreement as well as areas of divergence
