

Key Insights
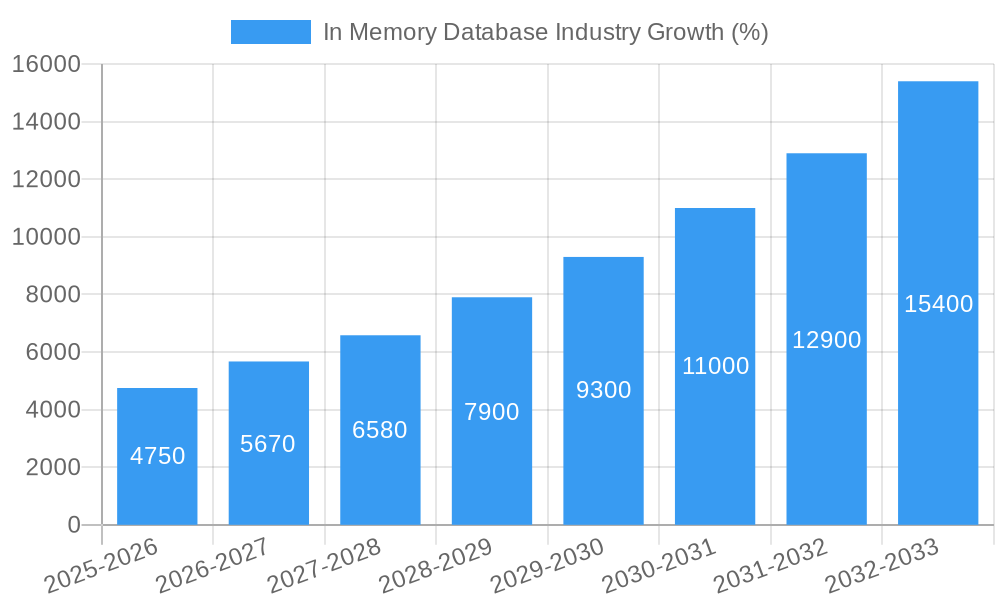
The in-memory database (IMDB) market is experiencing robust growth, driven by the increasing need for real-time data processing and analytics across diverse sectors. The market's Compound Annual Growth Rate (CAGR) of 19% from 2019 to 2024 signifies a strong upward trajectory, projected to continue in the forecast period (2025-2033). This growth is fueled by the expanding adoption of cloud computing, big data analytics, and the Internet of Things (IoT). Industries like telecommunications, BFSI (Banking, Financial Services, and Insurance), and retail are major contributors, demanding high-speed transactional capabilities and advanced analytical insights from their data. The market is segmented by industry type (small and medium-sized enterprises versus large enterprises) and end-user industry, reflecting varied needs and adoption rates across different sectors. The competitive landscape includes both established players like IBM, Oracle, and Microsoft, alongside specialized IMDB vendors such as VoltDB, Redis Labs, and DataStax, fostering innovation and diverse solutions.
The substantial growth in the IMDB market is anticipated to continue, driven by several factors. The rise of real-time applications, including fraud detection in BFSI, personalized customer experiences in retail, and efficient logistics management, necessitates faster data processing than traditional database systems can provide. Furthermore, the increasing volume and velocity of data generated by IoT devices necessitates solutions capable of handling high data throughput and low latency. While challenges remain, such as data security concerns and the potential for high implementation costs, the overall market outlook remains positive, with opportunities for growth across various regions, particularly in North America and Asia Pacific, due to their advanced technological infrastructure and high adoption rates of cloud-based services. The continued development of advanced features like enhanced scalability, improved security protocols, and integration with other data management tools will further propel market expansion.

In-Memory Database Industry Report: 2019-2033 Forecast
This comprehensive report provides a detailed analysis of the In-Memory Database industry, offering invaluable insights for stakeholders seeking to navigate this rapidly evolving market. With a focus on market dynamics, leading players, and future trends, this report is essential for strategic planning and investment decisions. The study period covers 2019-2033, with 2025 as the base and estimated year. The report projects a market valued at xx Million by 2033.
In Memory Database Industry Market Dynamics & Concentration
The In-Memory Database market is characterized by a dynamic interplay of factors influencing its growth and concentration. The market exhibits a moderately concentrated structure, with several key players holding significant market share. However, the landscape is also marked by the emergence of innovative entrants and disruptive technologies. Market share estimations for 2024 indicate that the top five players (IBM, Oracle, SAP, Redis Labs, and Microsoft) collectively hold approximately 60% of the market.
Innovation Drivers: Continuous advancements in hardware technologies (e.g., faster processors, increased memory capacity) and software architectures (e.g., cloud-native deployments, distributed databases) fuel market expansion.
Regulatory Frameworks: Data privacy regulations (GDPR, CCPA) and industry-specific compliance standards (e.g., HIPAA in healthcare) influence the adoption of secure and compliant in-memory database solutions.
Product Substitutes: Traditional relational databases and NoSQL databases compete with in-memory databases, although the latter's speed and performance advantages offer a compelling alternative for specific applications.
End-User Trends: Growing demand for real-time data analytics and applications across various industries, including BFSI, telecommunications, and retail, is driving significant market growth.
M&A Activities: The in-memory database market has witnessed a moderate level of mergers and acquisitions (M&As) in recent years, with xx M&A deals recorded between 2019 and 2024. These activities primarily focus on consolidating market share, acquiring specialized technologies, and expanding geographical reach.
In Memory Database Industry Industry Trends & Analysis
The In-Memory Database market is experiencing robust growth, driven by the increasing need for real-time insights and applications across diverse sectors. The market exhibited a Compound Annual Growth Rate (CAGR) of xx% during the historical period (2019-2024) and is projected to maintain a CAGR of xx% during the forecast period (2025-2033). This growth is fueled by several key trends:
Rise of Real-Time Analytics: The demand for real-time insights across industries is a primary driver. In-memory databases enable faster processing and analysis of large datasets, crucial for applications like fraud detection (BFSI), network monitoring (Telecom), and personalized recommendations (Retail).
Cloud Adoption: Cloud-based deployments of in-memory databases are gaining traction, offering scalability, cost-effectiveness, and enhanced accessibility. This trend is further fueled by the increasing adoption of hybrid cloud and multi-cloud strategies.
Technological Disruptions: Advancements in technologies such as in-memory computing, distributed architectures, and serverless computing continue to transform the landscape. This includes innovations in data compression techniques and query optimization algorithms that enhance performance and reduce costs.
Shifting Consumer Preferences: Users are increasingly demanding faster application response times and more personalized experiences, directly impacting the adoption of high-performance in-memory databases.
Competitive Dynamics: The market is characterized by intense competition among established players and emerging startups. Competitive pressures drive innovation and lead to more efficient and cost-effective solutions. Market penetration is growing across various segments, particularly in large enterprises and data-intensive industries.
Leading Markets & Segments in In Memory Database Industry
The North American market currently holds the largest share of the in-memory database market, followed by Europe and Asia Pacific. Within the market segments, the large enterprise segment dominates due to its higher spending power and critical need for advanced data processing capabilities.
By Industry Type:
- Large Enterprises: High adoption due to high data volumes and need for real-time insights. Strong economic growth, advanced IT infrastructure, and a supportive regulatory environment contribute to this segment's dominance.
- Small and Medium Enterprises (SMEs): Adoption is growing steadily, driven by cloud-based solutions and decreasing implementation costs.
By End-User Industry:
- Telecommunication and IT: High adoption driven by the need for network optimization, real-time monitoring, and fraud detection.
- BFSI: In-memory databases are crucial for real-time risk management, fraud prevention, and high-frequency trading.
- Logistics and Transportation: Real-time tracking, route optimization, and supply chain management are key drivers of adoption.
- Retail: Personalized recommendations, inventory management, and customer relationship management benefit from the speed of in-memory databases.
- Healthcare: Real-time patient monitoring, medical image analysis, and electronic health record (EHR) systems drive adoption.
- Other End-user Industries: Growing adoption across various sectors, including manufacturing, energy, and government, fuelled by increased digitization.
The growth in each of these segments is influenced by unique economic and regulatory conditions specific to each industry. For example, stringent data privacy regulations in healthcare increase demand for secure in-memory solutions.
In Memory Database Industry Product Developments
Recent product innovations focus on enhancing performance, scalability, and ease of use. Cloud-native solutions, advanced data compression techniques, and improved query optimization algorithms are key technological trends shaping product development. These innovations aim to meet the growing demands for real-time analytics, data-driven decision making, and enhanced application performance. Products are increasingly tailored to specific industry needs and compliance requirements. The competitive advantage lies in offering solutions with superior performance, cost-effectiveness, and ease of integration.
Key Drivers of In Memory Database Industry Growth
Several factors contribute to the strong growth of the in-memory database industry. Technological advancements, such as improved hardware and software capabilities, are central to this growth. The increasing adoption of cloud computing and big data analytics further fuels demand. Moreover, the growing need for real-time insights across various sectors, especially in finance, telecommunications, and retail, significantly boosts market expansion. Favorable economic conditions and supportive government policies in several regions also contribute to this rapid growth. For example, investments in digital infrastructure and initiatives promoting data-driven decision-making accelerate market adoption.
Challenges in the In Memory Database Industry Market
Despite the significant growth, several challenges hinder wider adoption. The high cost of implementation and maintenance of in-memory databases can be a significant barrier for smaller enterprises. Data security and privacy concerns remain a major obstacle, requiring robust security measures and compliance with strict regulations. The complexity of integrating in-memory databases into existing IT infrastructure can also deter some organizations. Competition from established database vendors and emerging technologies also creates pressure on pricing and innovation. These challenges impact the market penetration rate, particularly in cost-sensitive sectors.
Emerging Opportunities in In Memory Database Industry
The in-memory database industry presents several promising opportunities. The expansion into new markets and emerging economies holds significant potential for growth. Strategic partnerships and collaborations between database vendors and cloud providers will drive innovation and market reach. Furthermore, technological advancements, such as advancements in AI and machine learning, integrated into in-memory databases, will offer enhanced analytics capabilities and improved decision-making. Finally, the development of specialized solutions for industry-specific needs presents promising avenues for future growth.
Leading Players in the In Memory Database Industry Sector
- VoltDB Inc
- Raima Inc
- TIBCO Software Inc
- IBM Corporation
- MemSQL Inc
- VMware Inc (Pivotal Software Inc)
- Redis Labs Inc
- DataStax Inc
- Aerospike Inc
- Microsoft Corporation
- McObject LLC
- Couchbase Inc
- Oracle Corporation
- GridGain Systems Inc
- Altibase Corp
- SAP SE
Key Milestones in In Memory Database Industry Industry
May 2022: IBM and SAP extend their collaboration, with IBM adopting SAP S/4HANA Cloud and its in-memory database, SAP HANA, for its corporate transformation. This highlights the growing importance of in-memory databases in large-scale enterprise deployments.
November 2022: Redis Labs and Amazon Web Services (AWS) announce a multi-year strategic alliance, launching Redis Enterprise Cloud on AWS. This partnership strengthens the cloud-based in-memory database market and expands Redis's reach.
December 2022: The National Stock Exchange of India selects Raima Database Manager (RDM) Workgroup 12.0 for its trading platform. This demonstrates the reliability and performance capabilities of in-memory databases in high-volume, real-time applications.
Strategic Outlook for In Memory Database Industry Market
The in-memory database market is poised for continued growth, driven by several key factors. The increasing demand for real-time analytics, the expanding adoption of cloud computing, and advancements in related technologies like AI and machine learning create significant opportunities. Strategic partnerships and mergers and acquisitions will continue to reshape the competitive landscape. Companies focusing on innovation, ease of integration, and industry-specific solutions are well-positioned to capture significant market share in the years to come. The long-term potential of the market is substantial, driven by the ever-growing need for faster data processing and analysis across all sectors.
In Memory Database Industry Segmentation
-
1. Industry Type
- 1.1. Small and Medium
- 1.2. Large
-
2. End-user Industry
- 2.1. Telecommunication and IT
- 2.2. BFSI
- 2.3. Logistics and Transportation
- 2.4. Retail
- 2.5. Entertainment and media
- 2.6. Healthcare
- 2.7. Other End-user Industries
In Memory Database Industry Segmentation By Geography
-
1. North America
- 1.1. United States
- 1.2. Canada
-
2. Europe
- 2.1. United Kingdom
- 2.2. Germany
- 2.3. France
- 2.4. Rest of Europe
-
3. Asia Pacific
- 3.1. China
- 3.2. Japan
- 3.3. India
- 3.4. Rest of Asia Pacific
- 4. Rest of the World

In Memory Database Industry REPORT HIGHLIGHTS
| Aspects | Details |
|---|---|
| Study Period | 2019-2033 |
| Base Year | 2024 |
| Estimated Year | 2025 |
| Forecast Period | 2025-2033 |
| Historical Period | 2019-2024 |
| Growth Rate | CAGR of 19.00% from 2019-2033 |
| Segmentation |
|
Table of Contents
- 1. Introduction
- 1.1. Research Scope
- 1.2. Market Segmentation
- 1.3. Research Methodology
- 1.4. Definitions and Assumptions
- 2. Executive Summary
- 2.1. Introduction
- 3. Market Dynamics
- 3.1. Introduction
- 3.2. Market Drivers
- 3.2.1. Decreasing Hardware Cost; Increasing Penetration Of Trends Like Big Data And IOT; Increase In The Volume Of Data Generated And Shift Of Enterprise Operations
- 3.3. Market Restrains
- 3.3.1. Resilience In Integration With VLDB'S
- 3.4. Market Trends
- 3.4.1. Telecommunication End-User Industry to Hold Significant Market Share
- 4. Market Factor Analysis
- 4.1. Porters Five Forces
- 4.2. Supply/Value Chain
- 4.3. PESTEL analysis
- 4.4. Market Entropy
- 4.5. Patent/Trademark Analysis
- 5. Global In Memory Database Industry Analysis, Insights and Forecast, 2019-2031
- 5.1. Market Analysis, Insights and Forecast - by Industry Type
- 5.1.1. Small and Medium
- 5.1.2. Large
- 5.2. Market Analysis, Insights and Forecast - by End-user Industry
- 5.2.1. Telecommunication and IT
- 5.2.2. BFSI
- 5.2.3. Logistics and Transportation
- 5.2.4. Retail
- 5.2.5. Entertainment and media
- 5.2.6. Healthcare
- 5.2.7. Other End-user Industries
- 5.3. Market Analysis, Insights and Forecast - by Region
- 5.3.1. North America
- 5.3.2. Europe
- 5.3.3. Asia Pacific
- 5.3.4. Rest of the World
- 5.1. Market Analysis, Insights and Forecast - by Industry Type
- 6. North America In Memory Database Industry Analysis, Insights and Forecast, 2019-2031
- 6.1. Market Analysis, Insights and Forecast - by Industry Type
- 6.1.1. Small and Medium
- 6.1.2. Large
- 6.2. Market Analysis, Insights and Forecast - by End-user Industry
- 6.2.1. Telecommunication and IT
- 6.2.2. BFSI
- 6.2.3. Logistics and Transportation
- 6.2.4. Retail
- 6.2.5. Entertainment and media
- 6.2.6. Healthcare
- 6.2.7. Other End-user Industries
- 6.1. Market Analysis, Insights and Forecast - by Industry Type
- 7. Europe In Memory Database Industry Analysis, Insights and Forecast, 2019-2031
- 7.1. Market Analysis, Insights and Forecast - by Industry Type
- 7.1.1. Small and Medium
- 7.1.2. Large
- 7.2. Market Analysis, Insights and Forecast - by End-user Industry
- 7.2.1. Telecommunication and IT
- 7.2.2. BFSI
- 7.2.3. Logistics and Transportation
- 7.2.4. Retail
- 7.2.5. Entertainment and media
- 7.2.6. Healthcare
- 7.2.7. Other End-user Industries
- 7.1. Market Analysis, Insights and Forecast - by Industry Type
- 8. Asia Pacific In Memory Database Industry Analysis, Insights and Forecast, 2019-2031
- 8.1. Market Analysis, Insights and Forecast - by Industry Type
- 8.1.1. Small and Medium
- 8.1.2. Large
- 8.2. Market Analysis, Insights and Forecast - by End-user Industry
- 8.2.1. Telecommunication and IT
- 8.2.2. BFSI
- 8.2.3. Logistics and Transportation
- 8.2.4. Retail
- 8.2.5. Entertainment and media
- 8.2.6. Healthcare
- 8.2.7. Other End-user Industries
- 8.1. Market Analysis, Insights and Forecast - by Industry Type
- 9. Rest of the World In Memory Database Industry Analysis, Insights and Forecast, 2019-2031
- 9.1. Market Analysis, Insights and Forecast - by Industry Type
- 9.1.1. Small and Medium
- 9.1.2. Large
- 9.2. Market Analysis, Insights and Forecast - by End-user Industry
- 9.2.1. Telecommunication and IT
- 9.2.2. BFSI
- 9.2.3. Logistics and Transportation
- 9.2.4. Retail
- 9.2.5. Entertainment and media
- 9.2.6. Healthcare
- 9.2.7. Other End-user Industries
- 9.1. Market Analysis, Insights and Forecast - by Industry Type
- 10. North America In Memory Database Industry Analysis, Insights and Forecast, 2019-2031
- 10.1. Market Analysis, Insights and Forecast - By Country/Sub-region
- 10.1.1 United States
- 10.1.2 Canada
- 10.1.3 Mexico
- 11. Europe In Memory Database Industry Analysis, Insights and Forecast, 2019-2031
- 11.1. Market Analysis, Insights and Forecast - By Country/Sub-region
- 11.1.1 Germany
- 11.1.2 United Kingdom
- 11.1.3 France
- 11.1.4 Spain
- 11.1.5 Italy
- 11.1.6 Spain
- 11.1.7 Belgium
- 11.1.8 Netherland
- 11.1.9 Nordics
- 11.1.10 Rest of Europe
- 12. Asia Pacific In Memory Database Industry Analysis, Insights and Forecast, 2019-2031
- 12.1. Market Analysis, Insights and Forecast - By Country/Sub-region
- 12.1.1 China
- 12.1.2 Japan
- 12.1.3 India
- 12.1.4 South Korea
- 12.1.5 Southeast Asia
- 12.1.6 Australia
- 12.1.7 Indonesia
- 12.1.8 Phillipes
- 12.1.9 Singapore
- 12.1.10 Thailandc
- 12.1.11 Rest of Asia Pacific
- 13. South America In Memory Database Industry Analysis, Insights and Forecast, 2019-2031
- 13.1. Market Analysis, Insights and Forecast - By Country/Sub-region
- 13.1.1 Brazil
- 13.1.2 Argentina
- 13.1.3 Peru
- 13.1.4 Chile
- 13.1.5 Colombia
- 13.1.6 Ecuador
- 13.1.7 Venezuela
- 13.1.8 Rest of South America
- 14. North America In Memory Database Industry Analysis, Insights and Forecast, 2019-2031
- 14.1. Market Analysis, Insights and Forecast - By Country/Sub-region
- 14.1.1 United States
- 14.1.2 Canada
- 14.1.3 Mexico
- 15. MEA In Memory Database Industry Analysis, Insights and Forecast, 2019-2031
- 15.1. Market Analysis, Insights and Forecast - By Country/Sub-region
- 15.1.1 United Arab Emirates
- 15.1.2 Saudi Arabia
- 15.1.3 South Africa
- 15.1.4 Rest of Middle East and Africa
- 16. Competitive Analysis
- 16.1. Global Market Share Analysis 2024
- 16.2. Company Profiles
- 16.2.1 VoltDB Inc
- 16.2.1.1. Overview
- 16.2.1.2. Products
- 16.2.1.3. SWOT Analysis
- 16.2.1.4. Recent Developments
- 16.2.1.5. Financials (Based on Availability)
- 16.2.2 Raima Inc
- 16.2.2.1. Overview
- 16.2.2.2. Products
- 16.2.2.3. SWOT Analysis
- 16.2.2.4. Recent Developments
- 16.2.2.5. Financials (Based on Availability)
- 16.2.3 TIBCO Software Inc
- 16.2.3.1. Overview
- 16.2.3.2. Products
- 16.2.3.3. SWOT Analysis
- 16.2.3.4. Recent Developments
- 16.2.3.5. Financials (Based on Availability)
- 16.2.4 IBM Corporation
- 16.2.4.1. Overview
- 16.2.4.2. Products
- 16.2.4.3. SWOT Analysis
- 16.2.4.4. Recent Developments
- 16.2.4.5. Financials (Based on Availability)
- 16.2.5 MemSQL Inc *List Not Exhaustive
- 16.2.5.1. Overview
- 16.2.5.2. Products
- 16.2.5.3. SWOT Analysis
- 16.2.5.4. Recent Developments
- 16.2.5.5. Financials (Based on Availability)
- 16.2.6 VMware Inc (Pivotal Software Inc )
- 16.2.6.1. Overview
- 16.2.6.2. Products
- 16.2.6.3. SWOT Analysis
- 16.2.6.4. Recent Developments
- 16.2.6.5. Financials (Based on Availability)
- 16.2.7 Redis Labs Inc
- 16.2.7.1. Overview
- 16.2.7.2. Products
- 16.2.7.3. SWOT Analysis
- 16.2.7.4. Recent Developments
- 16.2.7.5. Financials (Based on Availability)
- 16.2.8 DataStax Inc
- 16.2.8.1. Overview
- 16.2.8.2. Products
- 16.2.8.3. SWOT Analysis
- 16.2.8.4. Recent Developments
- 16.2.8.5. Financials (Based on Availability)
- 16.2.9 Aerospike Inc
- 16.2.9.1. Overview
- 16.2.9.2. Products
- 16.2.9.3. SWOT Analysis
- 16.2.9.4. Recent Developments
- 16.2.9.5. Financials (Based on Availability)
- 16.2.10 Microsoft Corporation
- 16.2.10.1. Overview
- 16.2.10.2. Products
- 16.2.10.3. SWOT Analysis
- 16.2.10.4. Recent Developments
- 16.2.10.5. Financials (Based on Availability)
- 16.2.11 McObject LLC
- 16.2.11.1. Overview
- 16.2.11.2. Products
- 16.2.11.3. SWOT Analysis
- 16.2.11.4. Recent Developments
- 16.2.11.5. Financials (Based on Availability)
- 16.2.12 Couchbase Inc
- 16.2.12.1. Overview
- 16.2.12.2. Products
- 16.2.12.3. SWOT Analysis
- 16.2.12.4. Recent Developments
- 16.2.12.5. Financials (Based on Availability)
- 16.2.13 Oracle Corporation
- 16.2.13.1. Overview
- 16.2.13.2. Products
- 16.2.13.3. SWOT Analysis
- 16.2.13.4. Recent Developments
- 16.2.13.5. Financials (Based on Availability)
- 16.2.14 GridGain Systems Inc
- 16.2.14.1. Overview
- 16.2.14.2. Products
- 16.2.14.3. SWOT Analysis
- 16.2.14.4. Recent Developments
- 16.2.14.5. Financials (Based on Availability)
- 16.2.15 Altibase Corp
- 16.2.15.1. Overview
- 16.2.15.2. Products
- 16.2.15.3. SWOT Analysis
- 16.2.15.4. Recent Developments
- 16.2.15.5. Financials (Based on Availability)
- 16.2.16 SAP SE
- 16.2.16.1. Overview
- 16.2.16.2. Products
- 16.2.16.3. SWOT Analysis
- 16.2.16.4. Recent Developments
- 16.2.16.5. Financials (Based on Availability)
- 16.2.1 VoltDB Inc
List of Figures
- Figure 1: Global In Memory Database Industry Revenue Breakdown (Million, %) by Region 2024 & 2032
- Figure 2: North America In Memory Database Industry Revenue (Million), by Country 2024 & 2032
- Figure 3: North America In Memory Database Industry Revenue Share (%), by Country 2024 & 2032
- Figure 4: Europe In Memory Database Industry Revenue (Million), by Country 2024 & 2032
- Figure 5: Europe In Memory Database Industry Revenue Share (%), by Country 2024 & 2032
- Figure 6: Asia Pacific In Memory Database Industry Revenue (Million), by Country 2024 & 2032
- Figure 7: Asia Pacific In Memory Database Industry Revenue Share (%), by Country 2024 & 2032
- Figure 8: South America In Memory Database Industry Revenue (Million), by Country 2024 & 2032
- Figure 9: South America In Memory Database Industry Revenue Share (%), by Country 2024 & 2032
- Figure 10: North America In Memory Database Industry Revenue (Million), by Country 2024 & 2032
- Figure 11: North America In Memory Database Industry Revenue Share (%), by Country 2024 & 2032
- Figure 12: MEA In Memory Database Industry Revenue (Million), by Country 2024 & 2032
- Figure 13: MEA In Memory Database Industry Revenue Share (%), by Country 2024 & 2032
- Figure 14: North America In Memory Database Industry Revenue (Million), by Industry Type 2024 & 2032
- Figure 15: North America In Memory Database Industry Revenue Share (%), by Industry Type 2024 & 2032
- Figure 16: North America In Memory Database Industry Revenue (Million), by End-user Industry 2024 & 2032
- Figure 17: North America In Memory Database Industry Revenue Share (%), by End-user Industry 2024 & 2032
- Figure 18: North America In Memory Database Industry Revenue (Million), by Country 2024 & 2032
- Figure 19: North America In Memory Database Industry Revenue Share (%), by Country 2024 & 2032
- Figure 20: Europe In Memory Database Industry Revenue (Million), by Industry Type 2024 & 2032
- Figure 21: Europe In Memory Database Industry Revenue Share (%), by Industry Type 2024 & 2032
- Figure 22: Europe In Memory Database Industry Revenue (Million), by End-user Industry 2024 & 2032
- Figure 23: Europe In Memory Database Industry Revenue Share (%), by End-user Industry 2024 & 2032
- Figure 24: Europe In Memory Database Industry Revenue (Million), by Country 2024 & 2032
- Figure 25: Europe In Memory Database Industry Revenue Share (%), by Country 2024 & 2032
- Figure 26: Asia Pacific In Memory Database Industry Revenue (Million), by Industry Type 2024 & 2032
- Figure 27: Asia Pacific In Memory Database Industry Revenue Share (%), by Industry Type 2024 & 2032
- Figure 28: Asia Pacific In Memory Database Industry Revenue (Million), by End-user Industry 2024 & 2032
- Figure 29: Asia Pacific In Memory Database Industry Revenue Share (%), by End-user Industry 2024 & 2032
- Figure 30: Asia Pacific In Memory Database Industry Revenue (Million), by Country 2024 & 2032
- Figure 31: Asia Pacific In Memory Database Industry Revenue Share (%), by Country 2024 & 2032
- Figure 32: Rest of the World In Memory Database Industry Revenue (Million), by Industry Type 2024 & 2032
- Figure 33: Rest of the World In Memory Database Industry Revenue Share (%), by Industry Type 2024 & 2032
- Figure 34: Rest of the World In Memory Database Industry Revenue (Million), by End-user Industry 2024 & 2032
- Figure 35: Rest of the World In Memory Database Industry Revenue Share (%), by End-user Industry 2024 & 2032
- Figure 36: Rest of the World In Memory Database Industry Revenue (Million), by Country 2024 & 2032
- Figure 37: Rest of the World In Memory Database Industry Revenue Share (%), by Country 2024 & 2032
List of Tables
- Table 1: Global In Memory Database Industry Revenue Million Forecast, by Region 2019 & 2032
- Table 2: Global In Memory Database Industry Revenue Million Forecast, by Industry Type 2019 & 2032
- Table 3: Global In Memory Database Industry Revenue Million Forecast, by End-user Industry 2019 & 2032
- Table 4: Global In Memory Database Industry Revenue Million Forecast, by Region 2019 & 2032
- Table 5: Global In Memory Database Industry Revenue Million Forecast, by Country 2019 & 2032
- Table 6: United States In Memory Database Industry Revenue (Million) Forecast, by Application 2019 & 2032
- Table 7: Canada In Memory Database Industry Revenue (Million) Forecast, by Application 2019 & 2032
- Table 8: Mexico In Memory Database Industry Revenue (Million) Forecast, by Application 2019 & 2032
- Table 9: Global In Memory Database Industry Revenue Million Forecast, by Country 2019 & 2032
- Table 10: Germany In Memory Database Industry Revenue (Million) Forecast, by Application 2019 & 2032
- Table 11: United Kingdom In Memory Database Industry Revenue (Million) Forecast, by Application 2019 & 2032
- Table 12: France In Memory Database Industry Revenue (Million) Forecast, by Application 2019 & 2032
- Table 13: Spain In Memory Database Industry Revenue (Million) Forecast, by Application 2019 & 2032
- Table 14: Italy In Memory Database Industry Revenue (Million) Forecast, by Application 2019 & 2032
- Table 15: Spain In Memory Database Industry Revenue (Million) Forecast, by Application 2019 & 2032
- Table 16: Belgium In Memory Database Industry Revenue (Million) Forecast, by Application 2019 & 2032
- Table 17: Netherland In Memory Database Industry Revenue (Million) Forecast, by Application 2019 & 2032
- Table 18: Nordics In Memory Database Industry Revenue (Million) Forecast, by Application 2019 & 2032
- Table 19: Rest of Europe In Memory Database Industry Revenue (Million) Forecast, by Application 2019 & 2032
- Table 20: Global In Memory Database Industry Revenue Million Forecast, by Country 2019 & 2032
- Table 21: China In Memory Database Industry Revenue (Million) Forecast, by Application 2019 & 2032
- Table 22: Japan In Memory Database Industry Revenue (Million) Forecast, by Application 2019 & 2032
- Table 23: India In Memory Database Industry Revenue (Million) Forecast, by Application 2019 & 2032
- Table 24: South Korea In Memory Database Industry Revenue (Million) Forecast, by Application 2019 & 2032
- Table 25: Southeast Asia In Memory Database Industry Revenue (Million) Forecast, by Application 2019 & 2032
- Table 26: Australia In Memory Database Industry Revenue (Million) Forecast, by Application 2019 & 2032
- Table 27: Indonesia In Memory Database Industry Revenue (Million) Forecast, by Application 2019 & 2032
- Table 28: Phillipes In Memory Database Industry Revenue (Million) Forecast, by Application 2019 & 2032
- Table 29: Singapore In Memory Database Industry Revenue (Million) Forecast, by Application 2019 & 2032
- Table 30: Thailandc In Memory Database Industry Revenue (Million) Forecast, by Application 2019 & 2032
- Table 31: Rest of Asia Pacific In Memory Database Industry Revenue (Million) Forecast, by Application 2019 & 2032
- Table 32: Global In Memory Database Industry Revenue Million Forecast, by Country 2019 & 2032
- Table 33: Brazil In Memory Database Industry Revenue (Million) Forecast, by Application 2019 & 2032
- Table 34: Argentina In Memory Database Industry Revenue (Million) Forecast, by Application 2019 & 2032
- Table 35: Peru In Memory Database Industry Revenue (Million) Forecast, by Application 2019 & 2032
- Table 36: Chile In Memory Database Industry Revenue (Million) Forecast, by Application 2019 & 2032
- Table 37: Colombia In Memory Database Industry Revenue (Million) Forecast, by Application 2019 & 2032
- Table 38: Ecuador In Memory Database Industry Revenue (Million) Forecast, by Application 2019 & 2032
- Table 39: Venezuela In Memory Database Industry Revenue (Million) Forecast, by Application 2019 & 2032
- Table 40: Rest of South America In Memory Database Industry Revenue (Million) Forecast, by Application 2019 & 2032
- Table 41: Global In Memory Database Industry Revenue Million Forecast, by Country 2019 & 2032
- Table 42: United States In Memory Database Industry Revenue (Million) Forecast, by Application 2019 & 2032
- Table 43: Canada In Memory Database Industry Revenue (Million) Forecast, by Application 2019 & 2032
- Table 44: Mexico In Memory Database Industry Revenue (Million) Forecast, by Application 2019 & 2032
- Table 45: Global In Memory Database Industry Revenue Million Forecast, by Country 2019 & 2032
- Table 46: United Arab Emirates In Memory Database Industry Revenue (Million) Forecast, by Application 2019 & 2032
- Table 47: Saudi Arabia In Memory Database Industry Revenue (Million) Forecast, by Application 2019 & 2032
- Table 48: South Africa In Memory Database Industry Revenue (Million) Forecast, by Application 2019 & 2032
- Table 49: Rest of Middle East and Africa In Memory Database Industry Revenue (Million) Forecast, by Application 2019 & 2032
- Table 50: Global In Memory Database Industry Revenue Million Forecast, by Industry Type 2019 & 2032
- Table 51: Global In Memory Database Industry Revenue Million Forecast, by End-user Industry 2019 & 2032
- Table 52: Global In Memory Database Industry Revenue Million Forecast, by Country 2019 & 2032
- Table 53: United States In Memory Database Industry Revenue (Million) Forecast, by Application 2019 & 2032
- Table 54: Canada In Memory Database Industry Revenue (Million) Forecast, by Application 2019 & 2032
- Table 55: Global In Memory Database Industry Revenue Million Forecast, by Industry Type 2019 & 2032
- Table 56: Global In Memory Database Industry Revenue Million Forecast, by End-user Industry 2019 & 2032
- Table 57: Global In Memory Database Industry Revenue Million Forecast, by Country 2019 & 2032
- Table 58: United Kingdom In Memory Database Industry Revenue (Million) Forecast, by Application 2019 & 2032
- Table 59: Germany In Memory Database Industry Revenue (Million) Forecast, by Application 2019 & 2032
- Table 60: France In Memory Database Industry Revenue (Million) Forecast, by Application 2019 & 2032
- Table 61: Rest of Europe In Memory Database Industry Revenue (Million) Forecast, by Application 2019 & 2032
- Table 62: Global In Memory Database Industry Revenue Million Forecast, by Industry Type 2019 & 2032
- Table 63: Global In Memory Database Industry Revenue Million Forecast, by End-user Industry 2019 & 2032
- Table 64: Global In Memory Database Industry Revenue Million Forecast, by Country 2019 & 2032
- Table 65: China In Memory Database Industry Revenue (Million) Forecast, by Application 2019 & 2032
- Table 66: Japan In Memory Database Industry Revenue (Million) Forecast, by Application 2019 & 2032
- Table 67: India In Memory Database Industry Revenue (Million) Forecast, by Application 2019 & 2032
- Table 68: Rest of Asia Pacific In Memory Database Industry Revenue (Million) Forecast, by Application 2019 & 2032
- Table 69: Global In Memory Database Industry Revenue Million Forecast, by Industry Type 2019 & 2032
- Table 70: Global In Memory Database Industry Revenue Million Forecast, by End-user Industry 2019 & 2032
- Table 71: Global In Memory Database Industry Revenue Million Forecast, by Country 2019 & 2032
Frequently Asked Questions
1. What is the projected Compound Annual Growth Rate (CAGR) of the In Memory Database Industry?
The projected CAGR is approximately 19.00%.
2. Which companies are prominent players in the In Memory Database Industry?
Key companies in the market include VoltDB Inc, Raima Inc, TIBCO Software Inc, IBM Corporation, MemSQL Inc *List Not Exhaustive, VMware Inc (Pivotal Software Inc ), Redis Labs Inc, DataStax Inc, Aerospike Inc, Microsoft Corporation, McObject LLC, Couchbase Inc, Oracle Corporation, GridGain Systems Inc, Altibase Corp, SAP SE.
3. What are the main segments of the In Memory Database Industry?
The market segments include Industry Type, End-user Industry.
4. Can you provide details about the market size?
The market size is estimated to be USD XX Million as of 2022.
5. What are some drivers contributing to market growth?
Decreasing Hardware Cost; Increasing Penetration Of Trends Like Big Data And IOT; Increase In The Volume Of Data Generated And Shift Of Enterprise Operations.
6. What are the notable trends driving market growth?
Telecommunication End-User Industry to Hold Significant Market Share.
7. Are there any restraints impacting market growth?
Resilience In Integration With VLDB'S.
8. Can you provide examples of recent developments in the market?
May 2022: IBM and SAP announced the extension of their collaboration as IBM embarks on a corporate transformation initiative to optimize its business operations using RISE and SAP S/4HANA Cloud. To execute work for over 1,000 legal entities in more than 120 countries and multiple IBM companies supporting hardware, software, consulting, and finance, IBM said it is transferring to SAP S/4HANA, SAP's most recent ERP system, as part of the extended relationship. The replacement for SAP R/3 and SAP ERP, SAP S/4HANA, is SAP's ERP system for large businesses. It is intended to work optimally with SAP's in-memory database, SAP HANA.
9. What pricing options are available for accessing the report?
Pricing options include single-user, multi-user, and enterprise licenses priced at USD 4750, USD 5250, and USD 8750 respectively.
10. Is the market size provided in terms of value or volume?
The market size is provided in terms of value, measured in Million.
11. Are there any specific market keywords associated with the report?
Yes, the market keyword associated with the report is "In Memory Database Industry," which aids in identifying and referencing the specific market segment covered.
12. How do I determine which pricing option suits my needs best?
The pricing options vary based on user requirements and access needs. Individual users may opt for single-user licenses, while businesses requiring broader access may choose multi-user or enterprise licenses for cost-effective access to the report.
13. Are there any additional resources or data provided in the In Memory Database Industry report?
While the report offers comprehensive insights, it's advisable to review the specific contents or supplementary materials provided to ascertain if additional resources or data are available.
14. How can I stay updated on further developments or reports in the In Memory Database Industry?
To stay informed about further developments, trends, and reports in the In Memory Database Industry, consider subscribing to industry newsletters, following relevant companies and organizations, or regularly checking reputable industry news sources and publications.
Methodology
Step 1 - Identification of Relevant Samples Size from Population Database


Step 2 - Approaches for Defining Global Market Size (Value, Volume* & Price*)

Note*: In applicable scenarios
Step 3 - Data Sources
Primary Research
- Web Analytics
- Survey Reports
- Research Institute
- Latest Research Reports
- Opinion Leaders
Secondary Research
- Annual Reports
- White Paper
- Latest Press Release
- Industry Association
- Paid Database
- Investor Presentations

Step 4 - Data Triangulation
Involves using different sources of information in order to increase the validity of a study
These sources are likely to be stakeholders in a program - participants, other researchers, program staff, other community members, and so on.
Then we put all data in single framework & apply various statistical tools to find out the dynamic on the market.
During the analysis stage, feedback from the stakeholder groups would be compared to determine areas of agreement as well as areas of divergence
