

Key Insights
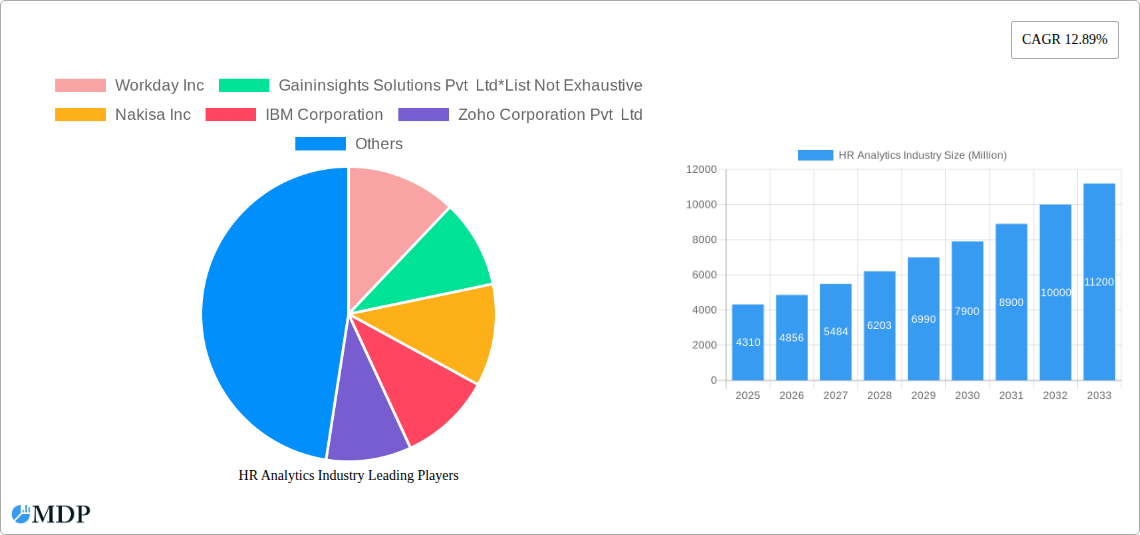
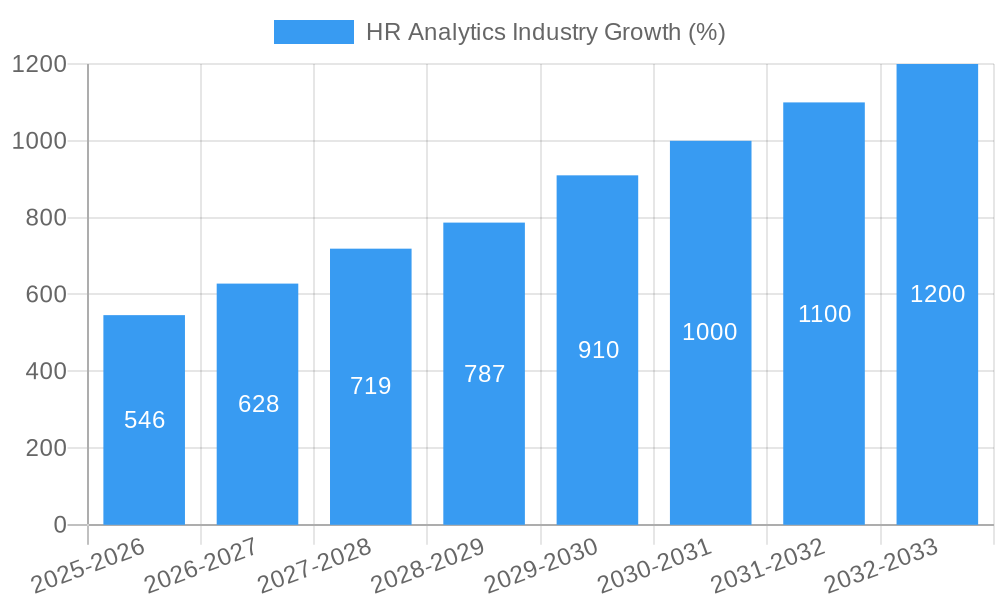
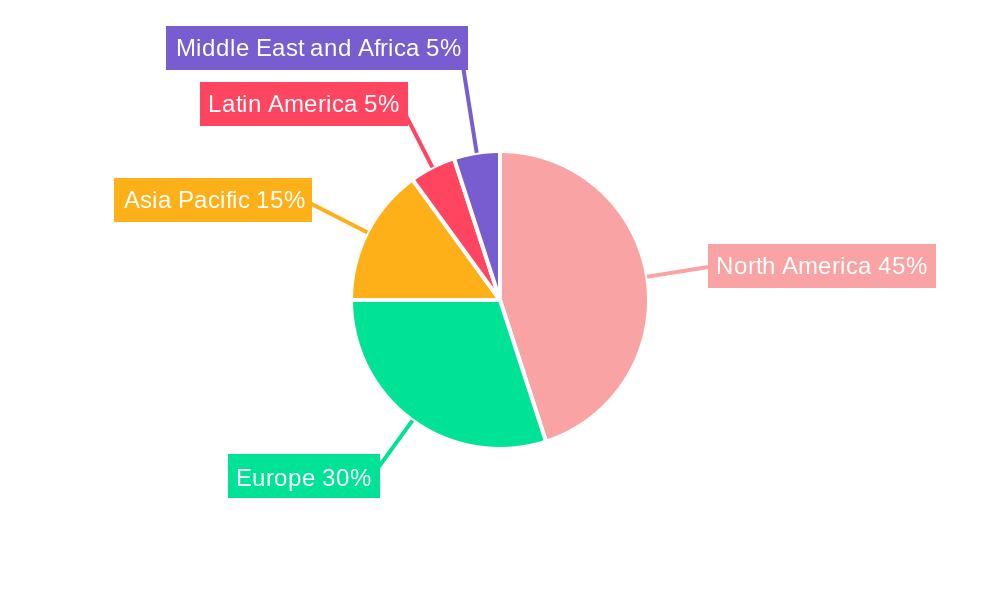
The HR analytics market, valued at $4.31 billion in 2025, is experiencing robust growth, projected to expand at a compound annual growth rate (CAGR) of 12.89% from 2025 to 2033. This expansion is fueled by several key factors. The increasing adoption of cloud-based HR solutions offers scalability, cost-effectiveness, and improved data accessibility, driving market growth. Furthermore, the rising need for data-driven decision-making in HR functions, coupled with the availability of sophisticated analytics tools capable of providing actionable insights into employee performance, recruitment effectiveness, and talent management, are significant drivers. Organizations are increasingly leveraging HR analytics to optimize workforce planning, enhance employee engagement, reduce employee turnover, and improve overall business outcomes. The market is segmented by component (solutions and services), deployment mode (on-premise and cloud), and end-user industry (telecom and IT, BFSI, consumer goods and retail, healthcare, manufacturing, and others). The cloud-based segment is expected to dominate due to its inherent advantages. North America currently holds a significant market share, driven by early adoption and technological advancements, but the Asia-Pacific region is projected to witness substantial growth in the coming years due to increasing digitalization and a growing focus on optimizing HR processes within burgeoning economies. Competition is intense, with established players like IBM, Oracle, and SAP alongside specialized HR analytics providers like Workday and Gainsights vying for market share. The market's future trajectory is promising, driven by continuous technological innovation and a growing understanding of the strategic value of data-driven HR management.
The competitive landscape is dynamic, with a mix of established enterprise software vendors and specialized HR analytics firms. While North America currently leads in market adoption, the Asia-Pacific region presents significant growth potential due to its expanding digital economy and increasing focus on HR optimization. Future growth will depend on the continued development of sophisticated analytics capabilities, the integration of HR analytics with other business intelligence tools, and the increasing demand for real-time insights to support agile HR strategies. The ongoing focus on enhancing employee experience and addressing workforce challenges will further propel the demand for advanced HR analytics solutions. The maturation of AI and machine learning in HR processes is poised to further accelerate market growth in the coming years, enabling more predictive and proactive HR strategies.
HR Analytics Industry: A Comprehensive Market Report (2019-2033)
This comprehensive report provides a detailed analysis of the HR Analytics industry, projecting a market size exceeding $XX Million by 2033. Leveraging a robust methodology incorporating historical data (2019-2024), a base year of 2025, and a forecast period extending to 2033, this report offers invaluable insights for stakeholders seeking to navigate this rapidly evolving landscape. The report encompasses market sizing, segmentation, competitive analysis, and future growth projections, making it an essential resource for strategic decision-making. Key players such as Workday Inc, Gaininsights Solutions Pvt Ltd, Nakisa Inc, IBM Corporation, Zoho Corporation Pvt Ltd, Tableau Software Inc, Oracle Corporation, Kronos Inc, and SAP SE are analyzed in detail.
HR Analytics Industry Market Dynamics & Concentration
The HR Analytics market exhibits a moderately consolidated structure, with key players holding significant market share. Market concentration is driven by factors such as high barriers to entry (requiring significant technological expertise and data infrastructure), economies of scale, and brand recognition. Innovation is a crucial driver, with continuous advancements in AI, machine learning, and big data analytics pushing the boundaries of HR data analysis. Regulatory frameworks, particularly around data privacy (GDPR, CCPA), significantly impact market dynamics, shaping data governance practices and compliance requirements. Product substitutes, such as traditional HR reporting methods, pose limited competition due to the enhanced insights and efficiency offered by HR analytics solutions.
End-user trends favor cloud-based solutions due to scalability, cost-effectiveness, and accessibility. Mergers and acquisitions (M&A) are prevalent, with xx M&A deals recorded between 2019 and 2024, indicating strategic consolidation and expansion within the industry. Key players are actively pursuing M&A to expand their product portfolios, customer base, and technological capabilities. For example, the market share of Workday Inc is estimated to be xx% in 2025, while SAP SE holds approximately xx%.
HR Analytics Industry Industry Trends & Analysis
The HR Analytics market is experiencing robust growth, driven by the increasing adoption of data-driven decision-making in HR functions. Technological disruptions, primarily driven by AI and machine learning, are significantly transforming the industry, enabling predictive analytics, automated processes, and personalized employee experiences. Consumer preferences are shifting towards user-friendly, integrated, and cloud-based solutions that offer real-time insights and actionable recommendations. Competitive dynamics are intense, with established players and new entrants vying for market share through product innovation, strategic partnerships, and aggressive pricing strategies. The Compound Annual Growth Rate (CAGR) is projected at xx% during the forecast period (2025-2033), with market penetration expected to reach xx% by 2033.
Leading Markets & Segments in HR Analytics Industry
The North American region currently dominates the HR Analytics market, fueled by advanced technological infrastructure, high adoption rates among large enterprises, and a strong focus on data-driven HR practices. Within segments, the Cloud deployment mode holds a significant majority, driven by scalability, cost-effectiveness, and accessibility. The Solutions segment is larger than the Services segment, owing to the high demand for comprehensive HR analytics platforms. The BFSI and Telecom & IT end-user industries show the highest adoption rates.
Key Drivers for North American Dominance:
- Mature technological infrastructure
- High adoption of cloud-based solutions
- Strong regulatory frameworks supporting data-driven decision making
- High concentration of multinational corporations
Dominant Segments:
- By Component: Solutions (xx% market share in 2025)
- By Deployment Mode: Cloud (xx% market share in 2025)
- By End-User Industry: BFSI (xx% market share in 2025), Telecom & IT (xx% market share in 2025)
HR Analytics Industry Product Developments
Recent product innovations focus on integrating AI-powered features, improving user experience, and enhancing data visualization capabilities. These advancements enable more accurate predictive modeling, automated insights generation, and streamlined decision-making processes. Companies are focusing on creating integrated platforms that can handle various HR functions, such as recruitment, performance management, and compensation, providing a holistic view of the workforce. This approach offers a competitive advantage by providing a comprehensive solution catering to a wide array of client needs.
Key Drivers of HR Analytics Industry Growth
The primary growth drivers include the increasing demand for data-driven insights in HR, the growing adoption of cloud-based HR solutions, advancements in AI and machine learning, and the rising need for improved workforce productivity and employee engagement. Government regulations promoting data privacy also drive demand for compliant HR analytics solutions.
Challenges in the HR Analytics Industry Market
The industry faces challenges such as high implementation costs, data security and privacy concerns, the need for skilled professionals to interpret data, and integration complexities with legacy HR systems. These hurdles can result in delayed implementation or adoption, hindering market growth. The competitive landscape also presents challenges, with established players and new entrants vying for market share, leading to price pressures.
Emerging Opportunities in HR Analytics Industry
The integration of AI and machine learning will unlock numerous opportunities, enabling predictive analytics for talent management, talent acquisition, and workforce planning. Strategic partnerships between HR technology providers and consulting firms will broaden market reach and enhance service offerings. Expansion into emerging markets, especially in Asia-Pacific, will drive significant growth.
Leading Players in the HR Analytics Industry Sector
- Workday Inc
- Gaininsights Solutions Pvt Ltd
- Nakisa Inc
- IBM Corporation
- Zoho Corporation Pvt Ltd
- Tableau Software Inc
- Oracle Corporation
- Kronos Inc
- SAP SE
Key Milestones in HR Analytics Industry Industry
- June 2022: GainInsights partnered with DataSwitch to accelerate analytics modernization. This collaboration signifies the growing importance of AI/ML-driven data transformation platforms in the HR analytics space.
- May 2022: Visier's strategic agreement with Deloitte highlights the increasing demand for consulting services to support HR analytics implementation and adoption. This collaboration demonstrates the value of combining technology with expert guidance.
Strategic Outlook for HR Analytics Industry Market
The HR Analytics market holds immense potential, driven by technological advancements and the growing need for data-driven HR practices. Strategic opportunities include focusing on niche market segments, developing innovative solutions, and forging strategic partnerships. Continued investments in R&D, coupled with a customer-centric approach, will be key to success in this dynamic market.
HR Analytics Industry Segmentation
-
1. Component
- 1.1. Solutions
- 1.2. Services
-
2. Deployment Mode
- 2.1. On-Premise
- 2.2. Cloud
-
3. End-User Industry
- 3.1. Telecom and IT
- 3.2. BFSI
- 3.3. Consumer Goods and Retail
- 3.4. Healthcare
- 3.5. Manufacturing
- 3.6. Other End-user Industries
HR Analytics Industry Segmentation By Geography
-
1. North America
- 1.1. United States
- 1.2. Canada
-
2. Europe
- 2.1. Germany
- 2.2. United Kingdom
- 2.3. France
- 2.4. Rest of Europe
-
3. Asia Pacific
- 3.1. India
- 3.2. China
- 3.3. Japan
- 3.4. Rest of Asia Pacific
-
4. Latin America
- 4.1. Brazil
- 4.2. Argentina
- 4.3. Rest of Latin America
-
5. Middle East and Africa
- 5.1. United Arab Emirates
- 5.2. Saudi Arabia
- 5.3. Rest of Middle East and Africa
HR Analytics Industry REPORT HIGHLIGHTS
| Aspects | Details |
|---|---|
| Study Period | 2019-2033 |
| Base Year | 2024 |
| Estimated Year | 2025 |
| Forecast Period | 2025-2033 |
| Historical Period | 2019-2024 |
| Growth Rate | CAGR of 12.89% from 2019-2033 |
| Segmentation |
|
Table of Contents
- 1. Introduction
- 1.1. Research Scope
- 1.2. Market Segmentation
- 1.3. Research Methodology
- 1.4. Definitions and Assumptions
- 2. Executive Summary
- 2.1. Introduction
- 3. Market Dynamics
- 3.1. Introduction
- 3.2. Market Drivers
- 3.2.1. Increase in Trends in Cloud-based Solutions; Increase in Workforce and Need for Reduction in Attrition Rate
- 3.3. Market Restrains
- 3.3.1. 7.1 Increasing Security and Privacy Concerns
- 3.4. Market Trends
- 3.4.1. Telecom and IT Industry is Witnessing a Significant Share in the Market
- 4. Market Factor Analysis
- 4.1. Porters Five Forces
- 4.2. Supply/Value Chain
- 4.3. PESTEL analysis
- 4.4. Market Entropy
- 4.5. Patent/Trademark Analysis
- 5. Global HR Analytics Industry Analysis, Insights and Forecast, 2019-2031
- 5.1. Market Analysis, Insights and Forecast - by Component
- 5.1.1. Solutions
- 5.1.2. Services
- 5.2. Market Analysis, Insights and Forecast - by Deployment Mode
- 5.2.1. On-Premise
- 5.2.2. Cloud
- 5.3. Market Analysis, Insights and Forecast - by End-User Industry
- 5.3.1. Telecom and IT
- 5.3.2. BFSI
- 5.3.3. Consumer Goods and Retail
- 5.3.4. Healthcare
- 5.3.5. Manufacturing
- 5.3.6. Other End-user Industries
- 5.4. Market Analysis, Insights and Forecast - by Region
- 5.4.1. North America
- 5.4.2. Europe
- 5.4.3. Asia Pacific
- 5.4.4. Latin America
- 5.4.5. Middle East and Africa
- 5.1. Market Analysis, Insights and Forecast - by Component
- 6. North America HR Analytics Industry Analysis, Insights and Forecast, 2019-2031
- 6.1. Market Analysis, Insights and Forecast - by Component
- 6.1.1. Solutions
- 6.1.2. Services
- 6.2. Market Analysis, Insights and Forecast - by Deployment Mode
- 6.2.1. On-Premise
- 6.2.2. Cloud
- 6.3. Market Analysis, Insights and Forecast - by End-User Industry
- 6.3.1. Telecom and IT
- 6.3.2. BFSI
- 6.3.3. Consumer Goods and Retail
- 6.3.4. Healthcare
- 6.3.5. Manufacturing
- 6.3.6. Other End-user Industries
- 6.1. Market Analysis, Insights and Forecast - by Component
- 7. Europe HR Analytics Industry Analysis, Insights and Forecast, 2019-2031
- 7.1. Market Analysis, Insights and Forecast - by Component
- 7.1.1. Solutions
- 7.1.2. Services
- 7.2. Market Analysis, Insights and Forecast - by Deployment Mode
- 7.2.1. On-Premise
- 7.2.2. Cloud
- 7.3. Market Analysis, Insights and Forecast - by End-User Industry
- 7.3.1. Telecom and IT
- 7.3.2. BFSI
- 7.3.3. Consumer Goods and Retail
- 7.3.4. Healthcare
- 7.3.5. Manufacturing
- 7.3.6. Other End-user Industries
- 7.1. Market Analysis, Insights and Forecast - by Component
- 8. Asia Pacific HR Analytics Industry Analysis, Insights and Forecast, 2019-2031
- 8.1. Market Analysis, Insights and Forecast - by Component
- 8.1.1. Solutions
- 8.1.2. Services
- 8.2. Market Analysis, Insights and Forecast - by Deployment Mode
- 8.2.1. On-Premise
- 8.2.2. Cloud
- 8.3. Market Analysis, Insights and Forecast - by End-User Industry
- 8.3.1. Telecom and IT
- 8.3.2. BFSI
- 8.3.3. Consumer Goods and Retail
- 8.3.4. Healthcare
- 8.3.5. Manufacturing
- 8.3.6. Other End-user Industries
- 8.1. Market Analysis, Insights and Forecast - by Component
- 9. Latin America HR Analytics Industry Analysis, Insights and Forecast, 2019-2031
- 9.1. Market Analysis, Insights and Forecast - by Component
- 9.1.1. Solutions
- 9.1.2. Services
- 9.2. Market Analysis, Insights and Forecast - by Deployment Mode
- 9.2.1. On-Premise
- 9.2.2. Cloud
- 9.3. Market Analysis, Insights and Forecast - by End-User Industry
- 9.3.1. Telecom and IT
- 9.3.2. BFSI
- 9.3.3. Consumer Goods and Retail
- 9.3.4. Healthcare
- 9.3.5. Manufacturing
- 9.3.6. Other End-user Industries
- 9.1. Market Analysis, Insights and Forecast - by Component
- 10. Middle East and Africa HR Analytics Industry Analysis, Insights and Forecast, 2019-2031
- 10.1. Market Analysis, Insights and Forecast - by Component
- 10.1.1. Solutions
- 10.1.2. Services
- 10.2. Market Analysis, Insights and Forecast - by Deployment Mode
- 10.2.1. On-Premise
- 10.2.2. Cloud
- 10.3. Market Analysis, Insights and Forecast - by End-User Industry
- 10.3.1. Telecom and IT
- 10.3.2. BFSI
- 10.3.3. Consumer Goods and Retail
- 10.3.4. Healthcare
- 10.3.5. Manufacturing
- 10.3.6. Other End-user Industries
- 10.1. Market Analysis, Insights and Forecast - by Component
- 11. North America HR Analytics Industry Analysis, Insights and Forecast, 2019-2031
- 11.1. Market Analysis, Insights and Forecast - By Country/Sub-region
- 11.1.1 United States
- 11.1.2 Canada
- 12. Europe HR Analytics Industry Analysis, Insights and Forecast, 2019-2031
- 12.1. Market Analysis, Insights and Forecast - By Country/Sub-region
- 12.1.1 Germany
- 12.1.2 United Kingdom
- 12.1.3 France
- 12.1.4 Rest of Europe
- 13. Asia Pacific HR Analytics Industry Analysis, Insights and Forecast, 2019-2031
- 13.1. Market Analysis, Insights and Forecast - By Country/Sub-region
- 13.1.1 India
- 13.1.2 China
- 13.1.3 Japan
- 13.1.4 Rest of Asia Pacific
- 14. Latin America HR Analytics Industry Analysis, Insights and Forecast, 2019-2031
- 14.1. Market Analysis, Insights and Forecast - By Country/Sub-region
- 14.1.1 Brazil
- 14.1.2 Argentina
- 14.1.3 Rest of Latin America
- 15. Middle East and Africa HR Analytics Industry Analysis, Insights and Forecast, 2019-2031
- 15.1. Market Analysis, Insights and Forecast - By Country/Sub-region
- 15.1.1 United Arab Emirates
- 15.1.2 Saudi Arabia
- 15.1.3 Rest of Middle East and Africa
- 16. Competitive Analysis
- 16.1. Global Market Share Analysis 2024
- 16.2. Company Profiles
- 16.2.1 Workday Inc
- 16.2.1.1. Overview
- 16.2.1.2. Products
- 16.2.1.3. SWOT Analysis
- 16.2.1.4. Recent Developments
- 16.2.1.5. Financials (Based on Availability)
- 16.2.2 Gaininsights Solutions Pvt Ltd*List Not Exhaustive
- 16.2.2.1. Overview
- 16.2.2.2. Products
- 16.2.2.3. SWOT Analysis
- 16.2.2.4. Recent Developments
- 16.2.2.5. Financials (Based on Availability)
- 16.2.3 Nakisa Inc
- 16.2.3.1. Overview
- 16.2.3.2. Products
- 16.2.3.3. SWOT Analysis
- 16.2.3.4. Recent Developments
- 16.2.3.5. Financials (Based on Availability)
- 16.2.4 IBM Corporation
- 16.2.4.1. Overview
- 16.2.4.2. Products
- 16.2.4.3. SWOT Analysis
- 16.2.4.4. Recent Developments
- 16.2.4.5. Financials (Based on Availability)
- 16.2.5 Zoho Corporation Pvt Ltd
- 16.2.5.1. Overview
- 16.2.5.2. Products
- 16.2.5.3. SWOT Analysis
- 16.2.5.4. Recent Developments
- 16.2.5.5. Financials (Based on Availability)
- 16.2.6 Tableau Software Inc
- 16.2.6.1. Overview
- 16.2.6.2. Products
- 16.2.6.3. SWOT Analysis
- 16.2.6.4. Recent Developments
- 16.2.6.5. Financials (Based on Availability)
- 16.2.7 Oracle Corporation
- 16.2.7.1. Overview
- 16.2.7.2. Products
- 16.2.7.3. SWOT Analysis
- 16.2.7.4. Recent Developments
- 16.2.7.5. Financials (Based on Availability)
- 16.2.8 Kronos Inc
- 16.2.8.1. Overview
- 16.2.8.2. Products
- 16.2.8.3. SWOT Analysis
- 16.2.8.4. Recent Developments
- 16.2.8.5. Financials (Based on Availability)
- 16.2.9 SAP SE
- 16.2.9.1. Overview
- 16.2.9.2. Products
- 16.2.9.3. SWOT Analysis
- 16.2.9.4. Recent Developments
- 16.2.9.5. Financials (Based on Availability)
- 16.2.1 Workday Inc
List of Figures
- Figure 1: Global HR Analytics Industry Revenue Breakdown (Million, %) by Region 2024 & 2032
- Figure 2: North America HR Analytics Industry Revenue (Million), by Country 2024 & 2032
- Figure 3: North America HR Analytics Industry Revenue Share (%), by Country 2024 & 2032
- Figure 4: Europe HR Analytics Industry Revenue (Million), by Country 2024 & 2032
- Figure 5: Europe HR Analytics Industry Revenue Share (%), by Country 2024 & 2032
- Figure 6: Asia Pacific HR Analytics Industry Revenue (Million), by Country 2024 & 2032
- Figure 7: Asia Pacific HR Analytics Industry Revenue Share (%), by Country 2024 & 2032
- Figure 8: Latin America HR Analytics Industry Revenue (Million), by Country 2024 & 2032
- Figure 9: Latin America HR Analytics Industry Revenue Share (%), by Country 2024 & 2032
- Figure 10: Middle East and Africa HR Analytics Industry Revenue (Million), by Country 2024 & 2032
- Figure 11: Middle East and Africa HR Analytics Industry Revenue Share (%), by Country 2024 & 2032
- Figure 12: North America HR Analytics Industry Revenue (Million), by Component 2024 & 2032
- Figure 13: North America HR Analytics Industry Revenue Share (%), by Component 2024 & 2032
- Figure 14: North America HR Analytics Industry Revenue (Million), by Deployment Mode 2024 & 2032
- Figure 15: North America HR Analytics Industry Revenue Share (%), by Deployment Mode 2024 & 2032
- Figure 16: North America HR Analytics Industry Revenue (Million), by End-User Industry 2024 & 2032
- Figure 17: North America HR Analytics Industry Revenue Share (%), by End-User Industry 2024 & 2032
- Figure 18: North America HR Analytics Industry Revenue (Million), by Country 2024 & 2032
- Figure 19: North America HR Analytics Industry Revenue Share (%), by Country 2024 & 2032
- Figure 20: Europe HR Analytics Industry Revenue (Million), by Component 2024 & 2032
- Figure 21: Europe HR Analytics Industry Revenue Share (%), by Component 2024 & 2032
- Figure 22: Europe HR Analytics Industry Revenue (Million), by Deployment Mode 2024 & 2032
- Figure 23: Europe HR Analytics Industry Revenue Share (%), by Deployment Mode 2024 & 2032
- Figure 24: Europe HR Analytics Industry Revenue (Million), by End-User Industry 2024 & 2032
- Figure 25: Europe HR Analytics Industry Revenue Share (%), by End-User Industry 2024 & 2032
- Figure 26: Europe HR Analytics Industry Revenue (Million), by Country 2024 & 2032
- Figure 27: Europe HR Analytics Industry Revenue Share (%), by Country 2024 & 2032
- Figure 28: Asia Pacific HR Analytics Industry Revenue (Million), by Component 2024 & 2032
- Figure 29: Asia Pacific HR Analytics Industry Revenue Share (%), by Component 2024 & 2032
- Figure 30: Asia Pacific HR Analytics Industry Revenue (Million), by Deployment Mode 2024 & 2032
- Figure 31: Asia Pacific HR Analytics Industry Revenue Share (%), by Deployment Mode 2024 & 2032
- Figure 32: Asia Pacific HR Analytics Industry Revenue (Million), by End-User Industry 2024 & 2032
- Figure 33: Asia Pacific HR Analytics Industry Revenue Share (%), by End-User Industry 2024 & 2032
- Figure 34: Asia Pacific HR Analytics Industry Revenue (Million), by Country 2024 & 2032
- Figure 35: Asia Pacific HR Analytics Industry Revenue Share (%), by Country 2024 & 2032
- Figure 36: Latin America HR Analytics Industry Revenue (Million), by Component 2024 & 2032
- Figure 37: Latin America HR Analytics Industry Revenue Share (%), by Component 2024 & 2032
- Figure 38: Latin America HR Analytics Industry Revenue (Million), by Deployment Mode 2024 & 2032
- Figure 39: Latin America HR Analytics Industry Revenue Share (%), by Deployment Mode 2024 & 2032
- Figure 40: Latin America HR Analytics Industry Revenue (Million), by End-User Industry 2024 & 2032
- Figure 41: Latin America HR Analytics Industry Revenue Share (%), by End-User Industry 2024 & 2032
- Figure 42: Latin America HR Analytics Industry Revenue (Million), by Country 2024 & 2032
- Figure 43: Latin America HR Analytics Industry Revenue Share (%), by Country 2024 & 2032
- Figure 44: Middle East and Africa HR Analytics Industry Revenue (Million), by Component 2024 & 2032
- Figure 45: Middle East and Africa HR Analytics Industry Revenue Share (%), by Component 2024 & 2032
- Figure 46: Middle East and Africa HR Analytics Industry Revenue (Million), by Deployment Mode 2024 & 2032
- Figure 47: Middle East and Africa HR Analytics Industry Revenue Share (%), by Deployment Mode 2024 & 2032
- Figure 48: Middle East and Africa HR Analytics Industry Revenue (Million), by End-User Industry 2024 & 2032
- Figure 49: Middle East and Africa HR Analytics Industry Revenue Share (%), by End-User Industry 2024 & 2032
- Figure 50: Middle East and Africa HR Analytics Industry Revenue (Million), by Country 2024 & 2032
- Figure 51: Middle East and Africa HR Analytics Industry Revenue Share (%), by Country 2024 & 2032
List of Tables
- Table 1: Global HR Analytics Industry Revenue Million Forecast, by Region 2019 & 2032
- Table 2: Global HR Analytics Industry Revenue Million Forecast, by Component 2019 & 2032
- Table 3: Global HR Analytics Industry Revenue Million Forecast, by Deployment Mode 2019 & 2032
- Table 4: Global HR Analytics Industry Revenue Million Forecast, by End-User Industry 2019 & 2032
- Table 5: Global HR Analytics Industry Revenue Million Forecast, by Region 2019 & 2032
- Table 6: Global HR Analytics Industry Revenue Million Forecast, by Country 2019 & 2032
- Table 7: United States HR Analytics Industry Revenue (Million) Forecast, by Application 2019 & 2032
- Table 8: Canada HR Analytics Industry Revenue (Million) Forecast, by Application 2019 & 2032
- Table 9: Global HR Analytics Industry Revenue Million Forecast, by Country 2019 & 2032
- Table 10: Germany HR Analytics Industry Revenue (Million) Forecast, by Application 2019 & 2032
- Table 11: United Kingdom HR Analytics Industry Revenue (Million) Forecast, by Application 2019 & 2032
- Table 12: France HR Analytics Industry Revenue (Million) Forecast, by Application 2019 & 2032
- Table 13: Rest of Europe HR Analytics Industry Revenue (Million) Forecast, by Application 2019 & 2032
- Table 14: Global HR Analytics Industry Revenue Million Forecast, by Country 2019 & 2032
- Table 15: India HR Analytics Industry Revenue (Million) Forecast, by Application 2019 & 2032
- Table 16: China HR Analytics Industry Revenue (Million) Forecast, by Application 2019 & 2032
- Table 17: Japan HR Analytics Industry Revenue (Million) Forecast, by Application 2019 & 2032
- Table 18: Rest of Asia Pacific HR Analytics Industry Revenue (Million) Forecast, by Application 2019 & 2032
- Table 19: Global HR Analytics Industry Revenue Million Forecast, by Country 2019 & 2032
- Table 20: Brazil HR Analytics Industry Revenue (Million) Forecast, by Application 2019 & 2032
- Table 21: Argentina HR Analytics Industry Revenue (Million) Forecast, by Application 2019 & 2032
- Table 22: Rest of Latin America HR Analytics Industry Revenue (Million) Forecast, by Application 2019 & 2032
- Table 23: Global HR Analytics Industry Revenue Million Forecast, by Country 2019 & 2032
- Table 24: United Arab Emirates HR Analytics Industry Revenue (Million) Forecast, by Application 2019 & 2032
- Table 25: Saudi Arabia HR Analytics Industry Revenue (Million) Forecast, by Application 2019 & 2032
- Table 26: Rest of Middle East and Africa HR Analytics Industry Revenue (Million) Forecast, by Application 2019 & 2032
- Table 27: Global HR Analytics Industry Revenue Million Forecast, by Component 2019 & 2032
- Table 28: Global HR Analytics Industry Revenue Million Forecast, by Deployment Mode 2019 & 2032
- Table 29: Global HR Analytics Industry Revenue Million Forecast, by End-User Industry 2019 & 2032
- Table 30: Global HR Analytics Industry Revenue Million Forecast, by Country 2019 & 2032
- Table 31: United States HR Analytics Industry Revenue (Million) Forecast, by Application 2019 & 2032
- Table 32: Canada HR Analytics Industry Revenue (Million) Forecast, by Application 2019 & 2032
- Table 33: Global HR Analytics Industry Revenue Million Forecast, by Component 2019 & 2032
- Table 34: Global HR Analytics Industry Revenue Million Forecast, by Deployment Mode 2019 & 2032
- Table 35: Global HR Analytics Industry Revenue Million Forecast, by End-User Industry 2019 & 2032
- Table 36: Global HR Analytics Industry Revenue Million Forecast, by Country 2019 & 2032
- Table 37: Germany HR Analytics Industry Revenue (Million) Forecast, by Application 2019 & 2032
- Table 38: United Kingdom HR Analytics Industry Revenue (Million) Forecast, by Application 2019 & 2032
- Table 39: France HR Analytics Industry Revenue (Million) Forecast, by Application 2019 & 2032
- Table 40: Rest of Europe HR Analytics Industry Revenue (Million) Forecast, by Application 2019 & 2032
- Table 41: Global HR Analytics Industry Revenue Million Forecast, by Component 2019 & 2032
- Table 42: Global HR Analytics Industry Revenue Million Forecast, by Deployment Mode 2019 & 2032
- Table 43: Global HR Analytics Industry Revenue Million Forecast, by End-User Industry 2019 & 2032
- Table 44: Global HR Analytics Industry Revenue Million Forecast, by Country 2019 & 2032
- Table 45: India HR Analytics Industry Revenue (Million) Forecast, by Application 2019 & 2032
- Table 46: China HR Analytics Industry Revenue (Million) Forecast, by Application 2019 & 2032
- Table 47: Japan HR Analytics Industry Revenue (Million) Forecast, by Application 2019 & 2032
- Table 48: Rest of Asia Pacific HR Analytics Industry Revenue (Million) Forecast, by Application 2019 & 2032
- Table 49: Global HR Analytics Industry Revenue Million Forecast, by Component 2019 & 2032
- Table 50: Global HR Analytics Industry Revenue Million Forecast, by Deployment Mode 2019 & 2032
- Table 51: Global HR Analytics Industry Revenue Million Forecast, by End-User Industry 2019 & 2032
- Table 52: Global HR Analytics Industry Revenue Million Forecast, by Country 2019 & 2032
- Table 53: Brazil HR Analytics Industry Revenue (Million) Forecast, by Application 2019 & 2032
- Table 54: Argentina HR Analytics Industry Revenue (Million) Forecast, by Application 2019 & 2032
- Table 55: Rest of Latin America HR Analytics Industry Revenue (Million) Forecast, by Application 2019 & 2032
- Table 56: Global HR Analytics Industry Revenue Million Forecast, by Component 2019 & 2032
- Table 57: Global HR Analytics Industry Revenue Million Forecast, by Deployment Mode 2019 & 2032
- Table 58: Global HR Analytics Industry Revenue Million Forecast, by End-User Industry 2019 & 2032
- Table 59: Global HR Analytics Industry Revenue Million Forecast, by Country 2019 & 2032
- Table 60: United Arab Emirates HR Analytics Industry Revenue (Million) Forecast, by Application 2019 & 2032
- Table 61: Saudi Arabia HR Analytics Industry Revenue (Million) Forecast, by Application 2019 & 2032
- Table 62: Rest of Middle East and Africa HR Analytics Industry Revenue (Million) Forecast, by Application 2019 & 2032
Frequently Asked Questions
1. What is the projected Compound Annual Growth Rate (CAGR) of the HR Analytics Industry?
The projected CAGR is approximately 12.89%.
2. Which companies are prominent players in the HR Analytics Industry?
Key companies in the market include Workday Inc, Gaininsights Solutions Pvt Ltd*List Not Exhaustive, Nakisa Inc, IBM Corporation, Zoho Corporation Pvt Ltd, Tableau Software Inc, Oracle Corporation, Kronos Inc, SAP SE.
3. What are the main segments of the HR Analytics Industry?
The market segments include Component, Deployment Mode, End-User Industry.
4. Can you provide details about the market size?
The market size is estimated to be USD 4.31 Million as of 2022.
5. What are some drivers contributing to market growth?
Increase in Trends in Cloud-based Solutions; Increase in Workforce and Need for Reduction in Attrition Rate.
6. What are the notable trends driving market growth?
Telecom and IT Industry is Witnessing a Significant Share in the Market.
7. Are there any restraints impacting market growth?
7.1 Increasing Security and Privacy Concerns.
8. Can you provide examples of recent developments in the market?
June 2022: GainInsights, a global data and analytics firm announced it has signed an agreement with DataSwitch, an emerging AI/ML-driven Data Transformation Platform, to accelerate analytics modernization initiatives through data pipeline innovation and accelerators for migration.
9. What pricing options are available for accessing the report?
Pricing options include single-user, multi-user, and enterprise licenses priced at USD 4750, USD 5250, and USD 8750 respectively.
10. Is the market size provided in terms of value or volume?
The market size is provided in terms of value, measured in Million.
11. Are there any specific market keywords associated with the report?
Yes, the market keyword associated with the report is "HR Analytics Industry," which aids in identifying and referencing the specific market segment covered.
12. How do I determine which pricing option suits my needs best?
The pricing options vary based on user requirements and access needs. Individual users may opt for single-user licenses, while businesses requiring broader access may choose multi-user or enterprise licenses for cost-effective access to the report.
13. Are there any additional resources or data provided in the HR Analytics Industry report?
While the report offers comprehensive insights, it's advisable to review the specific contents or supplementary materials provided to ascertain if additional resources or data are available.
14. How can I stay updated on further developments or reports in the HR Analytics Industry?
To stay informed about further developments, trends, and reports in the HR Analytics Industry, consider subscribing to industry newsletters, following relevant companies and organizations, or regularly checking reputable industry news sources and publications.
Methodology
Step 1 - Identification of Relevant Samples Size from Population Database


Step 2 - Approaches for Defining Global Market Size (Value, Volume* & Price*)

Note*: In applicable scenarios
Step 3 - Data Sources
Primary Research
- Web Analytics
- Survey Reports
- Research Institute
- Latest Research Reports
- Opinion Leaders
Secondary Research
- Annual Reports
- White Paper
- Latest Press Release
- Industry Association
- Paid Database
- Investor Presentations

Step 4 - Data Triangulation
Involves using different sources of information in order to increase the validity of a study
These sources are likely to be stakeholders in a program - participants, other researchers, program staff, other community members, and so on.
Then we put all data in single framework & apply various statistical tools to find out the dynamic on the market.
During the analysis stage, feedback from the stakeholder groups would be compared to determine areas of agreement as well as areas of divergence
