

Key Insights
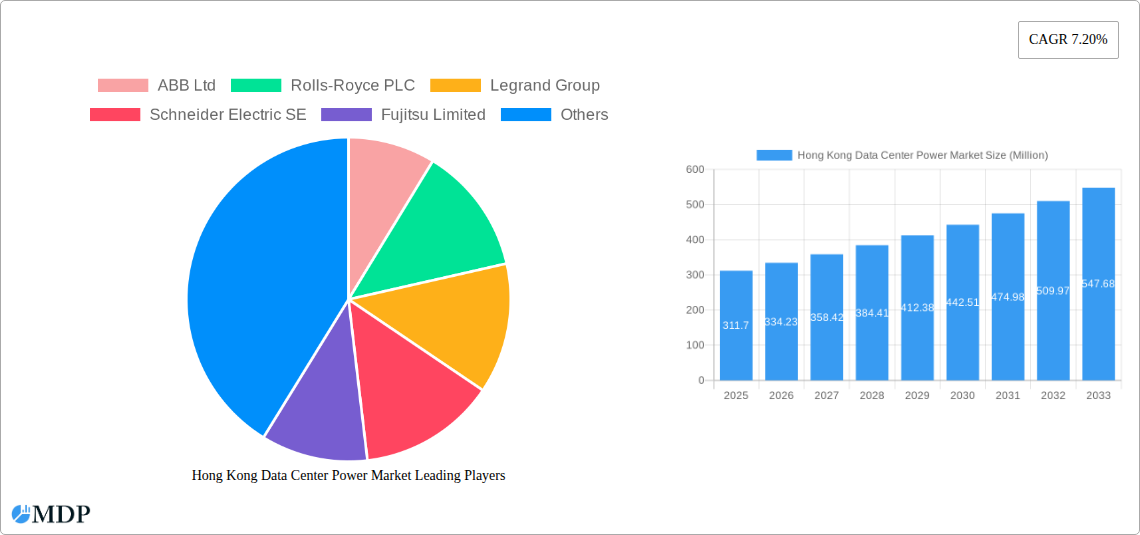
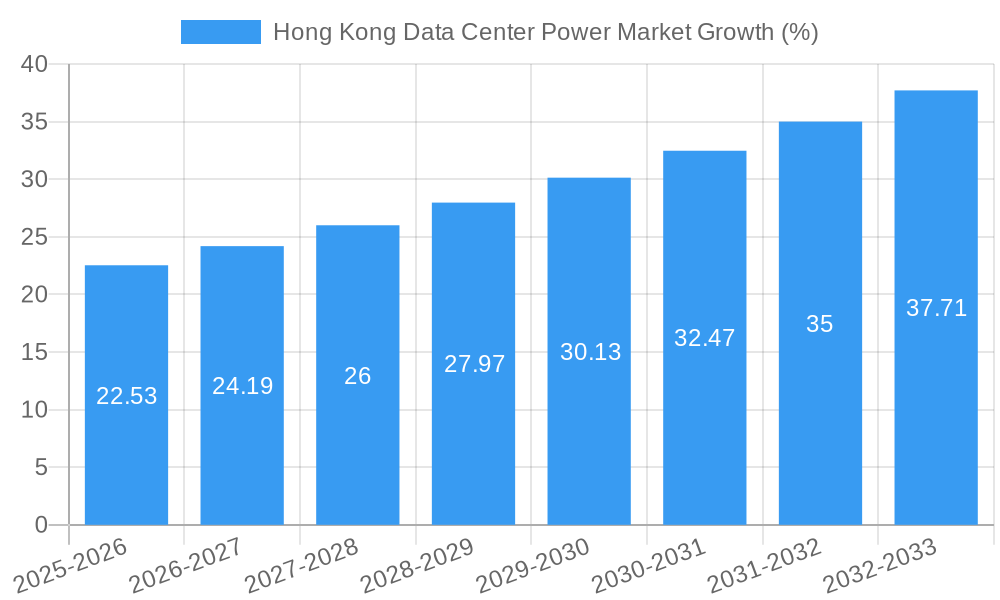
The Hong Kong data center power market, valued at $311.70 million in 2025, is projected to experience robust growth, fueled by a Compound Annual Growth Rate (CAGR) of 7.20% from 2025 to 2033. This expansion is driven by the increasing demand for cloud computing services, the proliferation of big data applications, and the rising adoption of edge computing within the region. Key industry drivers include government initiatives promoting digital transformation, the expansion of 5G networks, and the growing presence of multinational technology companies establishing data centers in Hong Kong to serve the Asian market. Furthermore, the need for reliable and efficient power solutions, including uninterruptible power supplies (UPS), power distribution units (PDUs), and advanced monitoring systems, is contributing significantly to market growth. The market segmentation reveals a strong presence of IT & Telecommunication, BFSI (Banking, Financial Services, and Insurance), and Government sectors as major end-users. Leading vendors like ABB, Schneider Electric, and Vertiv are actively participating, offering a diverse range of power infrastructure solutions, including electrical solutions and critical power distribution systems.
Significant market trends include the growing adoption of renewable energy sources to power data centers, increasing demand for energy-efficient power solutions, and the integration of smart monitoring and control technologies for improved operational efficiency. While the market faces constraints such as the high cost of land and power in Hong Kong and potential regulatory hurdles, the overall growth trajectory remains positive. The forecast period suggests a consistent expansion driven by technological advancements and increased investments in data center infrastructure. Specific challenges and opportunities for individual market segments (e.g., the potential for growth in the Media & Entertainment sector or the role of service providers) will further shape the market landscape in the coming years. This sustained growth positions Hong Kong as a key player in the regional data center power market.
Hong Kong Data Center Power Market: A Comprehensive Report (2019-2033)
This in-depth report provides a comprehensive analysis of the Hong Kong Data Center Power Market, offering invaluable insights for stakeholders across the industry. From market dynamics and leading players to emerging opportunities and future growth projections, this report is your essential guide to navigating this rapidly evolving sector. With a study period spanning 2019-2033, a base year of 2025, and a forecast period of 2025-2033, this report leverages rigorous data analysis to present actionable intelligence. The market is valued at xx Million in 2025 and is projected to reach xx Million by 2033, exhibiting a CAGR of xx%.
Hong Kong Data Center Power Market Market Dynamics & Concentration
The Hong Kong data center power market is characterized by a moderately concentrated landscape, with several multinational corporations holding significant market share. The market's dynamics are shaped by several key factors:
Market Concentration: The top five players, including ABB Ltd, Rolls-Royce PLC, Legrand Group, Schneider Electric SE, and Fujitsu Limited, collectively hold approximately xx% of the market share in 2025. Smaller players actively compete, driving innovation and price competition.
Innovation Drivers: The increasing demand for higher power density, improved energy efficiency, and enhanced reliability in data centers fuels continuous innovation in power distribution solutions. The adoption of technologies like AI-powered predictive maintenance and smart PDUs is reshaping the market.
Regulatory Frameworks: Government regulations regarding energy efficiency and sustainability are impacting the market, prompting the adoption of greener power solutions. Compliance with these regulations necessitates investment in innovative and environmentally friendly technologies.
Product Substitutes: While traditional power distribution solutions dominate, the emergence of alternative power sources such as hydrogen fuel cells (as seen in Caterpillar Inc.'s recent partnership with Microsoft and Ballard Power Systems) presents a significant challenge and opportunity for existing players.
End-User Trends: The growth of cloud computing, big data analytics, and 5G networks is driving exponential increases in data center power demand, particularly within the IT & Telecommunications, BFSI, and Government sectors. These sectors are becoming increasingly reliant on robust and reliable power infrastructure.
M&A Activities: The market has witnessed xx M&A deals in the historical period (2019-2024). Consolidation is expected to continue as larger players seek to expand their market share and gain access to new technologies.
Hong Kong Data Center Power Market Industry Trends & Analysis
The Hong Kong data center power market is experiencing robust growth fueled by several key trends:
The market is witnessing significant growth driven by the increasing adoption of cloud computing and the expanding digital economy. The rising demand for reliable and efficient power infrastructure within data centers is pushing this sector forward. Technological advancements such as the use of AI and IoT for predictive maintenance and remote monitoring are also driving growth. The preference for sustainable and eco-friendly power solutions, coupled with stringent government regulations promoting energy efficiency, is changing industry dynamics. The competitive landscape remains dynamic, with both established players and emerging companies vying for market share through innovation, strategic partnerships, and acquisitions. This competition fosters continuous improvement in product offerings and services, ultimately benefiting data center operators.
Leading Markets & Segments in Hong Kong Data Center Power Market
The IT & Telecommunication sector is the leading end-user segment in the Hong Kong data center power market, accounting for approximately xx% of the total market revenue in 2025. This is followed by the BFSI sector and the Government sector.
Key Drivers for IT & Telecommunication Dominance:
- Rapid growth of cloud computing and data center infrastructure.
- Increasing demand for high-speed internet and 5G connectivity.
- Stringent requirements for uptime and reliability.
Power Distribution Solutions: Critical Power Distribution and PDUs are the leading segments within Power Distribution Solutions, driven by the need for redundancy and efficient power management.
Geographical Dominance: The majority of data center power infrastructure is concentrated in urban areas of Hong Kong, specifically those with optimal connectivity and infrastructure.
The Electrical Solution segment dominates the By Power Infrastructure category, accounting for over xx% of the market share. This dominance is fueled by the ever-increasing demand for robust, reliable, and efficient power distribution systems within data centers.
Hong Kong Data Center Power Market Product Developments
Significant product innovations are focused on enhancing energy efficiency, improving reliability, and integrating smart technologies. This includes the development of intelligent PDUs with remote monitoring capabilities, advanced switchgear with improved fault detection, and modular power distribution systems allowing for scalability and flexibility. These developments cater to the growing need for optimized power usage and reduced operational costs in data centers. The integration of renewable energy sources, like solar and wind, into backup power systems also represents a major step toward more sustainable and environmentally friendly data center operations.
Key Drivers of Hong Kong Data Center Power Market Growth
Several factors contribute to the market's growth trajectory:
- Technological advancements: The adoption of advanced technologies like AI, IoT, and automation drives efficiency and optimization of power distribution systems.
- Economic growth: Hong Kong's robust economy and increasing investments in IT infrastructure stimulate data center development.
- Government policies: Supportive regulations promoting data center development and energy efficiency are further boosting market growth.
Challenges in the Hong Kong Data Center Power Market Market
The market faces certain challenges:
- High infrastructure costs: Building and maintaining robust power infrastructure in Hong Kong is costly.
- Land scarcity: Limited land availability for data center construction presents a challenge to expansion.
- Competition: Intense competition among suppliers pressures profit margins.
Emerging Opportunities in Hong Kong Data Center Power Market
The market presents significant growth opportunities:
The rising adoption of renewable energy sources in data center power systems presents a massive opportunity. Furthermore, the increasing demand for edge computing and the development of new technological innovations will fuel growth in the coming years. Strategic partnerships to provide comprehensive power solutions and market expansion into emerging sectors are expected to create further opportunities.
Leading Players in the Hong Kong Data Center Power Market Sector
- ABB Ltd
- Rolls-Royce PLC
- Legrand Group
- Schneider Electric SE
- Fujitsu Limited
- Caterpillar Inc
- Rittal GmbH & Co KG
- Cisco Systems Inc
- Cummins Inc
- Vertiv Group Corp
- Eaton Corporation
Key Milestones in Hong Kong Data Center Power Market Industry
- January 2024: Caterpillar Inc. partnered with Microsoft and Ballard Power Systems to test hydrogen fuel cells for data center backup power, signifying a shift toward eco-friendly solutions.
- March 2024: Schneider Electric expanded its US manufacturing facilities for data center power distribution products, indicating increased capacity and commitment to the market.
Strategic Outlook for Hong Kong Data Center Power Market Market
The Hong Kong data center power market is poised for continued strong growth, driven by the increasing demand for data center capacity, the adoption of new technologies, and the focus on sustainable power solutions. Strategic partnerships, technological innovations, and expansion into new sectors will be key to success in this dynamic market. The market's future hinges on the successful integration of renewable energy sources and further advancements in power efficiency technologies.
Hong Kong Data Center Power Market Segmentation
-
1. Power Infrastructure
-
1.1. Electrical Solution
- 1.1.1. UPS Systems
- 1.1.2. Generators
-
1.1.3. Power Distribution Solutions
- 1.1.3.1. PDU
- 1.1.3.2. Switchgear
- 1.1.3.3. Critical Power Distribution
- 1.1.3.4. Transfer Switches
- 1.1.3.5. Remote Power Panels
- 1.1.3.6. Other Power Distribution Solutions
- 1.2. Service
-
1.1. Electrical Solution
-
2. End User
- 2.1. IT & Telecommunication
- 2.2. BFSI
- 2.3. Government
- 2.4. Media & Entertainment
- 2.5. Other End Users
Hong Kong Data Center Power Market Segmentation By Geography
-
1. North America
- 1.1. United States
- 1.2. Canada
- 1.3. Mexico
-
2. South America
- 2.1. Brazil
- 2.2. Argentina
- 2.3. Rest of South America
-
3. Europe
- 3.1. United Kingdom
- 3.2. Germany
- 3.3. France
- 3.4. Italy
- 3.5. Spain
- 3.6. Russia
- 3.7. Benelux
- 3.8. Nordics
- 3.9. Rest of Europe
-
4. Middle East & Africa
- 4.1. Turkey
- 4.2. Israel
- 4.3. GCC
- 4.4. North Africa
- 4.5. South Africa
- 4.6. Rest of Middle East & Africa
-
5. Asia Pacific
- 5.1. China
- 5.2. India
- 5.3. Japan
- 5.4. South Korea
- 5.5. ASEAN
- 5.6. Oceania
- 5.7. Rest of Asia Pacific
Hong Kong Data Center Power Market REPORT HIGHLIGHTS
| Aspects | Details |
|---|---|
| Study Period | 2019-2033 |
| Base Year | 2024 |
| Estimated Year | 2025 |
| Forecast Period | 2025-2033 |
| Historical Period | 2019-2024 |
| Growth Rate | CAGR of 7.20% from 2019-2033 |
| Segmentation |
|
Table of Contents
- 1. Introduction
- 1.1. Research Scope
- 1.2. Market Segmentation
- 1.3. Research Methodology
- 1.4. Definitions and Assumptions
- 2. Executive Summary
- 2.1. Introduction
- 3. Market Dynamics
- 3.1. Introduction
- 3.2. Market Drivers
- 3.2.1. Rising Adoption of Mega Data Centers and Cloud Computing; Increasing Demand to Reduce Operational Costs
- 3.3. Market Restrains
- 3.3.1. High Cost of Installation and Maintenance
- 3.4. Market Trends
- 3.4.1. IT & Telecommunication Segment to Hold Major Share in the Market
- 4. Market Factor Analysis
- 4.1. Porters Five Forces
- 4.2. Supply/Value Chain
- 4.3. PESTEL analysis
- 4.4. Market Entropy
- 4.5. Patent/Trademark Analysis
- 5. Global Hong Kong Data Center Power Market Analysis, Insights and Forecast, 2019-2031
- 5.1. Market Analysis, Insights and Forecast - by Power Infrastructure
- 5.1.1. Electrical Solution
- 5.1.1.1. UPS Systems
- 5.1.1.2. Generators
- 5.1.1.3. Power Distribution Solutions
- 5.1.1.3.1. PDU
- 5.1.1.3.2. Switchgear
- 5.1.1.3.3. Critical Power Distribution
- 5.1.1.3.4. Transfer Switches
- 5.1.1.3.5. Remote Power Panels
- 5.1.1.3.6. Other Power Distribution Solutions
- 5.1.2. Service
- 5.1.1. Electrical Solution
- 5.2. Market Analysis, Insights and Forecast - by End User
- 5.2.1. IT & Telecommunication
- 5.2.2. BFSI
- 5.2.3. Government
- 5.2.4. Media & Entertainment
- 5.2.5. Other End Users
- 5.3. Market Analysis, Insights and Forecast - by Region
- 5.3.1. North America
- 5.3.2. South America
- 5.3.3. Europe
- 5.3.4. Middle East & Africa
- 5.3.5. Asia Pacific
- 5.1. Market Analysis, Insights and Forecast - by Power Infrastructure
- 6. North America Hong Kong Data Center Power Market Analysis, Insights and Forecast, 2019-2031
- 6.1. Market Analysis, Insights and Forecast - by Power Infrastructure
- 6.1.1. Electrical Solution
- 6.1.1.1. UPS Systems
- 6.1.1.2. Generators
- 6.1.1.3. Power Distribution Solutions
- 6.1.1.3.1. PDU
- 6.1.1.3.2. Switchgear
- 6.1.1.3.3. Critical Power Distribution
- 6.1.1.3.4. Transfer Switches
- 6.1.1.3.5. Remote Power Panels
- 6.1.1.3.6. Other Power Distribution Solutions
- 6.1.2. Service
- 6.1.1. Electrical Solution
- 6.2. Market Analysis, Insights and Forecast - by End User
- 6.2.1. IT & Telecommunication
- 6.2.2. BFSI
- 6.2.3. Government
- 6.2.4. Media & Entertainment
- 6.2.5. Other End Users
- 6.1. Market Analysis, Insights and Forecast - by Power Infrastructure
- 7. South America Hong Kong Data Center Power Market Analysis, Insights and Forecast, 2019-2031
- 7.1. Market Analysis, Insights and Forecast - by Power Infrastructure
- 7.1.1. Electrical Solution
- 7.1.1.1. UPS Systems
- 7.1.1.2. Generators
- 7.1.1.3. Power Distribution Solutions
- 7.1.1.3.1. PDU
- 7.1.1.3.2. Switchgear
- 7.1.1.3.3. Critical Power Distribution
- 7.1.1.3.4. Transfer Switches
- 7.1.1.3.5. Remote Power Panels
- 7.1.1.3.6. Other Power Distribution Solutions
- 7.1.2. Service
- 7.1.1. Electrical Solution
- 7.2. Market Analysis, Insights and Forecast - by End User
- 7.2.1. IT & Telecommunication
- 7.2.2. BFSI
- 7.2.3. Government
- 7.2.4. Media & Entertainment
- 7.2.5. Other End Users
- 7.1. Market Analysis, Insights and Forecast - by Power Infrastructure
- 8. Europe Hong Kong Data Center Power Market Analysis, Insights and Forecast, 2019-2031
- 8.1. Market Analysis, Insights and Forecast - by Power Infrastructure
- 8.1.1. Electrical Solution
- 8.1.1.1. UPS Systems
- 8.1.1.2. Generators
- 8.1.1.3. Power Distribution Solutions
- 8.1.1.3.1. PDU
- 8.1.1.3.2. Switchgear
- 8.1.1.3.3. Critical Power Distribution
- 8.1.1.3.4. Transfer Switches
- 8.1.1.3.5. Remote Power Panels
- 8.1.1.3.6. Other Power Distribution Solutions
- 8.1.2. Service
- 8.1.1. Electrical Solution
- 8.2. Market Analysis, Insights and Forecast - by End User
- 8.2.1. IT & Telecommunication
- 8.2.2. BFSI
- 8.2.3. Government
- 8.2.4. Media & Entertainment
- 8.2.5. Other End Users
- 8.1. Market Analysis, Insights and Forecast - by Power Infrastructure
- 9. Middle East & Africa Hong Kong Data Center Power Market Analysis, Insights and Forecast, 2019-2031
- 9.1. Market Analysis, Insights and Forecast - by Power Infrastructure
- 9.1.1. Electrical Solution
- 9.1.1.1. UPS Systems
- 9.1.1.2. Generators
- 9.1.1.3. Power Distribution Solutions
- 9.1.1.3.1. PDU
- 9.1.1.3.2. Switchgear
- 9.1.1.3.3. Critical Power Distribution
- 9.1.1.3.4. Transfer Switches
- 9.1.1.3.5. Remote Power Panels
- 9.1.1.3.6. Other Power Distribution Solutions
- 9.1.2. Service
- 9.1.1. Electrical Solution
- 9.2. Market Analysis, Insights and Forecast - by End User
- 9.2.1. IT & Telecommunication
- 9.2.2. BFSI
- 9.2.3. Government
- 9.2.4. Media & Entertainment
- 9.2.5. Other End Users
- 9.1. Market Analysis, Insights and Forecast - by Power Infrastructure
- 10. Asia Pacific Hong Kong Data Center Power Market Analysis, Insights and Forecast, 2019-2031
- 10.1. Market Analysis, Insights and Forecast - by Power Infrastructure
- 10.1.1. Electrical Solution
- 10.1.1.1. UPS Systems
- 10.1.1.2. Generators
- 10.1.1.3. Power Distribution Solutions
- 10.1.1.3.1. PDU
- 10.1.1.3.2. Switchgear
- 10.1.1.3.3. Critical Power Distribution
- 10.1.1.3.4. Transfer Switches
- 10.1.1.3.5. Remote Power Panels
- 10.1.1.3.6. Other Power Distribution Solutions
- 10.1.2. Service
- 10.1.1. Electrical Solution
- 10.2. Market Analysis, Insights and Forecast - by End User
- 10.2.1. IT & Telecommunication
- 10.2.2. BFSI
- 10.2.3. Government
- 10.2.4. Media & Entertainment
- 10.2.5. Other End Users
- 10.1. Market Analysis, Insights and Forecast - by Power Infrastructure
- 11. Competitive Analysis
- 11.1. Global Market Share Analysis 2024
- 11.2. Company Profiles
- 11.2.1 ABB Ltd
- 11.2.1.1. Overview
- 11.2.1.2. Products
- 11.2.1.3. SWOT Analysis
- 11.2.1.4. Recent Developments
- 11.2.1.5. Financials (Based on Availability)
- 11.2.2 Rolls-Royce PLC
- 11.2.2.1. Overview
- 11.2.2.2. Products
- 11.2.2.3. SWOT Analysis
- 11.2.2.4. Recent Developments
- 11.2.2.5. Financials (Based on Availability)
- 11.2.3 Legrand Group
- 11.2.3.1. Overview
- 11.2.3.2. Products
- 11.2.3.3. SWOT Analysis
- 11.2.3.4. Recent Developments
- 11.2.3.5. Financials (Based on Availability)
- 11.2.4 Schneider Electric SE
- 11.2.4.1. Overview
- 11.2.4.2. Products
- 11.2.4.3. SWOT Analysis
- 11.2.4.4. Recent Developments
- 11.2.4.5. Financials (Based on Availability)
- 11.2.5 Fujitsu Limited
- 11.2.5.1. Overview
- 11.2.5.2. Products
- 11.2.5.3. SWOT Analysis
- 11.2.5.4. Recent Developments
- 11.2.5.5. Financials (Based on Availability)
- 11.2.6 Caterpillar Inc
- 11.2.6.1. Overview
- 11.2.6.2. Products
- 11.2.6.3. SWOT Analysis
- 11.2.6.4. Recent Developments
- 11.2.6.5. Financials (Based on Availability)
- 11.2.7 Rittal GmbH & Co KG
- 11.2.7.1. Overview
- 11.2.7.2. Products
- 11.2.7.3. SWOT Analysis
- 11.2.7.4. Recent Developments
- 11.2.7.5. Financials (Based on Availability)
- 11.2.8 Cisco Systems Inc *List Not Exhaustive
- 11.2.8.1. Overview
- 11.2.8.2. Products
- 11.2.8.3. SWOT Analysis
- 11.2.8.4. Recent Developments
- 11.2.8.5. Financials (Based on Availability)
- 11.2.9 Cummins Inc
- 11.2.9.1. Overview
- 11.2.9.2. Products
- 11.2.9.3. SWOT Analysis
- 11.2.9.4. Recent Developments
- 11.2.9.5. Financials (Based on Availability)
- 11.2.10 Vertiv Group Corp
- 11.2.10.1. Overview
- 11.2.10.2. Products
- 11.2.10.3. SWOT Analysis
- 11.2.10.4. Recent Developments
- 11.2.10.5. Financials (Based on Availability)
- 11.2.11 Eaton Corporation
- 11.2.11.1. Overview
- 11.2.11.2. Products
- 11.2.11.3. SWOT Analysis
- 11.2.11.4. Recent Developments
- 11.2.11.5. Financials (Based on Availability)
- 11.2.1 ABB Ltd
List of Figures
- Figure 1: Global Hong Kong Data Center Power Market Revenue Breakdown (Million, %) by Region 2024 & 2032
- Figure 2: Hong Kong Hong Kong Data Center Power Market Revenue (Million), by Country 2024 & 2032
- Figure 3: Hong Kong Hong Kong Data Center Power Market Revenue Share (%), by Country 2024 & 2032
- Figure 4: North America Hong Kong Data Center Power Market Revenue (Million), by Power Infrastructure 2024 & 2032
- Figure 5: North America Hong Kong Data Center Power Market Revenue Share (%), by Power Infrastructure 2024 & 2032
- Figure 6: North America Hong Kong Data Center Power Market Revenue (Million), by End User 2024 & 2032
- Figure 7: North America Hong Kong Data Center Power Market Revenue Share (%), by End User 2024 & 2032
- Figure 8: North America Hong Kong Data Center Power Market Revenue (Million), by Country 2024 & 2032
- Figure 9: North America Hong Kong Data Center Power Market Revenue Share (%), by Country 2024 & 2032
- Figure 10: South America Hong Kong Data Center Power Market Revenue (Million), by Power Infrastructure 2024 & 2032
- Figure 11: South America Hong Kong Data Center Power Market Revenue Share (%), by Power Infrastructure 2024 & 2032
- Figure 12: South America Hong Kong Data Center Power Market Revenue (Million), by End User 2024 & 2032
- Figure 13: South America Hong Kong Data Center Power Market Revenue Share (%), by End User 2024 & 2032
- Figure 14: South America Hong Kong Data Center Power Market Revenue (Million), by Country 2024 & 2032
- Figure 15: South America Hong Kong Data Center Power Market Revenue Share (%), by Country 2024 & 2032
- Figure 16: Europe Hong Kong Data Center Power Market Revenue (Million), by Power Infrastructure 2024 & 2032
- Figure 17: Europe Hong Kong Data Center Power Market Revenue Share (%), by Power Infrastructure 2024 & 2032
- Figure 18: Europe Hong Kong Data Center Power Market Revenue (Million), by End User 2024 & 2032
- Figure 19: Europe Hong Kong Data Center Power Market Revenue Share (%), by End User 2024 & 2032
- Figure 20: Europe Hong Kong Data Center Power Market Revenue (Million), by Country 2024 & 2032
- Figure 21: Europe Hong Kong Data Center Power Market Revenue Share (%), by Country 2024 & 2032
- Figure 22: Middle East & Africa Hong Kong Data Center Power Market Revenue (Million), by Power Infrastructure 2024 & 2032
- Figure 23: Middle East & Africa Hong Kong Data Center Power Market Revenue Share (%), by Power Infrastructure 2024 & 2032
- Figure 24: Middle East & Africa Hong Kong Data Center Power Market Revenue (Million), by End User 2024 & 2032
- Figure 25: Middle East & Africa Hong Kong Data Center Power Market Revenue Share (%), by End User 2024 & 2032
- Figure 26: Middle East & Africa Hong Kong Data Center Power Market Revenue (Million), by Country 2024 & 2032
- Figure 27: Middle East & Africa Hong Kong Data Center Power Market Revenue Share (%), by Country 2024 & 2032
- Figure 28: Asia Pacific Hong Kong Data Center Power Market Revenue (Million), by Power Infrastructure 2024 & 2032
- Figure 29: Asia Pacific Hong Kong Data Center Power Market Revenue Share (%), by Power Infrastructure 2024 & 2032
- Figure 30: Asia Pacific Hong Kong Data Center Power Market Revenue (Million), by End User 2024 & 2032
- Figure 31: Asia Pacific Hong Kong Data Center Power Market Revenue Share (%), by End User 2024 & 2032
- Figure 32: Asia Pacific Hong Kong Data Center Power Market Revenue (Million), by Country 2024 & 2032
- Figure 33: Asia Pacific Hong Kong Data Center Power Market Revenue Share (%), by Country 2024 & 2032
List of Tables
- Table 1: Global Hong Kong Data Center Power Market Revenue Million Forecast, by Region 2019 & 2032
- Table 2: Global Hong Kong Data Center Power Market Revenue Million Forecast, by Power Infrastructure 2019 & 2032
- Table 3: Global Hong Kong Data Center Power Market Revenue Million Forecast, by End User 2019 & 2032
- Table 4: Global Hong Kong Data Center Power Market Revenue Million Forecast, by Region 2019 & 2032
- Table 5: Global Hong Kong Data Center Power Market Revenue Million Forecast, by Country 2019 & 2032
- Table 6: Global Hong Kong Data Center Power Market Revenue Million Forecast, by Power Infrastructure 2019 & 2032
- Table 7: Global Hong Kong Data Center Power Market Revenue Million Forecast, by End User 2019 & 2032
- Table 8: Global Hong Kong Data Center Power Market Revenue Million Forecast, by Country 2019 & 2032
- Table 9: United States Hong Kong Data Center Power Market Revenue (Million) Forecast, by Application 2019 & 2032
- Table 10: Canada Hong Kong Data Center Power Market Revenue (Million) Forecast, by Application 2019 & 2032
- Table 11: Mexico Hong Kong Data Center Power Market Revenue (Million) Forecast, by Application 2019 & 2032
- Table 12: Global Hong Kong Data Center Power Market Revenue Million Forecast, by Power Infrastructure 2019 & 2032
- Table 13: Global Hong Kong Data Center Power Market Revenue Million Forecast, by End User 2019 & 2032
- Table 14: Global Hong Kong Data Center Power Market Revenue Million Forecast, by Country 2019 & 2032
- Table 15: Brazil Hong Kong Data Center Power Market Revenue (Million) Forecast, by Application 2019 & 2032
- Table 16: Argentina Hong Kong Data Center Power Market Revenue (Million) Forecast, by Application 2019 & 2032
- Table 17: Rest of South America Hong Kong Data Center Power Market Revenue (Million) Forecast, by Application 2019 & 2032
- Table 18: Global Hong Kong Data Center Power Market Revenue Million Forecast, by Power Infrastructure 2019 & 2032
- Table 19: Global Hong Kong Data Center Power Market Revenue Million Forecast, by End User 2019 & 2032
- Table 20: Global Hong Kong Data Center Power Market Revenue Million Forecast, by Country 2019 & 2032
- Table 21: United Kingdom Hong Kong Data Center Power Market Revenue (Million) Forecast, by Application 2019 & 2032
- Table 22: Germany Hong Kong Data Center Power Market Revenue (Million) Forecast, by Application 2019 & 2032
- Table 23: France Hong Kong Data Center Power Market Revenue (Million) Forecast, by Application 2019 & 2032
- Table 24: Italy Hong Kong Data Center Power Market Revenue (Million) Forecast, by Application 2019 & 2032
- Table 25: Spain Hong Kong Data Center Power Market Revenue (Million) Forecast, by Application 2019 & 2032
- Table 26: Russia Hong Kong Data Center Power Market Revenue (Million) Forecast, by Application 2019 & 2032
- Table 27: Benelux Hong Kong Data Center Power Market Revenue (Million) Forecast, by Application 2019 & 2032
- Table 28: Nordics Hong Kong Data Center Power Market Revenue (Million) Forecast, by Application 2019 & 2032
- Table 29: Rest of Europe Hong Kong Data Center Power Market Revenue (Million) Forecast, by Application 2019 & 2032
- Table 30: Global Hong Kong Data Center Power Market Revenue Million Forecast, by Power Infrastructure 2019 & 2032
- Table 31: Global Hong Kong Data Center Power Market Revenue Million Forecast, by End User 2019 & 2032
- Table 32: Global Hong Kong Data Center Power Market Revenue Million Forecast, by Country 2019 & 2032
- Table 33: Turkey Hong Kong Data Center Power Market Revenue (Million) Forecast, by Application 2019 & 2032
- Table 34: Israel Hong Kong Data Center Power Market Revenue (Million) Forecast, by Application 2019 & 2032
- Table 35: GCC Hong Kong Data Center Power Market Revenue (Million) Forecast, by Application 2019 & 2032
- Table 36: North Africa Hong Kong Data Center Power Market Revenue (Million) Forecast, by Application 2019 & 2032
- Table 37: South Africa Hong Kong Data Center Power Market Revenue (Million) Forecast, by Application 2019 & 2032
- Table 38: Rest of Middle East & Africa Hong Kong Data Center Power Market Revenue (Million) Forecast, by Application 2019 & 2032
- Table 39: Global Hong Kong Data Center Power Market Revenue Million Forecast, by Power Infrastructure 2019 & 2032
- Table 40: Global Hong Kong Data Center Power Market Revenue Million Forecast, by End User 2019 & 2032
- Table 41: Global Hong Kong Data Center Power Market Revenue Million Forecast, by Country 2019 & 2032
- Table 42: China Hong Kong Data Center Power Market Revenue (Million) Forecast, by Application 2019 & 2032
- Table 43: India Hong Kong Data Center Power Market Revenue (Million) Forecast, by Application 2019 & 2032
- Table 44: Japan Hong Kong Data Center Power Market Revenue (Million) Forecast, by Application 2019 & 2032
- Table 45: South Korea Hong Kong Data Center Power Market Revenue (Million) Forecast, by Application 2019 & 2032
- Table 46: ASEAN Hong Kong Data Center Power Market Revenue (Million) Forecast, by Application 2019 & 2032
- Table 47: Oceania Hong Kong Data Center Power Market Revenue (Million) Forecast, by Application 2019 & 2032
- Table 48: Rest of Asia Pacific Hong Kong Data Center Power Market Revenue (Million) Forecast, by Application 2019 & 2032
Frequently Asked Questions
1. What is the projected Compound Annual Growth Rate (CAGR) of the Hong Kong Data Center Power Market?
The projected CAGR is approximately 7.20%.
2. Which companies are prominent players in the Hong Kong Data Center Power Market?
Key companies in the market include ABB Ltd, Rolls-Royce PLC, Legrand Group, Schneider Electric SE, Fujitsu Limited, Caterpillar Inc, Rittal GmbH & Co KG, Cisco Systems Inc *List Not Exhaustive, Cummins Inc, Vertiv Group Corp, Eaton Corporation.
3. What are the main segments of the Hong Kong Data Center Power Market?
The market segments include Power Infrastructure, End User.
4. Can you provide details about the market size?
The market size is estimated to be USD 311.70 Million as of 2022.
5. What are some drivers contributing to market growth?
Rising Adoption of Mega Data Centers and Cloud Computing; Increasing Demand to Reduce Operational Costs.
6. What are the notable trends driving market growth?
IT & Telecommunication Segment to Hold Major Share in the Market.
7. Are there any restraints impacting market growth?
High Cost of Installation and Maintenance.
8. Can you provide examples of recent developments in the market?
January 2024: Caterpillar Inc. partnered with Microsoft and Ballard Power Systems to test the use of large-format hydrogen fuel cells as a reliable and eco-friendly backup power source for multi-megawatt data centers. Hydrogen fuel cells are seen as a possible low-carbon alternative to diesel backup generators, which is expected to drive the growth of DC generators.
9. What pricing options are available for accessing the report?
Pricing options include single-user, multi-user, and enterprise licenses priced at USD 3800, USD 4500, and USD 5800 respectively.
10. Is the market size provided in terms of value or volume?
The market size is provided in terms of value, measured in Million.
11. Are there any specific market keywords associated with the report?
Yes, the market keyword associated with the report is "Hong Kong Data Center Power Market," which aids in identifying and referencing the specific market segment covered.
12. How do I determine which pricing option suits my needs best?
The pricing options vary based on user requirements and access needs. Individual users may opt for single-user licenses, while businesses requiring broader access may choose multi-user or enterprise licenses for cost-effective access to the report.
13. Are there any additional resources or data provided in the Hong Kong Data Center Power Market report?
While the report offers comprehensive insights, it's advisable to review the specific contents or supplementary materials provided to ascertain if additional resources or data are available.
14. How can I stay updated on further developments or reports in the Hong Kong Data Center Power Market?
To stay informed about further developments, trends, and reports in the Hong Kong Data Center Power Market, consider subscribing to industry newsletters, following relevant companies and organizations, or regularly checking reputable industry news sources and publications.
Methodology
Step 1 - Identification of Relevant Samples Size from Population Database


Step 2 - Approaches for Defining Global Market Size (Value, Volume* & Price*)

Note*: In applicable scenarios
Step 3 - Data Sources
Primary Research
- Web Analytics
- Survey Reports
- Research Institute
- Latest Research Reports
- Opinion Leaders
Secondary Research
- Annual Reports
- White Paper
- Latest Press Release
- Industry Association
- Paid Database
- Investor Presentations

Step 4 - Data Triangulation
Involves using different sources of information in order to increase the validity of a study
These sources are likely to be stakeholders in a program - participants, other researchers, program staff, other community members, and so on.
Then we put all data in single framework & apply various statistical tools to find out the dynamic on the market.
During the analysis stage, feedback from the stakeholder groups would be compared to determine areas of agreement as well as areas of divergence
