

Key Insights
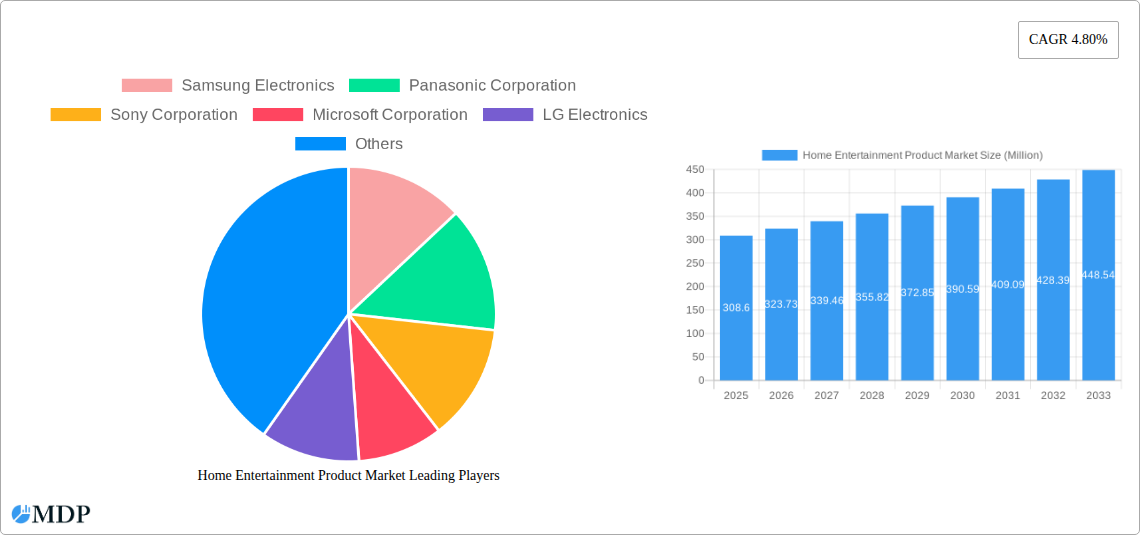
The global home entertainment market, valued at $308.60 million in 2025, is projected to experience robust growth, driven by several key factors. The increasing adoption of smart home technologies, coupled with the rising demand for high-quality audio-visual experiences, fuels market expansion. Consumers are increasingly investing in premium products like large-screen televisions with advanced features such as 8K resolution, HDR, and smart capabilities. The shift towards streaming services and online content consumption further boosts demand for devices capable of delivering seamless and immersive entertainment experiences. Technological advancements, including improved sound systems and virtual reality (VR) integration, are also key drivers, enhancing the overall user experience and attracting a wider consumer base. Competition among leading players like Samsung, Sony, LG, and Panasonic is fierce, driving innovation and price competitiveness. However, factors such as economic downturns and fluctuating raw material prices pose potential restraints to market growth. The market is segmented by product type (e.g., televisions, audio systems, home theaters), technology (e.g., LED, OLED, QLED), and distribution channel (e.g., online, retail). The forecast period (2025-2033) anticipates sustained growth, driven by continuous technological improvements and evolving consumer preferences.
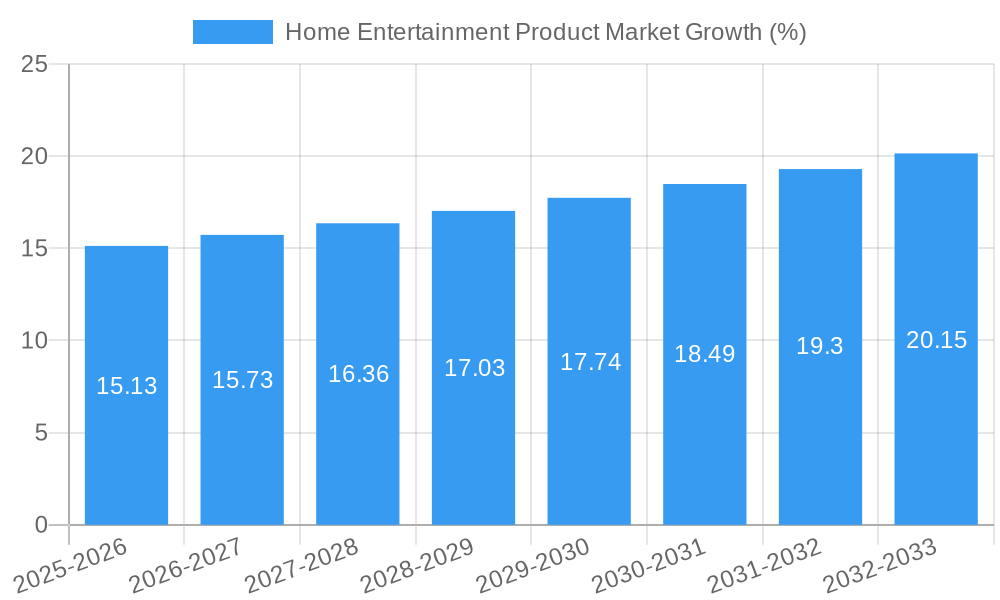
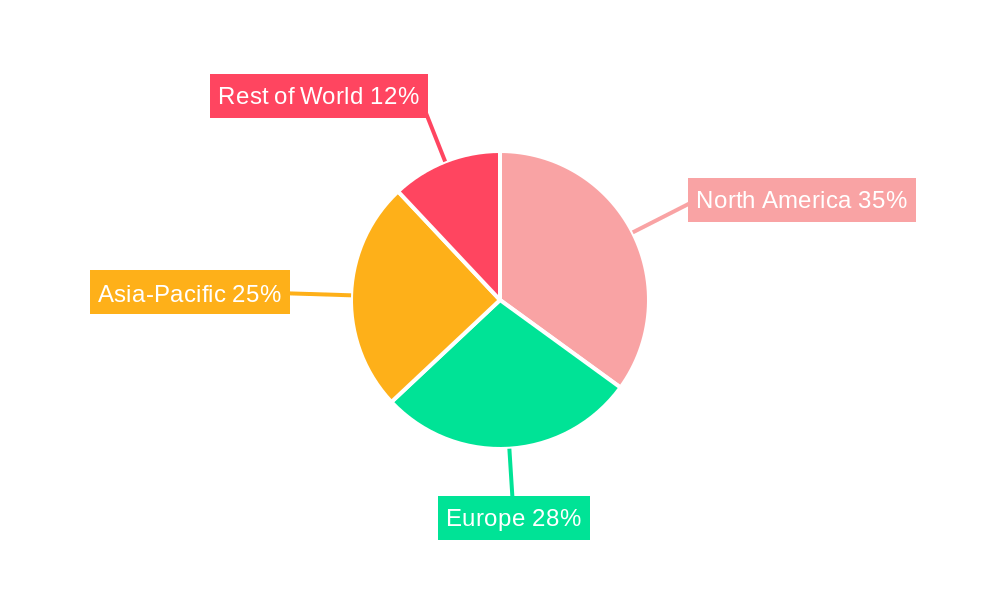
The market's compound annual growth rate (CAGR) of 4.80% from 2019 to 2025 suggests a consistent trajectory of expansion. This growth is expected to continue throughout the forecast period (2025-2033), though potentially at a slightly moderated pace due to market saturation in some regions and the cyclical nature of consumer electronics purchases. The geographic distribution of the market is likely to see growth across regions, but potentially with varying rates depending on economic factors and market penetration levels. North America and Asia-Pacific are anticipated to remain major markets, while growth in emerging economies will offer new opportunities for expansion. Continuous innovation in display technology, audio quality, and smart features will remain crucial for maintaining high growth. The competitive landscape will remain highly dynamic, with existing players constantly striving for differentiation and new entrants looking to capitalize on market opportunities.
Home Entertainment Product Market Report: 2019-2033
This comprehensive report provides an in-depth analysis of the Home Entertainment Product Market, covering the period from 2019 to 2033. With a base year of 2025 and a forecast period extending to 2033, this report offers valuable insights for industry stakeholders, investors, and strategic decision-makers. The market is analyzed across key segments, including [Insert Segments Here - e.g., Smart TVs, Streaming Devices, Audio Equipment, Gaming Consoles], offering a granular understanding of growth drivers, challenges, and opportunities. The report also features a detailed competitive landscape, profiling leading players like Samsung Electronics, Panasonic Corporation, Sony Corporation, Microsoft Corporation, LG Electronics, Apple Inc, Bose Corporation, Haier Inc, Koninklijke Philips N.V, and Mitsubishi Electric Corporation, amongst others. The analysis includes detailed financial projections, market sizing, and CAGR calculations.
Home Entertainment Product Market Market Dynamics & Concentration
The Home Entertainment Product Market exhibits a moderately concentrated landscape, with a few dominant players commanding significant market share. However, the market is also characterized by the presence of numerous smaller players, particularly in niche segments. Market concentration is influenced by factors such as brand recognition, technological capabilities, and economies of scale. Innovation is a key driver, with constant advancements in display technology (e.g., OLED, QLED, MicroLED), audio quality (e.g., Dolby Atmos, DTS:X), and streaming capabilities. Regulatory frameworks concerning data privacy and content licensing also shape the market dynamics. Product substitutes, such as out-of-home entertainment options and alternative leisure activities, pose a competitive threat. End-user preferences, particularly towards higher resolutions, immersive audio, and seamless integration with smart home ecosystems, influence product development and market trends.
The historical period (2019-2024) saw a significant increase in M&A activity, with xx major deals recorded. The estimated year (2025) projects a market size of xx Million, with a projected CAGR of xx% during the forecast period (2025-2033). Market share for top players: Samsung Electronics (xx%), Sony Corporation (xx%), LG Electronics (xx%). The acquisition of Vizio by Walmart in February 2024 illustrates the ongoing consolidation within the sector.
- Market Concentration: Moderately concentrated, with significant players holding xx% market share collectively.
- Innovation Drivers: Advancements in display, audio, and streaming technologies.
- Regulatory Frameworks: Data privacy and content licensing regulations.
- Product Substitutes: Out-of-home entertainment and alternative leisure activities.
- End-user Trends: Preference for higher resolution, immersive audio, and smart home integration.
- M&A Activity: xx major deals recorded in 2019-2024.
Home Entertainment Product Market Industry Trends & Analysis
The Home Entertainment Product Market is experiencing robust growth, driven by several key factors. Rising disposable incomes, particularly in developing economies, coupled with increasing urbanization and changing lifestyles, are boosting demand for premium home entertainment solutions. Technological advancements, such as the proliferation of 4K and 8K displays, high-fidelity audio systems, and immersive gaming experiences, are driving product innovation and market expansion. Consumers increasingly prefer convenient and personalized entertainment options, leading to a surge in the adoption of streaming services and smart TVs. However, competitive dynamics remain intense, with established players facing challenges from both new entrants and the emergence of disruptive technologies. Market penetration of smart TVs is estimated to reach xx% by 2033, while the CAGR for the overall market is projected at xx%.
Leading Markets & Segments in Home Entertainment Product Market
North America currently dominates the Home Entertainment Product Market, accounting for the largest market share, primarily due to high per capita income, advanced technological infrastructure, and early adoption of new technologies. However, Asia-Pacific is projected to witness the fastest growth during the forecast period driven by rapid economic expansion in several key markets (e.g., China, India). The Smart TV segment is the largest contributor to overall market revenue, followed by streaming devices and gaming consoles.
- North America Dominance: High per capita income, advanced technology infrastructure, early adoption.
- Asia-Pacific Growth: Rapid economic expansion in China and India driving market expansion.
- Smart TV Segment Leadership: Highest market share driven by affordability and feature-rich offerings.
- Streaming Devices Growth: Increased preference for on-demand content.
Home Entertainment Product Market Product Developments
Recent product innovations focus on enhanced picture quality (8K resolution, HDR), immersive audio experiences (Dolby Atmos, 3D audio), seamless integration with smart home ecosystems, and improved user interfaces. Products are designed to provide a more personalized and intuitive entertainment experience. The integration of AI and machine learning features is also gaining traction, leading to advancements in features such as voice control, content recommendations, and adaptive picture settings. These innovations improve the market fit by meeting evolving consumer preferences and creating a more engaging home entertainment experience.
Key Drivers of Home Entertainment Product Market Growth
Several factors are propelling the growth of the Home Entertainment Product Market. Technological advancements, such as the development of higher-resolution displays, improved audio technologies, and the rise of streaming platforms, are creating significant opportunities. The increasing affordability of home entertainment products, particularly smart TVs and streaming devices, is widening market access. Government initiatives to promote digital infrastructure development also contribute to market growth by supporting the adoption of higher bandwidth technologies required for streaming and gaming. Favorable economic conditions in several regions contribute significantly to the purchasing power of consumers.
Challenges in the Home Entertainment Product Market Market
The Home Entertainment Product Market faces several challenges. The increasing cost of raw materials and components leads to higher production costs and affects profitability. Supply chain disruptions, particularly those related to semiconductor manufacturing, impact product availability. Intense competition from established and emerging players leads to pricing pressures and reduced profit margins. Stringent regulatory compliance requirements for data privacy and content licensing pose significant hurdles. These factors negatively impact market growth. The impact of supply chain disruptions is estimated to have reduced overall market growth by xx% in 2022.
Emerging Opportunities in Home Entertainment Product Market
Significant opportunities exist for growth in the Home Entertainment Product Market. The development of advanced display technologies like MicroLED and advancements in artificial intelligence will drive the adoption of innovative features like hyper-realistic visuals and personalized content recommendations. Strategic partnerships between content providers and hardware manufacturers create synergistic opportunities. Expanding into emerging markets through localized product offerings and marketing strategies opens new avenues for growth. These emerging opportunities will enable market players to capture significant market share in the long term.
Leading Players in the Home Entertainment Product Market Sector
- Samsung Electronics
- Panasonic Corporation
- Sony Corporation
- Microsoft Corporation
- LG Electronics
- Apple Inc
- Bose Corporation
- Haier Inc
- Koninklijke Philips N.V
- Mitsubishi Electric Corporation
Key Milestones in Home Entertainment Product Market Industry
- February 2024: Walmart acquires Vizio for USD 2.3 Billion, significantly impacting the smart TV market and advertising revenue streams.
- April 2024: Sony renews the BRAVIA brand, focusing on enhancing the home cinema experience, aligning with the increasing popularity of streaming services.
- May 2024: ASUS announces the ROG Ally X handheld gaming console, featuring advanced specifications to compete in the growing mobile gaming market.
- July 2024: Evolution Malta Holding Limited acquires Galaxy Gaming Inc., strengthening its position in the online gaming sector and US market.
Strategic Outlook for Home Entertainment Product Market Market
The future of the Home Entertainment Product Market is bright, driven by continuous technological advancements, changing consumer preferences, and strategic market expansion initiatives. The convergence of technologies (AI, VR/AR, IoT) will lead to more immersive and interactive home entertainment experiences. The increasing penetration of high-speed internet connectivity will support the growth of high-bandwidth content, including 8K streaming and cloud gaming. Strategic partnerships and acquisitions will shape the competitive landscape and drive innovation within the sector. The market is poised for significant growth, presenting lucrative opportunities for both established and emerging players.
Home Entertainment Product Market Segmentation
-
1. Device
- 1.1. Audio Devices
- 1.2. Video Devices
- 1.3. Gaming Consoles
-
2. Distribution Channel
- 2.1. Online
- 2.2. Offline
Home Entertainment Product Market Segmentation By Geography
-
1. North America
- 1.1. United States
- 1.2. Canada
- 1.3. Mexico
-
2. South America
- 2.1. Brazil
- 2.2. Argentina
- 2.3. Rest of South America
-
3. Europe
- 3.1. United Kingdom
- 3.2. Germany
- 3.3. France
- 3.4. Italy
- 3.5. Spain
- 3.6. Russia
- 3.7. Benelux
- 3.8. Nordics
- 3.9. Rest of Europe
-
4. Middle East & Africa
- 4.1. Turkey
- 4.2. Israel
- 4.3. GCC
- 4.4. North Africa
- 4.5. South Africa
- 4.6. Rest of Middle East & Africa
-
5. Asia Pacific
- 5.1. China
- 5.2. India
- 5.3. Japan
- 5.4. South Korea
- 5.5. ASEAN
- 5.6. Oceania
- 5.7. Rest of Asia Pacific
Home Entertainment Product Market REPORT HIGHLIGHTS
| Aspects | Details |
|---|---|
| Study Period | 2019-2033 |
| Base Year | 2024 |
| Estimated Year | 2025 |
| Forecast Period | 2025-2033 |
| Historical Period | 2019-2024 |
| Growth Rate | CAGR of 4.80% from 2019-2033 |
| Segmentation |
|
Table of Contents
- 1. Introduction
- 1.1. Research Scope
- 1.2. Market Segmentation
- 1.3. Research Methodology
- 1.4. Definitions and Assumptions
- 2. Executive Summary
- 2.1. Introduction
- 3. Market Dynamics
- 3.1. Introduction
- 3.2. Market Drivers
- 3.2.1. Rising Popularity of IoT Connected Devices; Growing Number of Gaming Population Globally
- 3.3. Market Restrains
- 3.3.1. Rising Popularity of IoT Connected Devices; Growing Number of Gaming Population Globally
- 3.4. Market Trends
- 3.4.1. Gaming Consoles Gaining Popularity
- 4. Market Factor Analysis
- 4.1. Porters Five Forces
- 4.2. Supply/Value Chain
- 4.3. PESTEL analysis
- 4.4. Market Entropy
- 4.5. Patent/Trademark Analysis
- 5. Global Home Entertainment Product Market Analysis, Insights and Forecast, 2019-2031
- 5.1. Market Analysis, Insights and Forecast - by Device
- 5.1.1. Audio Devices
- 5.1.2. Video Devices
- 5.1.3. Gaming Consoles
- 5.2. Market Analysis, Insights and Forecast - by Distribution Channel
- 5.2.1. Online
- 5.2.2. Offline
- 5.3. Market Analysis, Insights and Forecast - by Region
- 5.3.1. North America
- 5.3.2. South America
- 5.3.3. Europe
- 5.3.4. Middle East & Africa
- 5.3.5. Asia Pacific
- 5.1. Market Analysis, Insights and Forecast - by Device
- 6. North America Home Entertainment Product Market Analysis, Insights and Forecast, 2019-2031
- 6.1. Market Analysis, Insights and Forecast - by Device
- 6.1.1. Audio Devices
- 6.1.2. Video Devices
- 6.1.3. Gaming Consoles
- 6.2. Market Analysis, Insights and Forecast - by Distribution Channel
- 6.2.1. Online
- 6.2.2. Offline
- 6.1. Market Analysis, Insights and Forecast - by Device
- 7. South America Home Entertainment Product Market Analysis, Insights and Forecast, 2019-2031
- 7.1. Market Analysis, Insights and Forecast - by Device
- 7.1.1. Audio Devices
- 7.1.2. Video Devices
- 7.1.3. Gaming Consoles
- 7.2. Market Analysis, Insights and Forecast - by Distribution Channel
- 7.2.1. Online
- 7.2.2. Offline
- 7.1. Market Analysis, Insights and Forecast - by Device
- 8. Europe Home Entertainment Product Market Analysis, Insights and Forecast, 2019-2031
- 8.1. Market Analysis, Insights and Forecast - by Device
- 8.1.1. Audio Devices
- 8.1.2. Video Devices
- 8.1.3. Gaming Consoles
- 8.2. Market Analysis, Insights and Forecast - by Distribution Channel
- 8.2.1. Online
- 8.2.2. Offline
- 8.1. Market Analysis, Insights and Forecast - by Device
- 9. Middle East & Africa Home Entertainment Product Market Analysis, Insights and Forecast, 2019-2031
- 9.1. Market Analysis, Insights and Forecast - by Device
- 9.1.1. Audio Devices
- 9.1.2. Video Devices
- 9.1.3. Gaming Consoles
- 9.2. Market Analysis, Insights and Forecast - by Distribution Channel
- 9.2.1. Online
- 9.2.2. Offline
- 9.1. Market Analysis, Insights and Forecast - by Device
- 10. Asia Pacific Home Entertainment Product Market Analysis, Insights and Forecast, 2019-2031
- 10.1. Market Analysis, Insights and Forecast - by Device
- 10.1.1. Audio Devices
- 10.1.2. Video Devices
- 10.1.3. Gaming Consoles
- 10.2. Market Analysis, Insights and Forecast - by Distribution Channel
- 10.2.1. Online
- 10.2.2. Offline
- 10.1. Market Analysis, Insights and Forecast - by Device
- 11. Competitive Analysis
- 11.1. Global Market Share Analysis 2024
- 11.2. Company Profiles
- 11.2.1 Samsung Electronics
- 11.2.1.1. Overview
- 11.2.1.2. Products
- 11.2.1.3. SWOT Analysis
- 11.2.1.4. Recent Developments
- 11.2.1.5. Financials (Based on Availability)
- 11.2.2 Panasonic Corporation
- 11.2.2.1. Overview
- 11.2.2.2. Products
- 11.2.2.3. SWOT Analysis
- 11.2.2.4. Recent Developments
- 11.2.2.5. Financials (Based on Availability)
- 11.2.3 Sony Corporation
- 11.2.3.1. Overview
- 11.2.3.2. Products
- 11.2.3.3. SWOT Analysis
- 11.2.3.4. Recent Developments
- 11.2.3.5. Financials (Based on Availability)
- 11.2.4 Microsoft Corporation
- 11.2.4.1. Overview
- 11.2.4.2. Products
- 11.2.4.3. SWOT Analysis
- 11.2.4.4. Recent Developments
- 11.2.4.5. Financials (Based on Availability)
- 11.2.5 LG Electronics
- 11.2.5.1. Overview
- 11.2.5.2. Products
- 11.2.5.3. SWOT Analysis
- 11.2.5.4. Recent Developments
- 11.2.5.5. Financials (Based on Availability)
- 11.2.6 Apple Inc
- 11.2.6.1. Overview
- 11.2.6.2. Products
- 11.2.6.3. SWOT Analysis
- 11.2.6.4. Recent Developments
- 11.2.6.5. Financials (Based on Availability)
- 11.2.7 Bose Corporation
- 11.2.7.1. Overview
- 11.2.7.2. Products
- 11.2.7.3. SWOT Analysis
- 11.2.7.4. Recent Developments
- 11.2.7.5. Financials (Based on Availability)
- 11.2.8 Haier Inc
- 11.2.8.1. Overview
- 11.2.8.2. Products
- 11.2.8.3. SWOT Analysis
- 11.2.8.4. Recent Developments
- 11.2.8.5. Financials (Based on Availability)
- 11.2.9 Koninklijke Philips N V
- 11.2.9.1. Overview
- 11.2.9.2. Products
- 11.2.9.3. SWOT Analysis
- 11.2.9.4. Recent Developments
- 11.2.9.5. Financials (Based on Availability)
- 11.2.10 Mitsubishi Electric Corporation*List Not Exhaustive
- 11.2.10.1. Overview
- 11.2.10.2. Products
- 11.2.10.3. SWOT Analysis
- 11.2.10.4. Recent Developments
- 11.2.10.5. Financials (Based on Availability)
- 11.2.1 Samsung Electronics
List of Figures
- Figure 1: Global Home Entertainment Product Market Revenue Breakdown (Million, %) by Region 2024 & 2032
- Figure 2: Global Home Entertainment Product Market Volume Breakdown (Billion, %) by Region 2024 & 2032
- Figure 3: North America Home Entertainment Product Market Revenue (Million), by Device 2024 & 2032
- Figure 4: North America Home Entertainment Product Market Volume (Billion), by Device 2024 & 2032
- Figure 5: North America Home Entertainment Product Market Revenue Share (%), by Device 2024 & 2032
- Figure 6: North America Home Entertainment Product Market Volume Share (%), by Device 2024 & 2032
- Figure 7: North America Home Entertainment Product Market Revenue (Million), by Distribution Channel 2024 & 2032
- Figure 8: North America Home Entertainment Product Market Volume (Billion), by Distribution Channel 2024 & 2032
- Figure 9: North America Home Entertainment Product Market Revenue Share (%), by Distribution Channel 2024 & 2032
- Figure 10: North America Home Entertainment Product Market Volume Share (%), by Distribution Channel 2024 & 2032
- Figure 11: North America Home Entertainment Product Market Revenue (Million), by Country 2024 & 2032
- Figure 12: North America Home Entertainment Product Market Volume (Billion), by Country 2024 & 2032
- Figure 13: North America Home Entertainment Product Market Revenue Share (%), by Country 2024 & 2032
- Figure 14: North America Home Entertainment Product Market Volume Share (%), by Country 2024 & 2032
- Figure 15: South America Home Entertainment Product Market Revenue (Million), by Device 2024 & 2032
- Figure 16: South America Home Entertainment Product Market Volume (Billion), by Device 2024 & 2032
- Figure 17: South America Home Entertainment Product Market Revenue Share (%), by Device 2024 & 2032
- Figure 18: South America Home Entertainment Product Market Volume Share (%), by Device 2024 & 2032
- Figure 19: South America Home Entertainment Product Market Revenue (Million), by Distribution Channel 2024 & 2032
- Figure 20: South America Home Entertainment Product Market Volume (Billion), by Distribution Channel 2024 & 2032
- Figure 21: South America Home Entertainment Product Market Revenue Share (%), by Distribution Channel 2024 & 2032
- Figure 22: South America Home Entertainment Product Market Volume Share (%), by Distribution Channel 2024 & 2032
- Figure 23: South America Home Entertainment Product Market Revenue (Million), by Country 2024 & 2032
- Figure 24: South America Home Entertainment Product Market Volume (Billion), by Country 2024 & 2032
- Figure 25: South America Home Entertainment Product Market Revenue Share (%), by Country 2024 & 2032
- Figure 26: South America Home Entertainment Product Market Volume Share (%), by Country 2024 & 2032
- Figure 27: Europe Home Entertainment Product Market Revenue (Million), by Device 2024 & 2032
- Figure 28: Europe Home Entertainment Product Market Volume (Billion), by Device 2024 & 2032
- Figure 29: Europe Home Entertainment Product Market Revenue Share (%), by Device 2024 & 2032
- Figure 30: Europe Home Entertainment Product Market Volume Share (%), by Device 2024 & 2032
- Figure 31: Europe Home Entertainment Product Market Revenue (Million), by Distribution Channel 2024 & 2032
- Figure 32: Europe Home Entertainment Product Market Volume (Billion), by Distribution Channel 2024 & 2032
- Figure 33: Europe Home Entertainment Product Market Revenue Share (%), by Distribution Channel 2024 & 2032
- Figure 34: Europe Home Entertainment Product Market Volume Share (%), by Distribution Channel 2024 & 2032
- Figure 35: Europe Home Entertainment Product Market Revenue (Million), by Country 2024 & 2032
- Figure 36: Europe Home Entertainment Product Market Volume (Billion), by Country 2024 & 2032
- Figure 37: Europe Home Entertainment Product Market Revenue Share (%), by Country 2024 & 2032
- Figure 38: Europe Home Entertainment Product Market Volume Share (%), by Country 2024 & 2032
- Figure 39: Middle East & Africa Home Entertainment Product Market Revenue (Million), by Device 2024 & 2032
- Figure 40: Middle East & Africa Home Entertainment Product Market Volume (Billion), by Device 2024 & 2032
- Figure 41: Middle East & Africa Home Entertainment Product Market Revenue Share (%), by Device 2024 & 2032
- Figure 42: Middle East & Africa Home Entertainment Product Market Volume Share (%), by Device 2024 & 2032
- Figure 43: Middle East & Africa Home Entertainment Product Market Revenue (Million), by Distribution Channel 2024 & 2032
- Figure 44: Middle East & Africa Home Entertainment Product Market Volume (Billion), by Distribution Channel 2024 & 2032
- Figure 45: Middle East & Africa Home Entertainment Product Market Revenue Share (%), by Distribution Channel 2024 & 2032
- Figure 46: Middle East & Africa Home Entertainment Product Market Volume Share (%), by Distribution Channel 2024 & 2032
- Figure 47: Middle East & Africa Home Entertainment Product Market Revenue (Million), by Country 2024 & 2032
- Figure 48: Middle East & Africa Home Entertainment Product Market Volume (Billion), by Country 2024 & 2032
- Figure 49: Middle East & Africa Home Entertainment Product Market Revenue Share (%), by Country 2024 & 2032
- Figure 50: Middle East & Africa Home Entertainment Product Market Volume Share (%), by Country 2024 & 2032
- Figure 51: Asia Pacific Home Entertainment Product Market Revenue (Million), by Device 2024 & 2032
- Figure 52: Asia Pacific Home Entertainment Product Market Volume (Billion), by Device 2024 & 2032
- Figure 53: Asia Pacific Home Entertainment Product Market Revenue Share (%), by Device 2024 & 2032
- Figure 54: Asia Pacific Home Entertainment Product Market Volume Share (%), by Device 2024 & 2032
- Figure 55: Asia Pacific Home Entertainment Product Market Revenue (Million), by Distribution Channel 2024 & 2032
- Figure 56: Asia Pacific Home Entertainment Product Market Volume (Billion), by Distribution Channel 2024 & 2032
- Figure 57: Asia Pacific Home Entertainment Product Market Revenue Share (%), by Distribution Channel 2024 & 2032
- Figure 58: Asia Pacific Home Entertainment Product Market Volume Share (%), by Distribution Channel 2024 & 2032
- Figure 59: Asia Pacific Home Entertainment Product Market Revenue (Million), by Country 2024 & 2032
- Figure 60: Asia Pacific Home Entertainment Product Market Volume (Billion), by Country 2024 & 2032
- Figure 61: Asia Pacific Home Entertainment Product Market Revenue Share (%), by Country 2024 & 2032
- Figure 62: Asia Pacific Home Entertainment Product Market Volume Share (%), by Country 2024 & 2032
List of Tables
- Table 1: Global Home Entertainment Product Market Revenue Million Forecast, by Region 2019 & 2032
- Table 2: Global Home Entertainment Product Market Volume Billion Forecast, by Region 2019 & 2032
- Table 3: Global Home Entertainment Product Market Revenue Million Forecast, by Device 2019 & 2032
- Table 4: Global Home Entertainment Product Market Volume Billion Forecast, by Device 2019 & 2032
- Table 5: Global Home Entertainment Product Market Revenue Million Forecast, by Distribution Channel 2019 & 2032
- Table 6: Global Home Entertainment Product Market Volume Billion Forecast, by Distribution Channel 2019 & 2032
- Table 7: Global Home Entertainment Product Market Revenue Million Forecast, by Region 2019 & 2032
- Table 8: Global Home Entertainment Product Market Volume Billion Forecast, by Region 2019 & 2032
- Table 9: Global Home Entertainment Product Market Revenue Million Forecast, by Device 2019 & 2032
- Table 10: Global Home Entertainment Product Market Volume Billion Forecast, by Device 2019 & 2032
- Table 11: Global Home Entertainment Product Market Revenue Million Forecast, by Distribution Channel 2019 & 2032
- Table 12: Global Home Entertainment Product Market Volume Billion Forecast, by Distribution Channel 2019 & 2032
- Table 13: Global Home Entertainment Product Market Revenue Million Forecast, by Country 2019 & 2032
- Table 14: Global Home Entertainment Product Market Volume Billion Forecast, by Country 2019 & 2032
- Table 15: United States Home Entertainment Product Market Revenue (Million) Forecast, by Application 2019 & 2032
- Table 16: United States Home Entertainment Product Market Volume (Billion) Forecast, by Application 2019 & 2032
- Table 17: Canada Home Entertainment Product Market Revenue (Million) Forecast, by Application 2019 & 2032
- Table 18: Canada Home Entertainment Product Market Volume (Billion) Forecast, by Application 2019 & 2032
- Table 19: Mexico Home Entertainment Product Market Revenue (Million) Forecast, by Application 2019 & 2032
- Table 20: Mexico Home Entertainment Product Market Volume (Billion) Forecast, by Application 2019 & 2032
- Table 21: Global Home Entertainment Product Market Revenue Million Forecast, by Device 2019 & 2032
- Table 22: Global Home Entertainment Product Market Volume Billion Forecast, by Device 2019 & 2032
- Table 23: Global Home Entertainment Product Market Revenue Million Forecast, by Distribution Channel 2019 & 2032
- Table 24: Global Home Entertainment Product Market Volume Billion Forecast, by Distribution Channel 2019 & 2032
- Table 25: Global Home Entertainment Product Market Revenue Million Forecast, by Country 2019 & 2032
- Table 26: Global Home Entertainment Product Market Volume Billion Forecast, by Country 2019 & 2032
- Table 27: Brazil Home Entertainment Product Market Revenue (Million) Forecast, by Application 2019 & 2032
- Table 28: Brazil Home Entertainment Product Market Volume (Billion) Forecast, by Application 2019 & 2032
- Table 29: Argentina Home Entertainment Product Market Revenue (Million) Forecast, by Application 2019 & 2032
- Table 30: Argentina Home Entertainment Product Market Volume (Billion) Forecast, by Application 2019 & 2032
- Table 31: Rest of South America Home Entertainment Product Market Revenue (Million) Forecast, by Application 2019 & 2032
- Table 32: Rest of South America Home Entertainment Product Market Volume (Billion) Forecast, by Application 2019 & 2032
- Table 33: Global Home Entertainment Product Market Revenue Million Forecast, by Device 2019 & 2032
- Table 34: Global Home Entertainment Product Market Volume Billion Forecast, by Device 2019 & 2032
- Table 35: Global Home Entertainment Product Market Revenue Million Forecast, by Distribution Channel 2019 & 2032
- Table 36: Global Home Entertainment Product Market Volume Billion Forecast, by Distribution Channel 2019 & 2032
- Table 37: Global Home Entertainment Product Market Revenue Million Forecast, by Country 2019 & 2032
- Table 38: Global Home Entertainment Product Market Volume Billion Forecast, by Country 2019 & 2032
- Table 39: United Kingdom Home Entertainment Product Market Revenue (Million) Forecast, by Application 2019 & 2032
- Table 40: United Kingdom Home Entertainment Product Market Volume (Billion) Forecast, by Application 2019 & 2032
- Table 41: Germany Home Entertainment Product Market Revenue (Million) Forecast, by Application 2019 & 2032
- Table 42: Germany Home Entertainment Product Market Volume (Billion) Forecast, by Application 2019 & 2032
- Table 43: France Home Entertainment Product Market Revenue (Million) Forecast, by Application 2019 & 2032
- Table 44: France Home Entertainment Product Market Volume (Billion) Forecast, by Application 2019 & 2032
- Table 45: Italy Home Entertainment Product Market Revenue (Million) Forecast, by Application 2019 & 2032
- Table 46: Italy Home Entertainment Product Market Volume (Billion) Forecast, by Application 2019 & 2032
- Table 47: Spain Home Entertainment Product Market Revenue (Million) Forecast, by Application 2019 & 2032
- Table 48: Spain Home Entertainment Product Market Volume (Billion) Forecast, by Application 2019 & 2032
- Table 49: Russia Home Entertainment Product Market Revenue (Million) Forecast, by Application 2019 & 2032
- Table 50: Russia Home Entertainment Product Market Volume (Billion) Forecast, by Application 2019 & 2032
- Table 51: Benelux Home Entertainment Product Market Revenue (Million) Forecast, by Application 2019 & 2032
- Table 52: Benelux Home Entertainment Product Market Volume (Billion) Forecast, by Application 2019 & 2032
- Table 53: Nordics Home Entertainment Product Market Revenue (Million) Forecast, by Application 2019 & 2032
- Table 54: Nordics Home Entertainment Product Market Volume (Billion) Forecast, by Application 2019 & 2032
- Table 55: Rest of Europe Home Entertainment Product Market Revenue (Million) Forecast, by Application 2019 & 2032
- Table 56: Rest of Europe Home Entertainment Product Market Volume (Billion) Forecast, by Application 2019 & 2032
- Table 57: Global Home Entertainment Product Market Revenue Million Forecast, by Device 2019 & 2032
- Table 58: Global Home Entertainment Product Market Volume Billion Forecast, by Device 2019 & 2032
- Table 59: Global Home Entertainment Product Market Revenue Million Forecast, by Distribution Channel 2019 & 2032
- Table 60: Global Home Entertainment Product Market Volume Billion Forecast, by Distribution Channel 2019 & 2032
- Table 61: Global Home Entertainment Product Market Revenue Million Forecast, by Country 2019 & 2032
- Table 62: Global Home Entertainment Product Market Volume Billion Forecast, by Country 2019 & 2032
- Table 63: Turkey Home Entertainment Product Market Revenue (Million) Forecast, by Application 2019 & 2032
- Table 64: Turkey Home Entertainment Product Market Volume (Billion) Forecast, by Application 2019 & 2032
- Table 65: Israel Home Entertainment Product Market Revenue (Million) Forecast, by Application 2019 & 2032
- Table 66: Israel Home Entertainment Product Market Volume (Billion) Forecast, by Application 2019 & 2032
- Table 67: GCC Home Entertainment Product Market Revenue (Million) Forecast, by Application 2019 & 2032
- Table 68: GCC Home Entertainment Product Market Volume (Billion) Forecast, by Application 2019 & 2032
- Table 69: North Africa Home Entertainment Product Market Revenue (Million) Forecast, by Application 2019 & 2032
- Table 70: North Africa Home Entertainment Product Market Volume (Billion) Forecast, by Application 2019 & 2032
- Table 71: South Africa Home Entertainment Product Market Revenue (Million) Forecast, by Application 2019 & 2032
- Table 72: South Africa Home Entertainment Product Market Volume (Billion) Forecast, by Application 2019 & 2032
- Table 73: Rest of Middle East & Africa Home Entertainment Product Market Revenue (Million) Forecast, by Application 2019 & 2032
- Table 74: Rest of Middle East & Africa Home Entertainment Product Market Volume (Billion) Forecast, by Application 2019 & 2032
- Table 75: Global Home Entertainment Product Market Revenue Million Forecast, by Device 2019 & 2032
- Table 76: Global Home Entertainment Product Market Volume Billion Forecast, by Device 2019 & 2032
- Table 77: Global Home Entertainment Product Market Revenue Million Forecast, by Distribution Channel 2019 & 2032
- Table 78: Global Home Entertainment Product Market Volume Billion Forecast, by Distribution Channel 2019 & 2032
- Table 79: Global Home Entertainment Product Market Revenue Million Forecast, by Country 2019 & 2032
- Table 80: Global Home Entertainment Product Market Volume Billion Forecast, by Country 2019 & 2032
- Table 81: China Home Entertainment Product Market Revenue (Million) Forecast, by Application 2019 & 2032
- Table 82: China Home Entertainment Product Market Volume (Billion) Forecast, by Application 2019 & 2032
- Table 83: India Home Entertainment Product Market Revenue (Million) Forecast, by Application 2019 & 2032
- Table 84: India Home Entertainment Product Market Volume (Billion) Forecast, by Application 2019 & 2032
- Table 85: Japan Home Entertainment Product Market Revenue (Million) Forecast, by Application 2019 & 2032
- Table 86: Japan Home Entertainment Product Market Volume (Billion) Forecast, by Application 2019 & 2032
- Table 87: South Korea Home Entertainment Product Market Revenue (Million) Forecast, by Application 2019 & 2032
- Table 88: South Korea Home Entertainment Product Market Volume (Billion) Forecast, by Application 2019 & 2032
- Table 89: ASEAN Home Entertainment Product Market Revenue (Million) Forecast, by Application 2019 & 2032
- Table 90: ASEAN Home Entertainment Product Market Volume (Billion) Forecast, by Application 2019 & 2032
- Table 91: Oceania Home Entertainment Product Market Revenue (Million) Forecast, by Application 2019 & 2032
- Table 92: Oceania Home Entertainment Product Market Volume (Billion) Forecast, by Application 2019 & 2032
- Table 93: Rest of Asia Pacific Home Entertainment Product Market Revenue (Million) Forecast, by Application 2019 & 2032
- Table 94: Rest of Asia Pacific Home Entertainment Product Market Volume (Billion) Forecast, by Application 2019 & 2032
Frequently Asked Questions
1. What is the projected Compound Annual Growth Rate (CAGR) of the Home Entertainment Product Market?
The projected CAGR is approximately 4.80%.
2. Which companies are prominent players in the Home Entertainment Product Market?
Key companies in the market include Samsung Electronics, Panasonic Corporation, Sony Corporation, Microsoft Corporation, LG Electronics, Apple Inc, Bose Corporation, Haier Inc, Koninklijke Philips N V, Mitsubishi Electric Corporation*List Not Exhaustive.
3. What are the main segments of the Home Entertainment Product Market?
The market segments include Device, Distribution Channel.
4. Can you provide details about the market size?
The market size is estimated to be USD 308.60 Million as of 2022.
5. What are some drivers contributing to market growth?
Rising Popularity of IoT Connected Devices; Growing Number of Gaming Population Globally.
6. What are the notable trends driving market growth?
Gaming Consoles Gaining Popularity.
7. Are there any restraints impacting market growth?
Rising Popularity of IoT Connected Devices; Growing Number of Gaming Population Globally.
8. Can you provide examples of recent developments in the market?
July 2024: Evolution Malta Holding Limited, a wholly-owned subsidiary of Evolution AB (publ), signed an agreement to acquire Galaxy Gaming Inc. This move aligns with Evolution's strategy to become the world's premier provider of casino games, delivering top-tier gaming content to its clientele. By acquiring Galaxy Gaming, Evolution strengthens its foothold in the US market and bolsters its status as a dominant licensor of proprietary table games within the online gaming sector.May 2024: ASUS revealed plans to unveil its ROG Ally X handheld gaming console on June 2. Similar to its predecessor, the ROG Ally, the new X edition will run on the Windows 11 platform and be driven by the AMD Z1 Extreme chipset. In addition, ASUS has stated that the console will feature a 7-inch LCD display with a 120Hz refresh rate and will be available in a sleek black finish.April 2024: Sony is renewing BRAVIA as a brand for watching movies to enrich the ultimate home cinema experience. With the expansion of streaming services, watching movies in the comfort of the home has gained in popularity. Sony’s wide variety of products, such as digital cinema cameras, professional monitors, and professional headphones, have been widely utilized by film production professionals, allowing the company to deeply understand the cinema industry and the intentions of filmmakers and content creators. New BRAVIA further enhances the sense of reality of cinematic content and delivers outstanding picture and sound quality at home so that people can enjoy films with much of the same magic of the big screen.February 2024: Walmart, the US-based retail giant, announced its acquisition of smart TV manufacturer Vizio for a whopping USD 2.3 billion. Historically, Walmart has been a significant retailer of Vizio TVs. With this acquisition, Walmart aims to leverage "a profitable advertising business that is rapidly scaling via Vizio SmartCast OS," as stated by the company.
9. What pricing options are available for accessing the report?
Pricing options include single-user, multi-user, and enterprise licenses priced at USD 3800, USD 4500, and USD 5800 respectively.
10. Is the market size provided in terms of value or volume?
The market size is provided in terms of value, measured in Million and volume, measured in Billion.
11. Are there any specific market keywords associated with the report?
Yes, the market keyword associated with the report is "Home Entertainment Product Market," which aids in identifying and referencing the specific market segment covered.
12. How do I determine which pricing option suits my needs best?
The pricing options vary based on user requirements and access needs. Individual users may opt for single-user licenses, while businesses requiring broader access may choose multi-user or enterprise licenses for cost-effective access to the report.
13. Are there any additional resources or data provided in the Home Entertainment Product Market report?
While the report offers comprehensive insights, it's advisable to review the specific contents or supplementary materials provided to ascertain if additional resources or data are available.
14. How can I stay updated on further developments or reports in the Home Entertainment Product Market?
To stay informed about further developments, trends, and reports in the Home Entertainment Product Market, consider subscribing to industry newsletters, following relevant companies and organizations, or regularly checking reputable industry news sources and publications.
Methodology
Step 1 - Identification of Relevant Samples Size from Population Database


Step 2 - Approaches for Defining Global Market Size (Value, Volume* & Price*)

Note*: In applicable scenarios
Step 3 - Data Sources
Primary Research
- Web Analytics
- Survey Reports
- Research Institute
- Latest Research Reports
- Opinion Leaders
Secondary Research
- Annual Reports
- White Paper
- Latest Press Release
- Industry Association
- Paid Database
- Investor Presentations

Step 4 - Data Triangulation
Involves using different sources of information in order to increase the validity of a study
These sources are likely to be stakeholders in a program - participants, other researchers, program staff, other community members, and so on.
Then we put all data in single framework & apply various statistical tools to find out the dynamic on the market.
During the analysis stage, feedback from the stakeholder groups would be compared to determine areas of agreement as well as areas of divergence
