

Key Insights
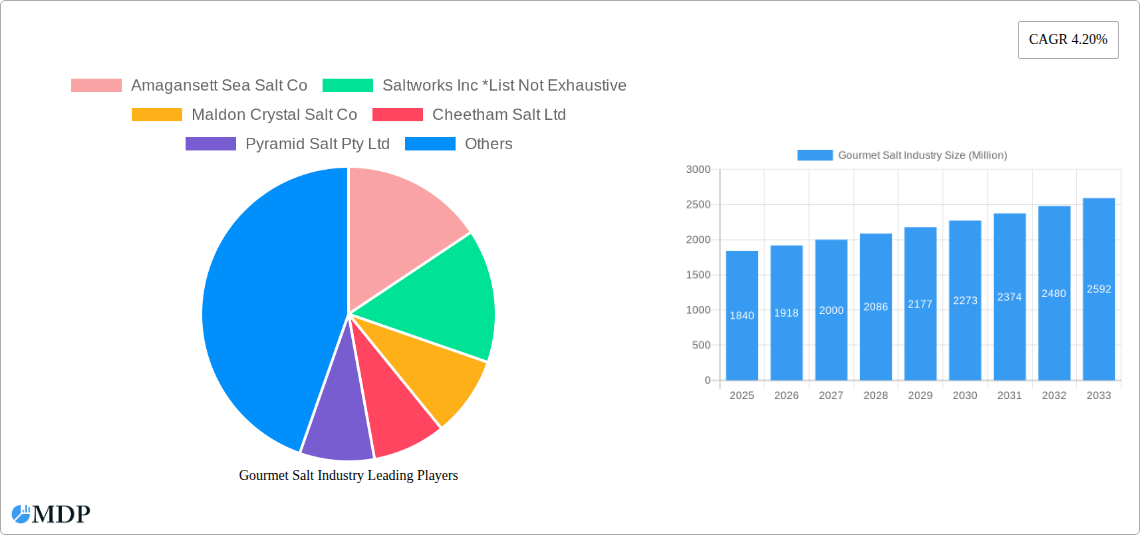
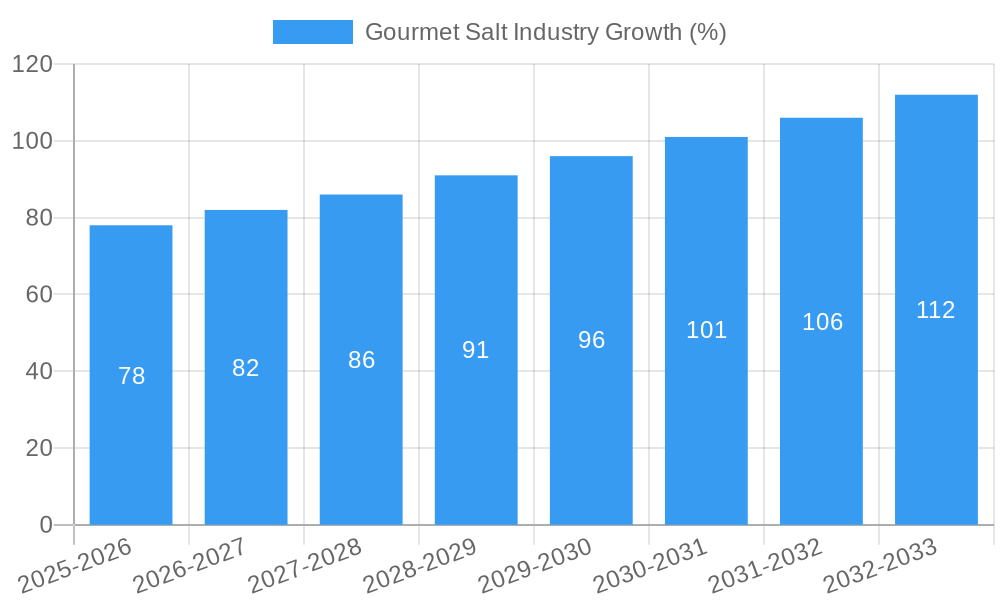
The gourmet salt market, valued at $1.84 billion in 2025, is projected to experience steady growth, driven by increasing consumer demand for premium culinary ingredients and a rising interest in health-conscious food choices. The market's Compound Annual Growth Rate (CAGR) of 4.20% from 2019-2033 reflects this sustained expansion. Key drivers include the growing popularity of gourmet cooking, both at home and in professional kitchens, along with the increasing awareness of the impact of mineral content and taste variations among different salt types. Consumers are increasingly seeking out specialty salts like Himalayan pink salt, Fleur de sel, and Sel Gris for their unique flavors and perceived health benefits, fueling market segmentation growth. The confectionery and food service sectors represent significant application areas, but growth is also observed in the bakery and meat & poultry segments due to the enhanced flavor profiles these salts provide. While competitive pressures from established players like Cargill and Morton Salt exist, smaller artisanal producers are thriving by offering unique, locally-sourced, and sustainably harvested options. This trend reflects a broader consumer preference for transparency and ethical sourcing in the food industry. Challenges include price volatility in raw materials and potential fluctuations in consumer spending habits during economic downturns. However, the overall market outlook remains positive, fueled by consistent demand and ongoing innovation within the gourmet salt sector.
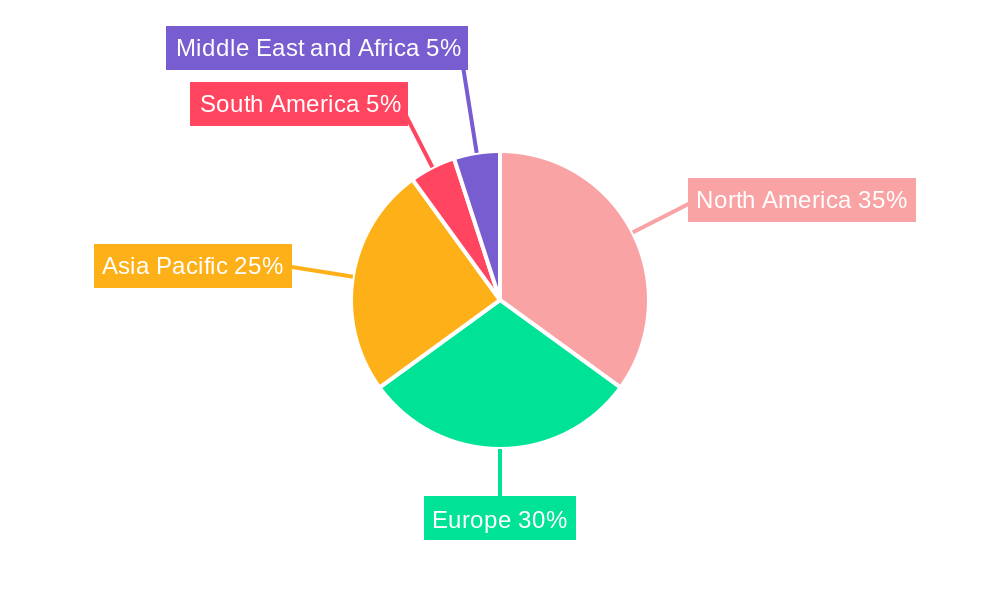
The regional landscape reveals a diverse distribution of market share, with North America and Europe currently dominating. However, emerging economies in Asia Pacific and South America are expected to witness significant growth in the coming years, driven by rising disposable incomes and evolving culinary preferences. The market is segmented by type (Sel Gris, Flakey Salt, Himalayan Salt, Fleur de sel, Specialty Salt, Other Types) and application (Confectionary, Bakery, Meat and Poultry, Sea Food, Sauces and Savories, Other Applications), with each segment offering distinct growth opportunities. Strategic partnerships, product diversification, and investments in sustainable production practices will be critical for companies to maintain a competitive edge in this dynamic market. The forecast period of 2025-2033 presents significant potential for market expansion, underpinned by consistent consumer demand for high-quality, flavorful, and ethically sourced gourmet salts.
Gourmet Salt Industry Market Report: 2019-2033 Forecast
This comprehensive report provides an in-depth analysis of the gourmet salt industry, projecting a market valuation of $XX Million by 2033. It offers actionable insights for industry stakeholders, including manufacturers, distributors, and investors, based on a meticulous study of market dynamics, leading players, and emerging trends. The report covers the period 2019-2033, with 2025 as the base and estimated year. This analysis leverages data from the historical period (2019-2024) to forecast market growth from 2025 to 2033.
Gourmet Salt Industry Market Dynamics & Concentration
The gourmet salt market, valued at $XX Million in 2025, is characterized by a moderately concentrated landscape with several key players commanding significant market share. While exact figures are proprietary to the full report, companies like Cargill Inc and Morton Salt Inc hold substantial positions, while smaller, specialized producers like Amagansett Sea Salt Co and Maldon Crystal Salt Co cater to niche segments. The market is driven by increasing consumer demand for premium and specialty salts, fueled by evolving culinary trends and health consciousness. Innovation plays a crucial role, with companies investing in unique product offerings like Himalayan pink salt and flavored salts. Regulatory frameworks concerning food safety and labeling influence production and marketing. Product substitutes, such as simple table salt, exert some competitive pressure, though gourmet salts generally offer distinct taste profiles and perceived health benefits. End-user trends favor convenience and premiumization, driving demand for pre-portioned and uniquely packaged products. Mergers and acquisitions (M&A) activity remains relatively moderate, with a recorded xx M&A deals in the past five years, indicating a mix of organic growth and strategic consolidation.
Gourmet Salt Industry Industry Trends & Analysis
The gourmet salt market exhibits a robust Compound Annual Growth Rate (CAGR) of xx% during the forecast period (2025-2033). This growth is driven by several key factors. Firstly, rising disposable incomes, particularly in developing economies, are increasing consumer spending on premium food products. Secondly, the growing popularity of gourmet cooking and artisanal food products fuels the demand for high-quality ingredients. Furthermore, health-conscious consumers are increasingly seeking natural and minimally processed salts, boosting the market for Himalayan salt and sea salts. Technological advancements, such as improved harvesting techniques and advanced packaging solutions, enhance product quality and shelf life. Competitive dynamics are shaped by both established players investing in new product lines and smaller, artisanal producers emphasizing unique flavors and regional sourcing. Market penetration of gourmet salts is steadily increasing across various food segments, with particular success in the confectionary and restaurant sectors.
Leading Markets & Segments in Gourmet Salt Industry
The gourmet salt market exhibits regional variations, with developed economies showing higher per capita consumption. However, emerging markets present significant growth potential due to expanding middle classes. Within segments, Himalayan salt and Fleur de sel are currently high-growth segments.
Key Drivers by Segment:
- By Type:
- Himalayan Salt: Growing consumer awareness of its purported health benefits and unique pink color drives demand.
- Fleur de sel: Its delicate flavor and high price point appeal to high-end consumers.
- Flaked Salt: Versatility in culinary applications drives consistent growth.
- By Application:
- Confectionary: Gourmet salts are increasingly used to enhance the taste and texture of sweets.
- Sauces and Savories: Demand is driven by the need for unique flavor profiles in restaurant and home cooking.
Market dominance is influenced by factors like strong distribution networks, brand recognition and successful marketing strategies.
Gourmet Salt Industry Product Developments
Recent product innovations underscore the industry's focus on diversification and value-added offerings. Cargill's launch of purified sea salt flour exemplifies the drive towards functional ingredients for processed foods. Saltworks' investment in B2B e-commerce tools highlights the importance of streamlined distribution and improved customer experience. Morton Salt's Himalayan Pink Salt expansion broadens its product portfolio to tap into growing consumer demand for natural and visually appealing products. These developments reflect the industry's dynamic nature and its responsiveness to evolving consumer preferences and technological advancements.
Key Drivers of Gourmet Salt Industry Growth
The gourmet salt market's expansion is fueled by several interconnected factors: rising consumer disposable incomes creating greater spending power on premium food items; escalating demand for natural and healthy food products; and the flourishing culinary scene, with chefs and home cooks actively seeking unique flavor profiles. Technological improvements in salt harvesting and processing contribute to efficient production and higher product quality. Lastly, favorable regulatory environments promoting food safety and transparency support growth.
Challenges in the Gourmet Salt Industry Market
Challenges to the industry's growth include intense competition from both established players and smaller artisanal producers. Fluctuations in raw material prices, particularly for specialized salts from specific regions, create cost pressures. Maintaining consistent supply chain efficiency poses a challenge due to varying harvest seasons and geographical sourcing constraints. Regulatory compliance concerning food safety and labeling adds to operational costs.
Emerging Opportunities in Gourmet Salt Industry
Long-term growth potential lies in strategic partnerships with food manufacturers to develop innovative product applications. Exploring new markets, particularly in developing economies, presents a significant opportunity for expansion. Investing in research and development to create novel salt varieties, incorporating functional ingredients or sustainable harvesting methods, will further strengthen market positioning and drive innovation.
Leading Players in the Gourmet Salt Industry Sector
- Amagansett Sea Salt Co
- Saltworks Inc
- Maldon Crystal Salt Co
- Cheetham Salt Ltd
- Pyramid Salt Pty Ltd
- Alaska Pure Sea Salt Co
- Murray River Salt
- Cargill Inc
- Morton Salt Inc
- Kalahari Pristine Salt Worx
Key Milestones in Gourmet Salt Industry Industry
- September 2019: Morton Salt launches All-Natural Himalayan Pink Salt, expanding its product line and tapping into a growing market segment.
- April 2020: SaltWorks implements new B2B eCommerce tools, enhancing customer experience and sales growth.
- January 2021: Cargill launches purified sea salt flour, targeting the processed food industry with a novel, fine-grained ingredient.
Strategic Outlook for Gourmet Salt Industry Market
The gourmet salt market presents a promising outlook, driven by continuous innovation and the ongoing consumer preference for high-quality, flavorful, and health-conscious food options. Strategic investments in research and development, expansion into new markets, and the exploration of strategic partnerships will be key to capturing significant market share in the years to come. The market is predicted to reach $XX Million by 2033, representing a substantial increase from its current valuation.
Gourmet Salt Industry Segmentation
-
1. Type
- 1.1. Sel Gris
- 1.2. Flakey Salt
- 1.3. Himalayan Salt
- 1.4. Fleur de sel
- 1.5. Specialty Salt
- 1.6. Other Types
-
2. Application
- 2.1. Confectionary
- 2.2. Bakery
- 2.3. Meat and Poultry
- 2.4. Sea Food
- 2.5. Sauces and Savories
- 2.6. Other Applications
Gourmet Salt Industry Segmentation By Geography
-
1. North America
- 1.1. United States
- 1.2. Canada
- 1.3. Mexico
- 1.4. Rest of North America
-
2. Europe
- 2.1. United Kingdom
- 2.2. Germany
- 2.3. France
- 2.4. Russia
- 2.5. Italy
- 2.6. Spain
- 2.7. Rest of Europe
-
3. Asia Pacific
- 3.1. India
- 3.2. China
- 3.3. Japan
- 3.4. Australia
- 3.5. Rest of Asia Pacific
-
4. South America
- 4.1. Brazil
- 4.2. Argentina
- 4.3. Rest of South America
-
5. Middle East and Africa
- 5.1. South Africa
- 5.2. United Arab Emirates
- 5.3. Rest of Middle East and Africa
Gourmet Salt Industry REPORT HIGHLIGHTS
| Aspects | Details |
|---|---|
| Study Period | 2019-2033 |
| Base Year | 2024 |
| Estimated Year | 2025 |
| Forecast Period | 2025-2033 |
| Historical Period | 2019-2024 |
| Growth Rate | CAGR of 4.20% from 2019-2033 |
| Segmentation |
|
Table of Contents
- 1. Introduction
- 1.1. Research Scope
- 1.2. Market Segmentation
- 1.3. Research Methodology
- 1.4. Definitions and Assumptions
- 2. Executive Summary
- 2.1. Introduction
- 3. Market Dynamics
- 3.1. Introduction
- 3.2. Market Drivers
- 3.2.1. Escalating Demand for Processed Poultry Products; Favorable Government Initiatives to Boost Production
- 3.3. Market Restrains
- 3.3.1. Rising Vegan Trend among Young Consumers; Deeper Penetration of Red Meat Across Saudi Arabia
- 3.4. Market Trends
- 3.4.1. Growing Demand from the Food Service Industry
- 4. Market Factor Analysis
- 4.1. Porters Five Forces
- 4.2. Supply/Value Chain
- 4.3. PESTEL analysis
- 4.4. Market Entropy
- 4.5. Patent/Trademark Analysis
- 5. Global Gourmet Salt Industry Analysis, Insights and Forecast, 2019-2031
- 5.1. Market Analysis, Insights and Forecast - by Type
- 5.1.1. Sel Gris
- 5.1.2. Flakey Salt
- 5.1.3. Himalayan Salt
- 5.1.4. Fleur de sel
- 5.1.5. Specialty Salt
- 5.1.6. Other Types
- 5.2. Market Analysis, Insights and Forecast - by Application
- 5.2.1. Confectionary
- 5.2.2. Bakery
- 5.2.3. Meat and Poultry
- 5.2.4. Sea Food
- 5.2.5. Sauces and Savories
- 5.2.6. Other Applications
- 5.3. Market Analysis, Insights and Forecast - by Region
- 5.3.1. North America
- 5.3.2. Europe
- 5.3.3. Asia Pacific
- 5.3.4. South America
- 5.3.5. Middle East and Africa
- 5.1. Market Analysis, Insights and Forecast - by Type
- 6. North America Gourmet Salt Industry Analysis, Insights and Forecast, 2019-2031
- 6.1. Market Analysis, Insights and Forecast - by Type
- 6.1.1. Sel Gris
- 6.1.2. Flakey Salt
- 6.1.3. Himalayan Salt
- 6.1.4. Fleur de sel
- 6.1.5. Specialty Salt
- 6.1.6. Other Types
- 6.2. Market Analysis, Insights and Forecast - by Application
- 6.2.1. Confectionary
- 6.2.2. Bakery
- 6.2.3. Meat and Poultry
- 6.2.4. Sea Food
- 6.2.5. Sauces and Savories
- 6.2.6. Other Applications
- 6.1. Market Analysis, Insights and Forecast - by Type
- 7. Europe Gourmet Salt Industry Analysis, Insights and Forecast, 2019-2031
- 7.1. Market Analysis, Insights and Forecast - by Type
- 7.1.1. Sel Gris
- 7.1.2. Flakey Salt
- 7.1.3. Himalayan Salt
- 7.1.4. Fleur de sel
- 7.1.5. Specialty Salt
- 7.1.6. Other Types
- 7.2. Market Analysis, Insights and Forecast - by Application
- 7.2.1. Confectionary
- 7.2.2. Bakery
- 7.2.3. Meat and Poultry
- 7.2.4. Sea Food
- 7.2.5. Sauces and Savories
- 7.2.6. Other Applications
- 7.1. Market Analysis, Insights and Forecast - by Type
- 8. Asia Pacific Gourmet Salt Industry Analysis, Insights and Forecast, 2019-2031
- 8.1. Market Analysis, Insights and Forecast - by Type
- 8.1.1. Sel Gris
- 8.1.2. Flakey Salt
- 8.1.3. Himalayan Salt
- 8.1.4. Fleur de sel
- 8.1.5. Specialty Salt
- 8.1.6. Other Types
- 8.2. Market Analysis, Insights and Forecast - by Application
- 8.2.1. Confectionary
- 8.2.2. Bakery
- 8.2.3. Meat and Poultry
- 8.2.4. Sea Food
- 8.2.5. Sauces and Savories
- 8.2.6. Other Applications
- 8.1. Market Analysis, Insights and Forecast - by Type
- 9. South America Gourmet Salt Industry Analysis, Insights and Forecast, 2019-2031
- 9.1. Market Analysis, Insights and Forecast - by Type
- 9.1.1. Sel Gris
- 9.1.2. Flakey Salt
- 9.1.3. Himalayan Salt
- 9.1.4. Fleur de sel
- 9.1.5. Specialty Salt
- 9.1.6. Other Types
- 9.2. Market Analysis, Insights and Forecast - by Application
- 9.2.1. Confectionary
- 9.2.2. Bakery
- 9.2.3. Meat and Poultry
- 9.2.4. Sea Food
- 9.2.5. Sauces and Savories
- 9.2.6. Other Applications
- 9.1. Market Analysis, Insights and Forecast - by Type
- 10. Middle East and Africa Gourmet Salt Industry Analysis, Insights and Forecast, 2019-2031
- 10.1. Market Analysis, Insights and Forecast - by Type
- 10.1.1. Sel Gris
- 10.1.2. Flakey Salt
- 10.1.3. Himalayan Salt
- 10.1.4. Fleur de sel
- 10.1.5. Specialty Salt
- 10.1.6. Other Types
- 10.2. Market Analysis, Insights and Forecast - by Application
- 10.2.1. Confectionary
- 10.2.2. Bakery
- 10.2.3. Meat and Poultry
- 10.2.4. Sea Food
- 10.2.5. Sauces and Savories
- 10.2.6. Other Applications
- 10.1. Market Analysis, Insights and Forecast - by Type
- 11. North America Gourmet Salt Industry Analysis, Insights and Forecast, 2019-2031
- 11.1. Market Analysis, Insights and Forecast - By Country/Sub-region
- 11.1.1 United States
- 11.1.2 Canada
- 11.1.3 Mexico
- 11.1.4 Rest of North America
- 12. Europe Gourmet Salt Industry Analysis, Insights and Forecast, 2019-2031
- 12.1. Market Analysis, Insights and Forecast - By Country/Sub-region
- 12.1.1 United Kingdom
- 12.1.2 Germany
- 12.1.3 France
- 12.1.4 Russia
- 12.1.5 Italy
- 12.1.6 Spain
- 12.1.7 Rest of Europe
- 13. Asia Pacific Gourmet Salt Industry Analysis, Insights and Forecast, 2019-2031
- 13.1. Market Analysis, Insights and Forecast - By Country/Sub-region
- 13.1.1 India
- 13.1.2 China
- 13.1.3 Japan
- 13.1.4 Australia
- 13.1.5 Rest of Asia Pacific
- 14. South America Gourmet Salt Industry Analysis, Insights and Forecast, 2019-2031
- 14.1. Market Analysis, Insights and Forecast - By Country/Sub-region
- 14.1.1 Brazil
- 14.1.2 Argentina
- 14.1.3 Rest of South America
- 15. Middle East and Africa Gourmet Salt Industry Analysis, Insights and Forecast, 2019-2031
- 15.1. Market Analysis, Insights and Forecast - By Country/Sub-region
- 15.1.1 South Africa
- 15.1.2 United Arab Emirates
- 15.1.3 Rest of Middle East and Africa
- 16. Competitive Analysis
- 16.1. Global Market Share Analysis 2024
- 16.2. Company Profiles
- 16.2.1 Amagansett Sea Salt Co
- 16.2.1.1. Overview
- 16.2.1.2. Products
- 16.2.1.3. SWOT Analysis
- 16.2.1.4. Recent Developments
- 16.2.1.5. Financials (Based on Availability)
- 16.2.2 Saltworks Inc *List Not Exhaustive
- 16.2.2.1. Overview
- 16.2.2.2. Products
- 16.2.2.3. SWOT Analysis
- 16.2.2.4. Recent Developments
- 16.2.2.5. Financials (Based on Availability)
- 16.2.3 Maldon Crystal Salt Co
- 16.2.3.1. Overview
- 16.2.3.2. Products
- 16.2.3.3. SWOT Analysis
- 16.2.3.4. Recent Developments
- 16.2.3.5. Financials (Based on Availability)
- 16.2.4 Cheetham Salt Ltd
- 16.2.4.1. Overview
- 16.2.4.2. Products
- 16.2.4.3. SWOT Analysis
- 16.2.4.4. Recent Developments
- 16.2.4.5. Financials (Based on Availability)
- 16.2.5 Pyramid Salt Pty Ltd
- 16.2.5.1. Overview
- 16.2.5.2. Products
- 16.2.5.3. SWOT Analysis
- 16.2.5.4. Recent Developments
- 16.2.5.5. Financials (Based on Availability)
- 16.2.6 Alaska Pure Sea Salt Co
- 16.2.6.1. Overview
- 16.2.6.2. Products
- 16.2.6.3. SWOT Analysis
- 16.2.6.4. Recent Developments
- 16.2.6.5. Financials (Based on Availability)
- 16.2.7 Murray River Salt
- 16.2.7.1. Overview
- 16.2.7.2. Products
- 16.2.7.3. SWOT Analysis
- 16.2.7.4. Recent Developments
- 16.2.7.5. Financials (Based on Availability)
- 16.2.8 Cargill Inc
- 16.2.8.1. Overview
- 16.2.8.2. Products
- 16.2.8.3. SWOT Analysis
- 16.2.8.4. Recent Developments
- 16.2.8.5. Financials (Based on Availability)
- 16.2.9 Morton Salt Inc
- 16.2.9.1. Overview
- 16.2.9.2. Products
- 16.2.9.3. SWOT Analysis
- 16.2.9.4. Recent Developments
- 16.2.9.5. Financials (Based on Availability)
- 16.2.10 Kalahari Pristine Salt Worx
- 16.2.10.1. Overview
- 16.2.10.2. Products
- 16.2.10.3. SWOT Analysis
- 16.2.10.4. Recent Developments
- 16.2.10.5. Financials (Based on Availability)
- 16.2.1 Amagansett Sea Salt Co
List of Figures
- Figure 1: Global Gourmet Salt Industry Revenue Breakdown (Million, %) by Region 2024 & 2032
- Figure 2: North America Gourmet Salt Industry Revenue (Million), by Country 2024 & 2032
- Figure 3: North America Gourmet Salt Industry Revenue Share (%), by Country 2024 & 2032
- Figure 4: Europe Gourmet Salt Industry Revenue (Million), by Country 2024 & 2032
- Figure 5: Europe Gourmet Salt Industry Revenue Share (%), by Country 2024 & 2032
- Figure 6: Asia Pacific Gourmet Salt Industry Revenue (Million), by Country 2024 & 2032
- Figure 7: Asia Pacific Gourmet Salt Industry Revenue Share (%), by Country 2024 & 2032
- Figure 8: South America Gourmet Salt Industry Revenue (Million), by Country 2024 & 2032
- Figure 9: South America Gourmet Salt Industry Revenue Share (%), by Country 2024 & 2032
- Figure 10: Middle East and Africa Gourmet Salt Industry Revenue (Million), by Country 2024 & 2032
- Figure 11: Middle East and Africa Gourmet Salt Industry Revenue Share (%), by Country 2024 & 2032
- Figure 12: North America Gourmet Salt Industry Revenue (Million), by Type 2024 & 2032
- Figure 13: North America Gourmet Salt Industry Revenue Share (%), by Type 2024 & 2032
- Figure 14: North America Gourmet Salt Industry Revenue (Million), by Application 2024 & 2032
- Figure 15: North America Gourmet Salt Industry Revenue Share (%), by Application 2024 & 2032
- Figure 16: North America Gourmet Salt Industry Revenue (Million), by Country 2024 & 2032
- Figure 17: North America Gourmet Salt Industry Revenue Share (%), by Country 2024 & 2032
- Figure 18: Europe Gourmet Salt Industry Revenue (Million), by Type 2024 & 2032
- Figure 19: Europe Gourmet Salt Industry Revenue Share (%), by Type 2024 & 2032
- Figure 20: Europe Gourmet Salt Industry Revenue (Million), by Application 2024 & 2032
- Figure 21: Europe Gourmet Salt Industry Revenue Share (%), by Application 2024 & 2032
- Figure 22: Europe Gourmet Salt Industry Revenue (Million), by Country 2024 & 2032
- Figure 23: Europe Gourmet Salt Industry Revenue Share (%), by Country 2024 & 2032
- Figure 24: Asia Pacific Gourmet Salt Industry Revenue (Million), by Type 2024 & 2032
- Figure 25: Asia Pacific Gourmet Salt Industry Revenue Share (%), by Type 2024 & 2032
- Figure 26: Asia Pacific Gourmet Salt Industry Revenue (Million), by Application 2024 & 2032
- Figure 27: Asia Pacific Gourmet Salt Industry Revenue Share (%), by Application 2024 & 2032
- Figure 28: Asia Pacific Gourmet Salt Industry Revenue (Million), by Country 2024 & 2032
- Figure 29: Asia Pacific Gourmet Salt Industry Revenue Share (%), by Country 2024 & 2032
- Figure 30: South America Gourmet Salt Industry Revenue (Million), by Type 2024 & 2032
- Figure 31: South America Gourmet Salt Industry Revenue Share (%), by Type 2024 & 2032
- Figure 32: South America Gourmet Salt Industry Revenue (Million), by Application 2024 & 2032
- Figure 33: South America Gourmet Salt Industry Revenue Share (%), by Application 2024 & 2032
- Figure 34: South America Gourmet Salt Industry Revenue (Million), by Country 2024 & 2032
- Figure 35: South America Gourmet Salt Industry Revenue Share (%), by Country 2024 & 2032
- Figure 36: Middle East and Africa Gourmet Salt Industry Revenue (Million), by Type 2024 & 2032
- Figure 37: Middle East and Africa Gourmet Salt Industry Revenue Share (%), by Type 2024 & 2032
- Figure 38: Middle East and Africa Gourmet Salt Industry Revenue (Million), by Application 2024 & 2032
- Figure 39: Middle East and Africa Gourmet Salt Industry Revenue Share (%), by Application 2024 & 2032
- Figure 40: Middle East and Africa Gourmet Salt Industry Revenue (Million), by Country 2024 & 2032
- Figure 41: Middle East and Africa Gourmet Salt Industry Revenue Share (%), by Country 2024 & 2032
List of Tables
- Table 1: Global Gourmet Salt Industry Revenue Million Forecast, by Region 2019 & 2032
- Table 2: Global Gourmet Salt Industry Revenue Million Forecast, by Type 2019 & 2032
- Table 3: Global Gourmet Salt Industry Revenue Million Forecast, by Application 2019 & 2032
- Table 4: Global Gourmet Salt Industry Revenue Million Forecast, by Region 2019 & 2032
- Table 5: Global Gourmet Salt Industry Revenue Million Forecast, by Country 2019 & 2032
- Table 6: United States Gourmet Salt Industry Revenue (Million) Forecast, by Application 2019 & 2032
- Table 7: Canada Gourmet Salt Industry Revenue (Million) Forecast, by Application 2019 & 2032
- Table 8: Mexico Gourmet Salt Industry Revenue (Million) Forecast, by Application 2019 & 2032
- Table 9: Rest of North America Gourmet Salt Industry Revenue (Million) Forecast, by Application 2019 & 2032
- Table 10: Global Gourmet Salt Industry Revenue Million Forecast, by Country 2019 & 2032
- Table 11: United Kingdom Gourmet Salt Industry Revenue (Million) Forecast, by Application 2019 & 2032
- Table 12: Germany Gourmet Salt Industry Revenue (Million) Forecast, by Application 2019 & 2032
- Table 13: France Gourmet Salt Industry Revenue (Million) Forecast, by Application 2019 & 2032
- Table 14: Russia Gourmet Salt Industry Revenue (Million) Forecast, by Application 2019 & 2032
- Table 15: Italy Gourmet Salt Industry Revenue (Million) Forecast, by Application 2019 & 2032
- Table 16: Spain Gourmet Salt Industry Revenue (Million) Forecast, by Application 2019 & 2032
- Table 17: Rest of Europe Gourmet Salt Industry Revenue (Million) Forecast, by Application 2019 & 2032
- Table 18: Global Gourmet Salt Industry Revenue Million Forecast, by Country 2019 & 2032
- Table 19: India Gourmet Salt Industry Revenue (Million) Forecast, by Application 2019 & 2032
- Table 20: China Gourmet Salt Industry Revenue (Million) Forecast, by Application 2019 & 2032
- Table 21: Japan Gourmet Salt Industry Revenue (Million) Forecast, by Application 2019 & 2032
- Table 22: Australia Gourmet Salt Industry Revenue (Million) Forecast, by Application 2019 & 2032
- Table 23: Rest of Asia Pacific Gourmet Salt Industry Revenue (Million) Forecast, by Application 2019 & 2032
- Table 24: Global Gourmet Salt Industry Revenue Million Forecast, by Country 2019 & 2032
- Table 25: Brazil Gourmet Salt Industry Revenue (Million) Forecast, by Application 2019 & 2032
- Table 26: Argentina Gourmet Salt Industry Revenue (Million) Forecast, by Application 2019 & 2032
- Table 27: Rest of South America Gourmet Salt Industry Revenue (Million) Forecast, by Application 2019 & 2032
- Table 28: Global Gourmet Salt Industry Revenue Million Forecast, by Country 2019 & 2032
- Table 29: South Africa Gourmet Salt Industry Revenue (Million) Forecast, by Application 2019 & 2032
- Table 30: United Arab Emirates Gourmet Salt Industry Revenue (Million) Forecast, by Application 2019 & 2032
- Table 31: Rest of Middle East and Africa Gourmet Salt Industry Revenue (Million) Forecast, by Application 2019 & 2032
- Table 32: Global Gourmet Salt Industry Revenue Million Forecast, by Type 2019 & 2032
- Table 33: Global Gourmet Salt Industry Revenue Million Forecast, by Application 2019 & 2032
- Table 34: Global Gourmet Salt Industry Revenue Million Forecast, by Country 2019 & 2032
- Table 35: United States Gourmet Salt Industry Revenue (Million) Forecast, by Application 2019 & 2032
- Table 36: Canada Gourmet Salt Industry Revenue (Million) Forecast, by Application 2019 & 2032
- Table 37: Mexico Gourmet Salt Industry Revenue (Million) Forecast, by Application 2019 & 2032
- Table 38: Rest of North America Gourmet Salt Industry Revenue (Million) Forecast, by Application 2019 & 2032
- Table 39: Global Gourmet Salt Industry Revenue Million Forecast, by Type 2019 & 2032
- Table 40: Global Gourmet Salt Industry Revenue Million Forecast, by Application 2019 & 2032
- Table 41: Global Gourmet Salt Industry Revenue Million Forecast, by Country 2019 & 2032
- Table 42: United Kingdom Gourmet Salt Industry Revenue (Million) Forecast, by Application 2019 & 2032
- Table 43: Germany Gourmet Salt Industry Revenue (Million) Forecast, by Application 2019 & 2032
- Table 44: France Gourmet Salt Industry Revenue (Million) Forecast, by Application 2019 & 2032
- Table 45: Russia Gourmet Salt Industry Revenue (Million) Forecast, by Application 2019 & 2032
- Table 46: Italy Gourmet Salt Industry Revenue (Million) Forecast, by Application 2019 & 2032
- Table 47: Spain Gourmet Salt Industry Revenue (Million) Forecast, by Application 2019 & 2032
- Table 48: Rest of Europe Gourmet Salt Industry Revenue (Million) Forecast, by Application 2019 & 2032
- Table 49: Global Gourmet Salt Industry Revenue Million Forecast, by Type 2019 & 2032
- Table 50: Global Gourmet Salt Industry Revenue Million Forecast, by Application 2019 & 2032
- Table 51: Global Gourmet Salt Industry Revenue Million Forecast, by Country 2019 & 2032
- Table 52: India Gourmet Salt Industry Revenue (Million) Forecast, by Application 2019 & 2032
- Table 53: China Gourmet Salt Industry Revenue (Million) Forecast, by Application 2019 & 2032
- Table 54: Japan Gourmet Salt Industry Revenue (Million) Forecast, by Application 2019 & 2032
- Table 55: Australia Gourmet Salt Industry Revenue (Million) Forecast, by Application 2019 & 2032
- Table 56: Rest of Asia Pacific Gourmet Salt Industry Revenue (Million) Forecast, by Application 2019 & 2032
- Table 57: Global Gourmet Salt Industry Revenue Million Forecast, by Type 2019 & 2032
- Table 58: Global Gourmet Salt Industry Revenue Million Forecast, by Application 2019 & 2032
- Table 59: Global Gourmet Salt Industry Revenue Million Forecast, by Country 2019 & 2032
- Table 60: Brazil Gourmet Salt Industry Revenue (Million) Forecast, by Application 2019 & 2032
- Table 61: Argentina Gourmet Salt Industry Revenue (Million) Forecast, by Application 2019 & 2032
- Table 62: Rest of South America Gourmet Salt Industry Revenue (Million) Forecast, by Application 2019 & 2032
- Table 63: Global Gourmet Salt Industry Revenue Million Forecast, by Type 2019 & 2032
- Table 64: Global Gourmet Salt Industry Revenue Million Forecast, by Application 2019 & 2032
- Table 65: Global Gourmet Salt Industry Revenue Million Forecast, by Country 2019 & 2032
- Table 66: South Africa Gourmet Salt Industry Revenue (Million) Forecast, by Application 2019 & 2032
- Table 67: United Arab Emirates Gourmet Salt Industry Revenue (Million) Forecast, by Application 2019 & 2032
- Table 68: Rest of Middle East and Africa Gourmet Salt Industry Revenue (Million) Forecast, by Application 2019 & 2032
Frequently Asked Questions
1. What is the projected Compound Annual Growth Rate (CAGR) of the Gourmet Salt Industry?
The projected CAGR is approximately 4.20%.
2. Which companies are prominent players in the Gourmet Salt Industry?
Key companies in the market include Amagansett Sea Salt Co, Saltworks Inc *List Not Exhaustive, Maldon Crystal Salt Co, Cheetham Salt Ltd, Pyramid Salt Pty Ltd, Alaska Pure Sea Salt Co, Murray River Salt, Cargill Inc, Morton Salt Inc, Kalahari Pristine Salt Worx.
3. What are the main segments of the Gourmet Salt Industry?
The market segments include Type, Application.
4. Can you provide details about the market size?
The market size is estimated to be USD 1.84 Million as of 2022.
5. What are some drivers contributing to market growth?
Escalating Demand for Processed Poultry Products; Favorable Government Initiatives to Boost Production.
6. What are the notable trends driving market growth?
Growing Demand from the Food Service Industry.
7. Are there any restraints impacting market growth?
Rising Vegan Trend among Young Consumers; Deeper Penetration of Red Meat Across Saudi Arabia.
8. Can you provide examples of recent developments in the market?
In January 2021, Cargill Salt launched a new purified sea salt flour. The ingredient is a unique type of ultra-fine cut, powder-like sodium chloride. It is suitable for applications that require extremely fine sizing for blending, including dry soup, cereal, flour, and spice mixes, as well as for topping snack foods.
9. What pricing options are available for accessing the report?
Pricing options include single-user, multi-user, and enterprise licenses priced at USD 4750, USD 5250, and USD 8750 respectively.
10. Is the market size provided in terms of value or volume?
The market size is provided in terms of value, measured in Million.
11. Are there any specific market keywords associated with the report?
Yes, the market keyword associated with the report is "Gourmet Salt Industry," which aids in identifying and referencing the specific market segment covered.
12. How do I determine which pricing option suits my needs best?
The pricing options vary based on user requirements and access needs. Individual users may opt for single-user licenses, while businesses requiring broader access may choose multi-user or enterprise licenses for cost-effective access to the report.
13. Are there any additional resources or data provided in the Gourmet Salt Industry report?
While the report offers comprehensive insights, it's advisable to review the specific contents or supplementary materials provided to ascertain if additional resources or data are available.
14. How can I stay updated on further developments or reports in the Gourmet Salt Industry?
To stay informed about further developments, trends, and reports in the Gourmet Salt Industry, consider subscribing to industry newsletters, following relevant companies and organizations, or regularly checking reputable industry news sources and publications.
Methodology
Step 1 - Identification of Relevant Samples Size from Population Database


Step 2 - Approaches for Defining Global Market Size (Value, Volume* & Price*)

Note*: In applicable scenarios
Step 3 - Data Sources
Primary Research
- Web Analytics
- Survey Reports
- Research Institute
- Latest Research Reports
- Opinion Leaders
Secondary Research
- Annual Reports
- White Paper
- Latest Press Release
- Industry Association
- Paid Database
- Investor Presentations

Step 4 - Data Triangulation
Involves using different sources of information in order to increase the validity of a study
These sources are likely to be stakeholders in a program - participants, other researchers, program staff, other community members, and so on.
Then we put all data in single framework & apply various statistical tools to find out the dynamic on the market.
During the analysis stage, feedback from the stakeholder groups would be compared to determine areas of agreement as well as areas of divergence
