

Key Insights
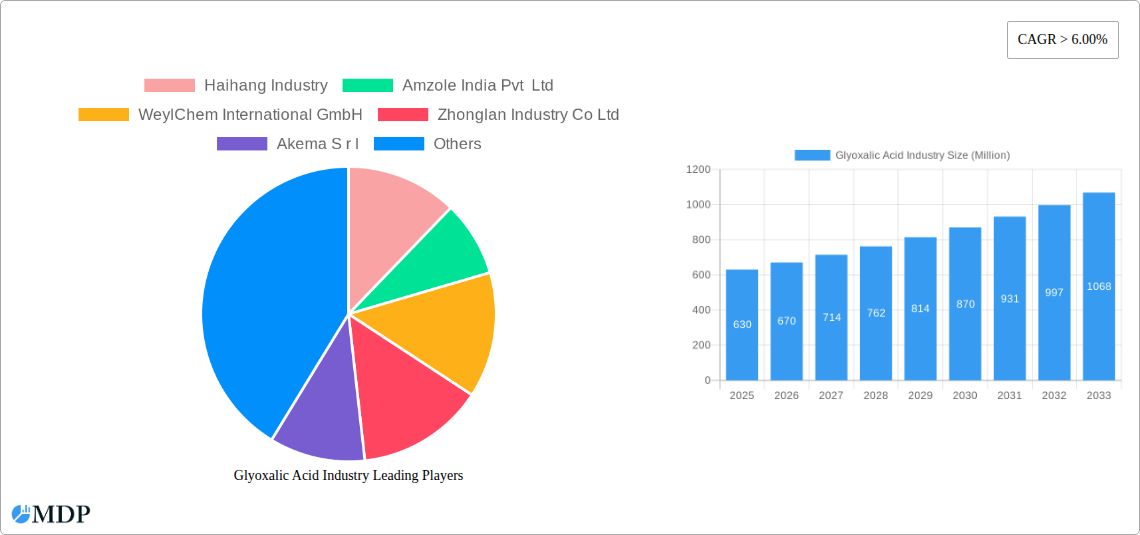
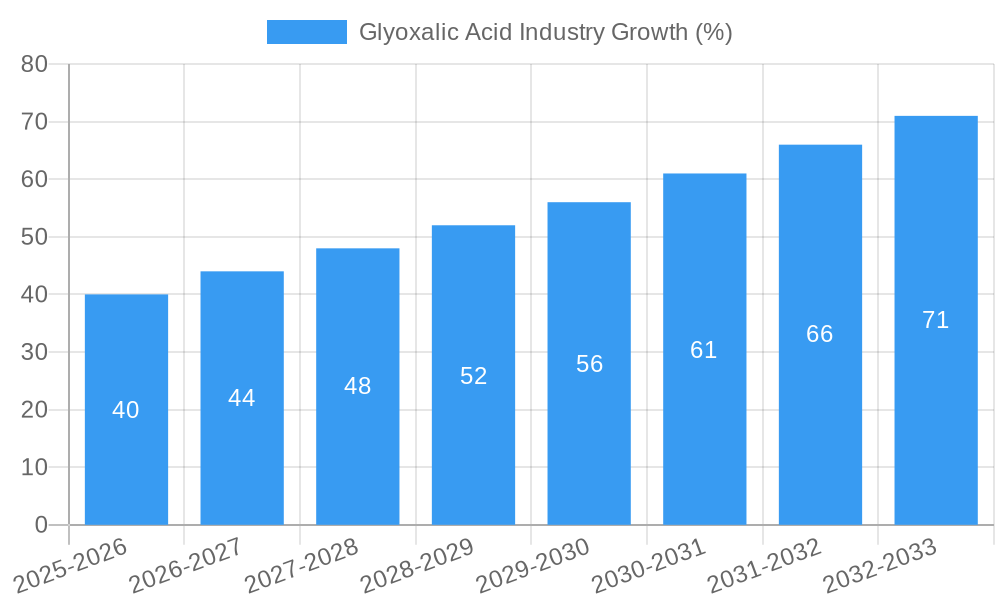
The glyoxalic acid market, currently valued at $630 million in 2025, is projected to experience robust growth, exhibiting a compound annual growth rate (CAGR) exceeding 6.00% from 2025 to 2033. This expansion is driven by the increasing demand from key end-use sectors. The personal care and cosmetics industry utilizes glyoxalic acid as a crucial ingredient in various formulations, contributing significantly to market growth. Furthermore, the pharmaceutical industry leverages its properties in drug synthesis, while the agrochemical sector employs it as a component in herbicides and pesticides. The flavor industry also incorporates glyoxalic acid for its flavor-enhancing capabilities, further bolstering market demand. Other sectors, such as food and beverage manufacturing, contribute to the overall market size. Growth is also fueled by ongoing research and development efforts exploring new applications of glyoxalic acid, leading to diversification across industries and geographical regions. The Asia-Pacific region, particularly China and India, is expected to be a key growth driver due to the burgeoning industries mentioned above and expanding manufacturing capacities.
Despite the positive outlook, certain restraints could impact market growth. These may include fluctuations in raw material prices, stringent regulatory frameworks surrounding chemical usage in certain applications, and potential environmental concerns related to production processes. However, ongoing innovations in sustainable manufacturing practices and the development of more efficient production technologies are mitigating these challenges. Competition among established players like Haihang Industry, Amzole India Pvt Ltd, and WeylChem International GmbH, alongside emerging regional players, is expected to remain intense, driving further market dynamism. The forecast period of 2025-2033 is expected to witness increased consolidation and strategic alliances among market participants seeking to enhance their product portfolios and geographic reach.
This comprehensive report provides an in-depth analysis of the global glyoxalic acid industry, covering market dynamics, leading players, growth drivers, challenges, and future opportunities. With a study period spanning 2019-2033, a base year of 2025, and a forecast period of 2025-2033, this report offers invaluable insights for industry stakeholders, investors, and strategic decision-makers. The report leverages data from the historical period (2019-2024) to project future market trends accurately. The total market size in 2025 is estimated at xx Million USD.
Glyoxalic Acid Industry Market Dynamics & Concentration
The glyoxalic acid market exhibits a moderately concentrated landscape, with several key players holding significant market share. Haihang Industry, Amzole India Pvt Ltd, WeylChem International GmbH, Zhonglan Industry Co Ltd, Akema S r l, JIAXING ZHONGHUA CHEMICAL Co Ltd, Hubei Hongyuan Pharmaceutical Technology Co Ltd, Xinjiang Guolin New Materials Co Ltd, STAN Chemical Co Ltd, and Ensince Industry Co Ltd are some of the prominent players, though the list is not exhaustive. Innovation in production methods, particularly focusing on cost-effectiveness and sustainability, is a major driver. Stringent regulatory frameworks regarding chemical handling and environmental impact significantly influence market operations. Glycolic acid serves as a partial substitute, impacting glyoxalic acid's market penetration in certain segments. End-user trends, particularly in the pharmaceuticals and agrochemicals sectors, are pivotal in shaping demand. The market has witnessed xx M&A deals in the past five years, indicating significant consolidation efforts. The top 5 players collectively hold an estimated xx% market share.
- Market Concentration: Moderately concentrated.
- Innovation Drivers: Cost-effective and sustainable production methods.
- Regulatory Framework: Stringent regulations on chemical handling and environmental impact.
- Product Substitutes: Glycolic acid.
- End-User Trends: Growing demand from pharmaceuticals and agrochemicals.
- M&A Activity: xx deals in the past five years.
Glyoxalic Acid Industry Industry Trends & Analysis
The global glyoxalic acid market is projected to experience robust growth, with a CAGR of xx% during the forecast period (2025-2033). This growth is fueled by increasing demand across diverse end-use sectors, including personal care, pharmaceuticals, and agrochemicals. Technological advancements in production processes are leading to higher efficiency and reduced costs, further boosting market expansion. Consumer preference for natural and sustainable products is driving the demand for glyoxalic acid derived from renewable sources. Intense competition among existing players is stimulating innovation and driving down prices. Market penetration in emerging economies is also contributing significantly to overall growth. The market penetration rate in the personal care segment is estimated at xx% in 2025.
Leading Markets & Segments in Glyoxalic Acid Industry
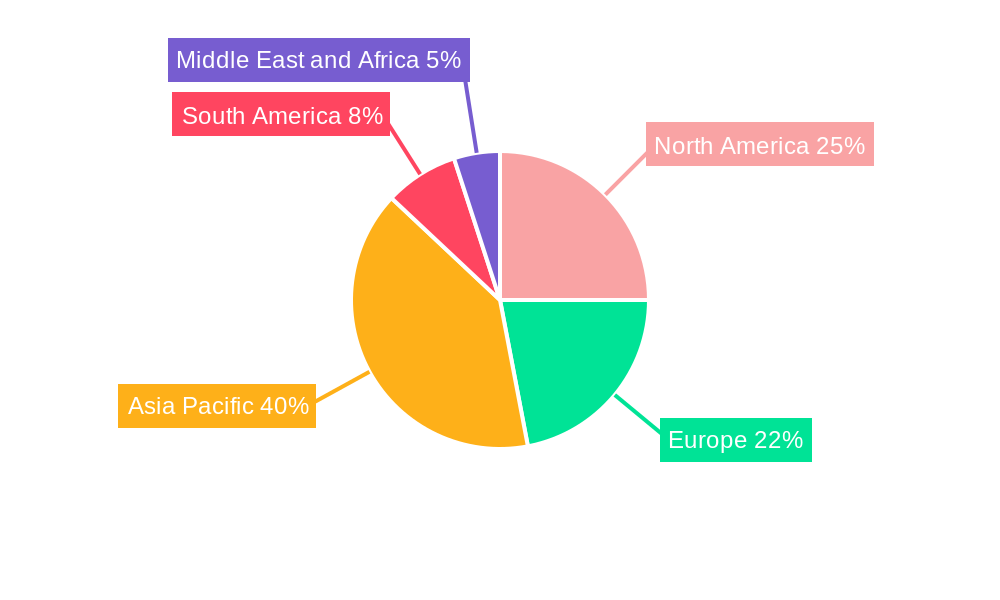
The pharmaceutical segment currently dominates the glyoxalic acid market, accounting for an estimated xx% of global demand in 2025. This is primarily due to its extensive use as an intermediate in the synthesis of various pharmaceutical compounds. The Asia-Pacific region is the leading market, driven by strong economic growth, increasing industrialization, and rising demand from key end-use sectors.
Key Drivers for the Pharmaceutical Segment:
- High demand for pharmaceutical intermediates.
- Stringent regulatory approvals driving product quality.
- Technological advancements leading to new drug discovery.
Key Drivers for the Asia-Pacific Region:
- Rapid economic growth and industrialization.
- Significant investments in pharmaceutical and agrochemical sectors.
- Favorable government policies supporting industrial development.
Dominance Analysis: The pharmaceutical segment's dominance is attributed to the crucial role glyoxalic acid plays in pharmaceutical synthesis. Its widespread applications in diverse drug classes ensure sustained and significant demand. The Asia-Pacific region's leadership reflects its rapidly expanding industrial base and increased investment in sectors heavily reliant on glyoxalic acid.
Glyoxalic Acid Industry Product Developments
Recent product innovations in the glyoxalic acid industry focus on developing higher purity grades to meet stringent regulatory requirements, particularly in the pharmaceutical sector. New applications are constantly emerging, expanding the market reach. Companies are focusing on optimizing production processes to enhance efficiency and reduce environmental impact, offering a significant competitive advantage. Technological advancements, such as improved synthesis methods and purification techniques, are shaping the landscape.
Key Drivers of Glyoxalic Acid Industry Growth
The growth of the glyoxalic acid industry is driven by several factors, including:
- Technological advancements: Improved production methods and purification techniques enhance efficiency and reduce costs.
- Economic growth: Expansion of end-use sectors such as pharmaceuticals and agrochemicals boosts demand.
- Favorable government policies: Incentives and regulations promoting sustainable chemical production further accelerate growth.
Challenges in the Glyoxalic Acid Industry Market
The glyoxalic acid market faces several challenges, including:
- Strict regulatory compliance: Meeting stringent environmental and safety standards is costly and time-consuming.
- Supply chain disruptions: Global events and logistical issues can impact raw material availability and production efficiency.
- Intense competition: Price pressures from competitors necessitate continuous innovation and cost optimization.
Emerging Opportunities in Glyoxalic Acid Industry
Emerging opportunities in the glyoxalic acid market lie in:
- Development of novel applications in high-growth sectors such as bio-based materials and renewable energy.
- Strategic partnerships and collaborations to leverage expertise and access new markets.
- Expansion into emerging economies with significant growth potential.
Leading Players in the Glyoxalic Acid Industry Sector
- Haihang Industry
- Amzole India Pvt Ltd
- WeylChem International GmbH
- Zhonglan Industry Co Ltd
- Akema S r l
- JIAXING ZHONGHUA CHEMICAL Co Ltd
- Hubei Hongyuan Pharmaceutical Technology Co Ltd
- Xinjiang Guolin New Materials Co Ltd
- STAN Chemical Co Ltd
- Ensince Industry Co Ltd
Key Milestones in Glyoxalic Acid Industry Industry
- August 2023: Chemours completes the sale of its glycolic acid business to Iron Path Capital-backed PureTech Scientific, LLC for USD 137 Million. This deal significantly reshaped the competitive landscape and highlighted investor interest in the sector.
- August 2023: Guolin New Materials announced the expansion of its high-quality glyoxalic acid business to the European market. This strategic move broadened the company's geographical reach and access to new customer bases.
Strategic Outlook for Glyoxalic Acid Industry Market
The glyoxalic acid market is poised for significant growth driven by increasing demand from diverse sectors and technological advancements. Strategic partnerships, focus on sustainable production, and expansion into new markets will be crucial for success in this competitive landscape. The long-term outlook is positive, with potential for considerable market expansion over the next decade.
Glyoxalic Acid Industry Segmentation
-
1. End-user
- 1.1. Personal Care and Cosmetics
- 1.2. Pharmaceuticals
- 1.3. Agrochemicals
- 1.4. Flavour Industry
- 1.5. Others (Food and Beverage, etc.)
Glyoxalic Acid Industry Segmentation By Geography
-
1. Asia Pacific
- 1.1. China
- 1.2. India
- 1.3. Japan
- 1.4. South Korea
- 1.5. Rest of Asia Pacific
-
2. North America
- 2.1. United States
- 2.2. Canada
- 2.3. Mexico
-
3. Europe
- 3.1. Germany
- 3.2. United Kingdom
- 3.3. Italy
- 3.4. France
- 3.5. Rest of Europe
-
4. South America
- 4.1. Brazil
- 4.2. Argentina
- 4.3. Rest of South America
-
5. Middle East and Africa
- 5.1. Saudi Arabia
- 5.2. South Africa
- 5.3. Rest of Middle East and Africa
Glyoxalic Acid Industry REPORT HIGHLIGHTS
| Aspects | Details |
|---|---|
| Study Period | 2019-2033 |
| Base Year | 2024 |
| Estimated Year | 2025 |
| Forecast Period | 2025-2033 |
| Historical Period | 2019-2024 |
| Growth Rate | CAGR of > 6.00% from 2019-2033 |
| Segmentation |
|
Table of Contents
- 1. Introduction
- 1.1. Research Scope
- 1.2. Market Segmentation
- 1.3. Research Methodology
- 1.4. Definitions and Assumptions
- 2. Executive Summary
- 2.1. Introduction
- 3. Market Dynamics
- 3.1. Introduction
- 3.2. Market Drivers
- 3.2.1. Increasing Demand from Agrochemicals Sector; Growing Applications from Personal Care and Cosmetic Industry; Other Drivers
- 3.3. Market Restrains
- 3.3.1. Stringent Regulation Regarding Emission Control and Waste Disposal; Other Restraints
- 3.4. Market Trends
- 3.4.1. Increasing demand from Personal Care and Cosmetics Sector
- 4. Market Factor Analysis
- 4.1. Porters Five Forces
- 4.2. Supply/Value Chain
- 4.3. PESTEL analysis
- 4.4. Market Entropy
- 4.5. Patent/Trademark Analysis
- 5. Global Glyoxalic Acid Industry Analysis, Insights and Forecast, 2019-2031
- 5.1. Market Analysis, Insights and Forecast - by End-user
- 5.1.1. Personal Care and Cosmetics
- 5.1.2. Pharmaceuticals
- 5.1.3. Agrochemicals
- 5.1.4. Flavour Industry
- 5.1.5. Others (Food and Beverage, etc.)
- 5.2. Market Analysis, Insights and Forecast - by Region
- 5.2.1. Asia Pacific
- 5.2.2. North America
- 5.2.3. Europe
- 5.2.4. South America
- 5.2.5. Middle East and Africa
- 5.1. Market Analysis, Insights and Forecast - by End-user
- 6. Asia Pacific Glyoxalic Acid Industry Analysis, Insights and Forecast, 2019-2031
- 6.1. Market Analysis, Insights and Forecast - by End-user
- 6.1.1. Personal Care and Cosmetics
- 6.1.2. Pharmaceuticals
- 6.1.3. Agrochemicals
- 6.1.4. Flavour Industry
- 6.1.5. Others (Food and Beverage, etc.)
- 6.1. Market Analysis, Insights and Forecast - by End-user
- 7. North America Glyoxalic Acid Industry Analysis, Insights and Forecast, 2019-2031
- 7.1. Market Analysis, Insights and Forecast - by End-user
- 7.1.1. Personal Care and Cosmetics
- 7.1.2. Pharmaceuticals
- 7.1.3. Agrochemicals
- 7.1.4. Flavour Industry
- 7.1.5. Others (Food and Beverage, etc.)
- 7.1. Market Analysis, Insights and Forecast - by End-user
- 8. Europe Glyoxalic Acid Industry Analysis, Insights and Forecast, 2019-2031
- 8.1. Market Analysis, Insights and Forecast - by End-user
- 8.1.1. Personal Care and Cosmetics
- 8.1.2. Pharmaceuticals
- 8.1.3. Agrochemicals
- 8.1.4. Flavour Industry
- 8.1.5. Others (Food and Beverage, etc.)
- 8.1. Market Analysis, Insights and Forecast - by End-user
- 9. South America Glyoxalic Acid Industry Analysis, Insights and Forecast, 2019-2031
- 9.1. Market Analysis, Insights and Forecast - by End-user
- 9.1.1. Personal Care and Cosmetics
- 9.1.2. Pharmaceuticals
- 9.1.3. Agrochemicals
- 9.1.4. Flavour Industry
- 9.1.5. Others (Food and Beverage, etc.)
- 9.1. Market Analysis, Insights and Forecast - by End-user
- 10. Middle East and Africa Glyoxalic Acid Industry Analysis, Insights and Forecast, 2019-2031
- 10.1. Market Analysis, Insights and Forecast - by End-user
- 10.1.1. Personal Care and Cosmetics
- 10.1.2. Pharmaceuticals
- 10.1.3. Agrochemicals
- 10.1.4. Flavour Industry
- 10.1.5. Others (Food and Beverage, etc.)
- 10.1. Market Analysis, Insights and Forecast - by End-user
- 11. Asia Pacific Glyoxalic Acid Industry Analysis, Insights and Forecast, 2019-2031
- 11.1. Market Analysis, Insights and Forecast - By Country/Sub-region
- 11.1.1 China
- 11.1.2 India
- 11.1.3 Japan
- 11.1.4 South Korea
- 11.1.5 Rest of Asia Pacific
- 12. North America Glyoxalic Acid Industry Analysis, Insights and Forecast, 2019-2031
- 12.1. Market Analysis, Insights and Forecast - By Country/Sub-region
- 12.1.1 United States
- 12.1.2 Canada
- 12.1.3 Mexico
- 13. Europe Glyoxalic Acid Industry Analysis, Insights and Forecast, 2019-2031
- 13.1. Market Analysis, Insights and Forecast - By Country/Sub-region
- 13.1.1 Germany
- 13.1.2 United Kingdom
- 13.1.3 Italy
- 13.1.4 France
- 13.1.5 Rest of Europe
- 14. South America Glyoxalic Acid Industry Analysis, Insights and Forecast, 2019-2031
- 14.1. Market Analysis, Insights and Forecast - By Country/Sub-region
- 14.1.1 Brazil
- 14.1.2 Argentina
- 14.1.3 Rest of South America
- 15. Middle East and Africa Glyoxalic Acid Industry Analysis, Insights and Forecast, 2019-2031
- 15.1. Market Analysis, Insights and Forecast - By Country/Sub-region
- 15.1.1 Saudi Arabia
- 15.1.2 South Africa
- 15.1.3 Rest of Middle East and Africa
- 16. Competitive Analysis
- 16.1. Global Market Share Analysis 2024
- 16.2. Company Profiles
- 16.2.1 Haihang Industry
- 16.2.1.1. Overview
- 16.2.1.2. Products
- 16.2.1.3. SWOT Analysis
- 16.2.1.4. Recent Developments
- 16.2.1.5. Financials (Based on Availability)
- 16.2.2 Amzole India Pvt Ltd
- 16.2.2.1. Overview
- 16.2.2.2. Products
- 16.2.2.3. SWOT Analysis
- 16.2.2.4. Recent Developments
- 16.2.2.5. Financials (Based on Availability)
- 16.2.3 WeylChem International GmbH
- 16.2.3.1. Overview
- 16.2.3.2. Products
- 16.2.3.3. SWOT Analysis
- 16.2.3.4. Recent Developments
- 16.2.3.5. Financials (Based on Availability)
- 16.2.4 Zhonglan Industry Co Ltd
- 16.2.4.1. Overview
- 16.2.4.2. Products
- 16.2.4.3. SWOT Analysis
- 16.2.4.4. Recent Developments
- 16.2.4.5. Financials (Based on Availability)
- 16.2.5 Akema S r l
- 16.2.5.1. Overview
- 16.2.5.2. Products
- 16.2.5.3. SWOT Analysis
- 16.2.5.4. Recent Developments
- 16.2.5.5. Financials (Based on Availability)
- 16.2.6 JIAXING ZHONGHUA CHEMICAL Co Ltd
- 16.2.6.1. Overview
- 16.2.6.2. Products
- 16.2.6.3. SWOT Analysis
- 16.2.6.4. Recent Developments
- 16.2.6.5. Financials (Based on Availability)
- 16.2.7 Hubei Hongyuan Pharmaceutical Technology Co Ltd
- 16.2.7.1. Overview
- 16.2.7.2. Products
- 16.2.7.3. SWOT Analysis
- 16.2.7.4. Recent Developments
- 16.2.7.5. Financials (Based on Availability)
- 16.2.8 Xinjiang Guolin New Materials Co Ltd
- 16.2.8.1. Overview
- 16.2.8.2. Products
- 16.2.8.3. SWOT Analysis
- 16.2.8.4. Recent Developments
- 16.2.8.5. Financials (Based on Availability)
- 16.2.9 STAN Chemical Co Ltd
- 16.2.9.1. Overview
- 16.2.9.2. Products
- 16.2.9.3. SWOT Analysis
- 16.2.9.4. Recent Developments
- 16.2.9.5. Financials (Based on Availability)
- 16.2.10 Ensince Industry Co Ltd *List Not Exhaustive
- 16.2.10.1. Overview
- 16.2.10.2. Products
- 16.2.10.3. SWOT Analysis
- 16.2.10.4. Recent Developments
- 16.2.10.5. Financials (Based on Availability)
- 16.2.1 Haihang Industry
List of Figures
- Figure 1: Global Glyoxalic Acid Industry Revenue Breakdown (Million, %) by Region 2024 & 2032
- Figure 2: Global Glyoxalic Acid Industry Volume Breakdown (kilotons, %) by Region 2024 & 2032
- Figure 3: Asia Pacific Glyoxalic Acid Industry Revenue (Million), by Country 2024 & 2032
- Figure 4: Asia Pacific Glyoxalic Acid Industry Volume (kilotons), by Country 2024 & 2032
- Figure 5: Asia Pacific Glyoxalic Acid Industry Revenue Share (%), by Country 2024 & 2032
- Figure 6: Asia Pacific Glyoxalic Acid Industry Volume Share (%), by Country 2024 & 2032
- Figure 7: North America Glyoxalic Acid Industry Revenue (Million), by Country 2024 & 2032
- Figure 8: North America Glyoxalic Acid Industry Volume (kilotons), by Country 2024 & 2032
- Figure 9: North America Glyoxalic Acid Industry Revenue Share (%), by Country 2024 & 2032
- Figure 10: North America Glyoxalic Acid Industry Volume Share (%), by Country 2024 & 2032
- Figure 11: Europe Glyoxalic Acid Industry Revenue (Million), by Country 2024 & 2032
- Figure 12: Europe Glyoxalic Acid Industry Volume (kilotons), by Country 2024 & 2032
- Figure 13: Europe Glyoxalic Acid Industry Revenue Share (%), by Country 2024 & 2032
- Figure 14: Europe Glyoxalic Acid Industry Volume Share (%), by Country 2024 & 2032
- Figure 15: South America Glyoxalic Acid Industry Revenue (Million), by Country 2024 & 2032
- Figure 16: South America Glyoxalic Acid Industry Volume (kilotons), by Country 2024 & 2032
- Figure 17: South America Glyoxalic Acid Industry Revenue Share (%), by Country 2024 & 2032
- Figure 18: South America Glyoxalic Acid Industry Volume Share (%), by Country 2024 & 2032
- Figure 19: Middle East and Africa Glyoxalic Acid Industry Revenue (Million), by Country 2024 & 2032
- Figure 20: Middle East and Africa Glyoxalic Acid Industry Volume (kilotons), by Country 2024 & 2032
- Figure 21: Middle East and Africa Glyoxalic Acid Industry Revenue Share (%), by Country 2024 & 2032
- Figure 22: Middle East and Africa Glyoxalic Acid Industry Volume Share (%), by Country 2024 & 2032
- Figure 23: Asia Pacific Glyoxalic Acid Industry Revenue (Million), by End-user 2024 & 2032
- Figure 24: Asia Pacific Glyoxalic Acid Industry Volume (kilotons), by End-user 2024 & 2032
- Figure 25: Asia Pacific Glyoxalic Acid Industry Revenue Share (%), by End-user 2024 & 2032
- Figure 26: Asia Pacific Glyoxalic Acid Industry Volume Share (%), by End-user 2024 & 2032
- Figure 27: Asia Pacific Glyoxalic Acid Industry Revenue (Million), by Country 2024 & 2032
- Figure 28: Asia Pacific Glyoxalic Acid Industry Volume (kilotons), by Country 2024 & 2032
- Figure 29: Asia Pacific Glyoxalic Acid Industry Revenue Share (%), by Country 2024 & 2032
- Figure 30: Asia Pacific Glyoxalic Acid Industry Volume Share (%), by Country 2024 & 2032
- Figure 31: North America Glyoxalic Acid Industry Revenue (Million), by End-user 2024 & 2032
- Figure 32: North America Glyoxalic Acid Industry Volume (kilotons), by End-user 2024 & 2032
- Figure 33: North America Glyoxalic Acid Industry Revenue Share (%), by End-user 2024 & 2032
- Figure 34: North America Glyoxalic Acid Industry Volume Share (%), by End-user 2024 & 2032
- Figure 35: North America Glyoxalic Acid Industry Revenue (Million), by Country 2024 & 2032
- Figure 36: North America Glyoxalic Acid Industry Volume (kilotons), by Country 2024 & 2032
- Figure 37: North America Glyoxalic Acid Industry Revenue Share (%), by Country 2024 & 2032
- Figure 38: North America Glyoxalic Acid Industry Volume Share (%), by Country 2024 & 2032
- Figure 39: Europe Glyoxalic Acid Industry Revenue (Million), by End-user 2024 & 2032
- Figure 40: Europe Glyoxalic Acid Industry Volume (kilotons), by End-user 2024 & 2032
- Figure 41: Europe Glyoxalic Acid Industry Revenue Share (%), by End-user 2024 & 2032
- Figure 42: Europe Glyoxalic Acid Industry Volume Share (%), by End-user 2024 & 2032
- Figure 43: Europe Glyoxalic Acid Industry Revenue (Million), by Country 2024 & 2032
- Figure 44: Europe Glyoxalic Acid Industry Volume (kilotons), by Country 2024 & 2032
- Figure 45: Europe Glyoxalic Acid Industry Revenue Share (%), by Country 2024 & 2032
- Figure 46: Europe Glyoxalic Acid Industry Volume Share (%), by Country 2024 & 2032
- Figure 47: South America Glyoxalic Acid Industry Revenue (Million), by End-user 2024 & 2032
- Figure 48: South America Glyoxalic Acid Industry Volume (kilotons), by End-user 2024 & 2032
- Figure 49: South America Glyoxalic Acid Industry Revenue Share (%), by End-user 2024 & 2032
- Figure 50: South America Glyoxalic Acid Industry Volume Share (%), by End-user 2024 & 2032
- Figure 51: South America Glyoxalic Acid Industry Revenue (Million), by Country 2024 & 2032
- Figure 52: South America Glyoxalic Acid Industry Volume (kilotons), by Country 2024 & 2032
- Figure 53: South America Glyoxalic Acid Industry Revenue Share (%), by Country 2024 & 2032
- Figure 54: South America Glyoxalic Acid Industry Volume Share (%), by Country 2024 & 2032
- Figure 55: Middle East and Africa Glyoxalic Acid Industry Revenue (Million), by End-user 2024 & 2032
- Figure 56: Middle East and Africa Glyoxalic Acid Industry Volume (kilotons), by End-user 2024 & 2032
- Figure 57: Middle East and Africa Glyoxalic Acid Industry Revenue Share (%), by End-user 2024 & 2032
- Figure 58: Middle East and Africa Glyoxalic Acid Industry Volume Share (%), by End-user 2024 & 2032
- Figure 59: Middle East and Africa Glyoxalic Acid Industry Revenue (Million), by Country 2024 & 2032
- Figure 60: Middle East and Africa Glyoxalic Acid Industry Volume (kilotons), by Country 2024 & 2032
- Figure 61: Middle East and Africa Glyoxalic Acid Industry Revenue Share (%), by Country 2024 & 2032
- Figure 62: Middle East and Africa Glyoxalic Acid Industry Volume Share (%), by Country 2024 & 2032
List of Tables
- Table 1: Global Glyoxalic Acid Industry Revenue Million Forecast, by Region 2019 & 2032
- Table 2: Global Glyoxalic Acid Industry Volume kilotons Forecast, by Region 2019 & 2032
- Table 3: Global Glyoxalic Acid Industry Revenue Million Forecast, by End-user 2019 & 2032
- Table 4: Global Glyoxalic Acid Industry Volume kilotons Forecast, by End-user 2019 & 2032
- Table 5: Global Glyoxalic Acid Industry Revenue Million Forecast, by Region 2019 & 2032
- Table 6: Global Glyoxalic Acid Industry Volume kilotons Forecast, by Region 2019 & 2032
- Table 7: Global Glyoxalic Acid Industry Revenue Million Forecast, by Country 2019 & 2032
- Table 8: Global Glyoxalic Acid Industry Volume kilotons Forecast, by Country 2019 & 2032
- Table 9: China Glyoxalic Acid Industry Revenue (Million) Forecast, by Application 2019 & 2032
- Table 10: China Glyoxalic Acid Industry Volume (kilotons) Forecast, by Application 2019 & 2032
- Table 11: India Glyoxalic Acid Industry Revenue (Million) Forecast, by Application 2019 & 2032
- Table 12: India Glyoxalic Acid Industry Volume (kilotons) Forecast, by Application 2019 & 2032
- Table 13: Japan Glyoxalic Acid Industry Revenue (Million) Forecast, by Application 2019 & 2032
- Table 14: Japan Glyoxalic Acid Industry Volume (kilotons) Forecast, by Application 2019 & 2032
- Table 15: South Korea Glyoxalic Acid Industry Revenue (Million) Forecast, by Application 2019 & 2032
- Table 16: South Korea Glyoxalic Acid Industry Volume (kilotons) Forecast, by Application 2019 & 2032
- Table 17: Rest of Asia Pacific Glyoxalic Acid Industry Revenue (Million) Forecast, by Application 2019 & 2032
- Table 18: Rest of Asia Pacific Glyoxalic Acid Industry Volume (kilotons) Forecast, by Application 2019 & 2032
- Table 19: Global Glyoxalic Acid Industry Revenue Million Forecast, by Country 2019 & 2032
- Table 20: Global Glyoxalic Acid Industry Volume kilotons Forecast, by Country 2019 & 2032
- Table 21: United States Glyoxalic Acid Industry Revenue (Million) Forecast, by Application 2019 & 2032
- Table 22: United States Glyoxalic Acid Industry Volume (kilotons) Forecast, by Application 2019 & 2032
- Table 23: Canada Glyoxalic Acid Industry Revenue (Million) Forecast, by Application 2019 & 2032
- Table 24: Canada Glyoxalic Acid Industry Volume (kilotons) Forecast, by Application 2019 & 2032
- Table 25: Mexico Glyoxalic Acid Industry Revenue (Million) Forecast, by Application 2019 & 2032
- Table 26: Mexico Glyoxalic Acid Industry Volume (kilotons) Forecast, by Application 2019 & 2032
- Table 27: Global Glyoxalic Acid Industry Revenue Million Forecast, by Country 2019 & 2032
- Table 28: Global Glyoxalic Acid Industry Volume kilotons Forecast, by Country 2019 & 2032
- Table 29: Germany Glyoxalic Acid Industry Revenue (Million) Forecast, by Application 2019 & 2032
- Table 30: Germany Glyoxalic Acid Industry Volume (kilotons) Forecast, by Application 2019 & 2032
- Table 31: United Kingdom Glyoxalic Acid Industry Revenue (Million) Forecast, by Application 2019 & 2032
- Table 32: United Kingdom Glyoxalic Acid Industry Volume (kilotons) Forecast, by Application 2019 & 2032
- Table 33: Italy Glyoxalic Acid Industry Revenue (Million) Forecast, by Application 2019 & 2032
- Table 34: Italy Glyoxalic Acid Industry Volume (kilotons) Forecast, by Application 2019 & 2032
- Table 35: France Glyoxalic Acid Industry Revenue (Million) Forecast, by Application 2019 & 2032
- Table 36: France Glyoxalic Acid Industry Volume (kilotons) Forecast, by Application 2019 & 2032
- Table 37: Rest of Europe Glyoxalic Acid Industry Revenue (Million) Forecast, by Application 2019 & 2032
- Table 38: Rest of Europe Glyoxalic Acid Industry Volume (kilotons) Forecast, by Application 2019 & 2032
- Table 39: Global Glyoxalic Acid Industry Revenue Million Forecast, by Country 2019 & 2032
- Table 40: Global Glyoxalic Acid Industry Volume kilotons Forecast, by Country 2019 & 2032
- Table 41: Brazil Glyoxalic Acid Industry Revenue (Million) Forecast, by Application 2019 & 2032
- Table 42: Brazil Glyoxalic Acid Industry Volume (kilotons) Forecast, by Application 2019 & 2032
- Table 43: Argentina Glyoxalic Acid Industry Revenue (Million) Forecast, by Application 2019 & 2032
- Table 44: Argentina Glyoxalic Acid Industry Volume (kilotons) Forecast, by Application 2019 & 2032
- Table 45: Rest of South America Glyoxalic Acid Industry Revenue (Million) Forecast, by Application 2019 & 2032
- Table 46: Rest of South America Glyoxalic Acid Industry Volume (kilotons) Forecast, by Application 2019 & 2032
- Table 47: Global Glyoxalic Acid Industry Revenue Million Forecast, by Country 2019 & 2032
- Table 48: Global Glyoxalic Acid Industry Volume kilotons Forecast, by Country 2019 & 2032
- Table 49: Saudi Arabia Glyoxalic Acid Industry Revenue (Million) Forecast, by Application 2019 & 2032
- Table 50: Saudi Arabia Glyoxalic Acid Industry Volume (kilotons) Forecast, by Application 2019 & 2032
- Table 51: South Africa Glyoxalic Acid Industry Revenue (Million) Forecast, by Application 2019 & 2032
- Table 52: South Africa Glyoxalic Acid Industry Volume (kilotons) Forecast, by Application 2019 & 2032
- Table 53: Rest of Middle East and Africa Glyoxalic Acid Industry Revenue (Million) Forecast, by Application 2019 & 2032
- Table 54: Rest of Middle East and Africa Glyoxalic Acid Industry Volume (kilotons) Forecast, by Application 2019 & 2032
- Table 55: Global Glyoxalic Acid Industry Revenue Million Forecast, by End-user 2019 & 2032
- Table 56: Global Glyoxalic Acid Industry Volume kilotons Forecast, by End-user 2019 & 2032
- Table 57: Global Glyoxalic Acid Industry Revenue Million Forecast, by Country 2019 & 2032
- Table 58: Global Glyoxalic Acid Industry Volume kilotons Forecast, by Country 2019 & 2032
- Table 59: China Glyoxalic Acid Industry Revenue (Million) Forecast, by Application 2019 & 2032
- Table 60: China Glyoxalic Acid Industry Volume (kilotons) Forecast, by Application 2019 & 2032
- Table 61: India Glyoxalic Acid Industry Revenue (Million) Forecast, by Application 2019 & 2032
- Table 62: India Glyoxalic Acid Industry Volume (kilotons) Forecast, by Application 2019 & 2032
- Table 63: Japan Glyoxalic Acid Industry Revenue (Million) Forecast, by Application 2019 & 2032
- Table 64: Japan Glyoxalic Acid Industry Volume (kilotons) Forecast, by Application 2019 & 2032
- Table 65: South Korea Glyoxalic Acid Industry Revenue (Million) Forecast, by Application 2019 & 2032
- Table 66: South Korea Glyoxalic Acid Industry Volume (kilotons) Forecast, by Application 2019 & 2032
- Table 67: Rest of Asia Pacific Glyoxalic Acid Industry Revenue (Million) Forecast, by Application 2019 & 2032
- Table 68: Rest of Asia Pacific Glyoxalic Acid Industry Volume (kilotons) Forecast, by Application 2019 & 2032
- Table 69: Global Glyoxalic Acid Industry Revenue Million Forecast, by End-user 2019 & 2032
- Table 70: Global Glyoxalic Acid Industry Volume kilotons Forecast, by End-user 2019 & 2032
- Table 71: Global Glyoxalic Acid Industry Revenue Million Forecast, by Country 2019 & 2032
- Table 72: Global Glyoxalic Acid Industry Volume kilotons Forecast, by Country 2019 & 2032
- Table 73: United States Glyoxalic Acid Industry Revenue (Million) Forecast, by Application 2019 & 2032
- Table 74: United States Glyoxalic Acid Industry Volume (kilotons) Forecast, by Application 2019 & 2032
- Table 75: Canada Glyoxalic Acid Industry Revenue (Million) Forecast, by Application 2019 & 2032
- Table 76: Canada Glyoxalic Acid Industry Volume (kilotons) Forecast, by Application 2019 & 2032
- Table 77: Mexico Glyoxalic Acid Industry Revenue (Million) Forecast, by Application 2019 & 2032
- Table 78: Mexico Glyoxalic Acid Industry Volume (kilotons) Forecast, by Application 2019 & 2032
- Table 79: Global Glyoxalic Acid Industry Revenue Million Forecast, by End-user 2019 & 2032
- Table 80: Global Glyoxalic Acid Industry Volume kilotons Forecast, by End-user 2019 & 2032
- Table 81: Global Glyoxalic Acid Industry Revenue Million Forecast, by Country 2019 & 2032
- Table 82: Global Glyoxalic Acid Industry Volume kilotons Forecast, by Country 2019 & 2032
- Table 83: Germany Glyoxalic Acid Industry Revenue (Million) Forecast, by Application 2019 & 2032
- Table 84: Germany Glyoxalic Acid Industry Volume (kilotons) Forecast, by Application 2019 & 2032
- Table 85: United Kingdom Glyoxalic Acid Industry Revenue (Million) Forecast, by Application 2019 & 2032
- Table 86: United Kingdom Glyoxalic Acid Industry Volume (kilotons) Forecast, by Application 2019 & 2032
- Table 87: Italy Glyoxalic Acid Industry Revenue (Million) Forecast, by Application 2019 & 2032
- Table 88: Italy Glyoxalic Acid Industry Volume (kilotons) Forecast, by Application 2019 & 2032
- Table 89: France Glyoxalic Acid Industry Revenue (Million) Forecast, by Application 2019 & 2032
- Table 90: France Glyoxalic Acid Industry Volume (kilotons) Forecast, by Application 2019 & 2032
- Table 91: Rest of Europe Glyoxalic Acid Industry Revenue (Million) Forecast, by Application 2019 & 2032
- Table 92: Rest of Europe Glyoxalic Acid Industry Volume (kilotons) Forecast, by Application 2019 & 2032
- Table 93: Global Glyoxalic Acid Industry Revenue Million Forecast, by End-user 2019 & 2032
- Table 94: Global Glyoxalic Acid Industry Volume kilotons Forecast, by End-user 2019 & 2032
- Table 95: Global Glyoxalic Acid Industry Revenue Million Forecast, by Country 2019 & 2032
- Table 96: Global Glyoxalic Acid Industry Volume kilotons Forecast, by Country 2019 & 2032
- Table 97: Brazil Glyoxalic Acid Industry Revenue (Million) Forecast, by Application 2019 & 2032
- Table 98: Brazil Glyoxalic Acid Industry Volume (kilotons) Forecast, by Application 2019 & 2032
- Table 99: Argentina Glyoxalic Acid Industry Revenue (Million) Forecast, by Application 2019 & 2032
- Table 100: Argentina Glyoxalic Acid Industry Volume (kilotons) Forecast, by Application 2019 & 2032
- Table 101: Rest of South America Glyoxalic Acid Industry Revenue (Million) Forecast, by Application 2019 & 2032
- Table 102: Rest of South America Glyoxalic Acid Industry Volume (kilotons) Forecast, by Application 2019 & 2032
- Table 103: Global Glyoxalic Acid Industry Revenue Million Forecast, by End-user 2019 & 2032
- Table 104: Global Glyoxalic Acid Industry Volume kilotons Forecast, by End-user 2019 & 2032
- Table 105: Global Glyoxalic Acid Industry Revenue Million Forecast, by Country 2019 & 2032
- Table 106: Global Glyoxalic Acid Industry Volume kilotons Forecast, by Country 2019 & 2032
- Table 107: Saudi Arabia Glyoxalic Acid Industry Revenue (Million) Forecast, by Application 2019 & 2032
- Table 108: Saudi Arabia Glyoxalic Acid Industry Volume (kilotons) Forecast, by Application 2019 & 2032
- Table 109: South Africa Glyoxalic Acid Industry Revenue (Million) Forecast, by Application 2019 & 2032
- Table 110: South Africa Glyoxalic Acid Industry Volume (kilotons) Forecast, by Application 2019 & 2032
- Table 111: Rest of Middle East and Africa Glyoxalic Acid Industry Revenue (Million) Forecast, by Application 2019 & 2032
- Table 112: Rest of Middle East and Africa Glyoxalic Acid Industry Volume (kilotons) Forecast, by Application 2019 & 2032
Frequently Asked Questions
1. What is the projected Compound Annual Growth Rate (CAGR) of the Glyoxalic Acid Industry?
The projected CAGR is approximately > 6.00%.
2. Which companies are prominent players in the Glyoxalic Acid Industry?
Key companies in the market include Haihang Industry, Amzole India Pvt Ltd, WeylChem International GmbH, Zhonglan Industry Co Ltd, Akema S r l, JIAXING ZHONGHUA CHEMICAL Co Ltd, Hubei Hongyuan Pharmaceutical Technology Co Ltd, Xinjiang Guolin New Materials Co Ltd, STAN Chemical Co Ltd, Ensince Industry Co Ltd *List Not Exhaustive.
3. What are the main segments of the Glyoxalic Acid Industry?
The market segments include End-user.
4. Can you provide details about the market size?
The market size is estimated to be USD 630 Million as of 2022.
5. What are some drivers contributing to market growth?
Increasing Demand from Agrochemicals Sector; Growing Applications from Personal Care and Cosmetic Industry; Other Drivers.
6. What are the notable trends driving market growth?
Increasing demand from Personal Care and Cosmetics Sector.
7. Are there any restraints impacting market growth?
Stringent Regulation Regarding Emission Control and Waste Disposal; Other Restraints.
8. Can you provide examples of recent developments in the market?
August 2023: Chemours completes the sale of glycolic acid business to Iron Path Capital-backed PureTech Scientific, LLC for USD 137 million.
9. What pricing options are available for accessing the report?
Pricing options include single-user, multi-user, and enterprise licenses priced at USD 4750, USD 5250, and USD 8750 respectively.
10. Is the market size provided in terms of value or volume?
The market size is provided in terms of value, measured in Million and volume, measured in kilotons.
11. Are there any specific market keywords associated with the report?
Yes, the market keyword associated with the report is "Glyoxalic Acid Industry," which aids in identifying and referencing the specific market segment covered.
12. How do I determine which pricing option suits my needs best?
The pricing options vary based on user requirements and access needs. Individual users may opt for single-user licenses, while businesses requiring broader access may choose multi-user or enterprise licenses for cost-effective access to the report.
13. Are there any additional resources or data provided in the Glyoxalic Acid Industry report?
While the report offers comprehensive insights, it's advisable to review the specific contents or supplementary materials provided to ascertain if additional resources or data are available.
14. How can I stay updated on further developments or reports in the Glyoxalic Acid Industry?
To stay informed about further developments, trends, and reports in the Glyoxalic Acid Industry, consider subscribing to industry newsletters, following relevant companies and organizations, or regularly checking reputable industry news sources and publications.
Methodology
Step 1 - Identification of Relevant Samples Size from Population Database


Step 2 - Approaches for Defining Global Market Size (Value, Volume* & Price*)

Note*: In applicable scenarios
Step 3 - Data Sources
Primary Research
- Web Analytics
- Survey Reports
- Research Institute
- Latest Research Reports
- Opinion Leaders
Secondary Research
- Annual Reports
- White Paper
- Latest Press Release
- Industry Association
- Paid Database
- Investor Presentations

Step 4 - Data Triangulation
Involves using different sources of information in order to increase the validity of a study
These sources are likely to be stakeholders in a program - participants, other researchers, program staff, other community members, and so on.
Then we put all data in single framework & apply various statistical tools to find out the dynamic on the market.
During the analysis stage, feedback from the stakeholder groups would be compared to determine areas of agreement as well as areas of divergence
