

Key Insights
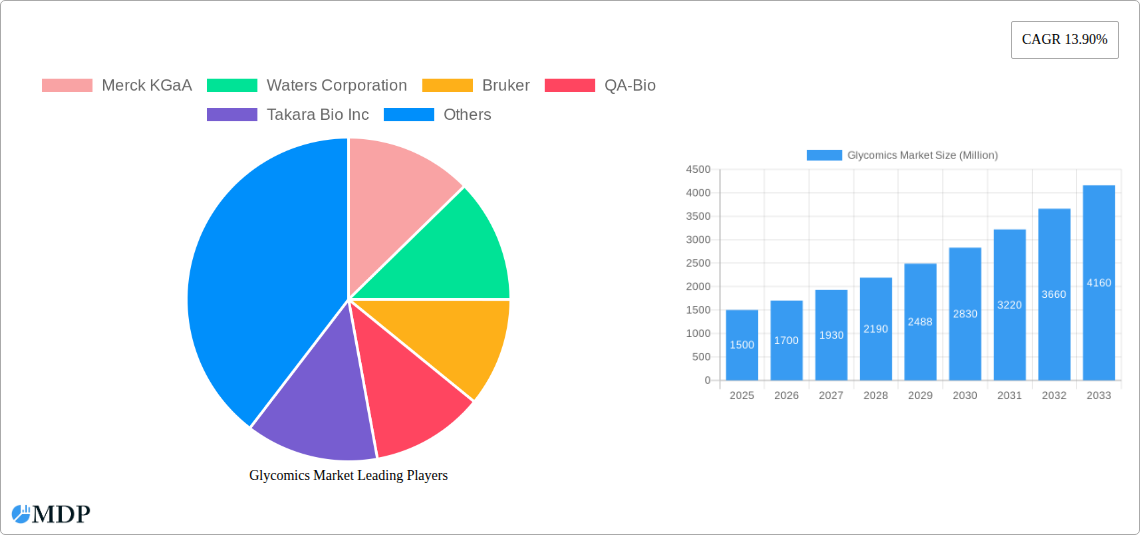
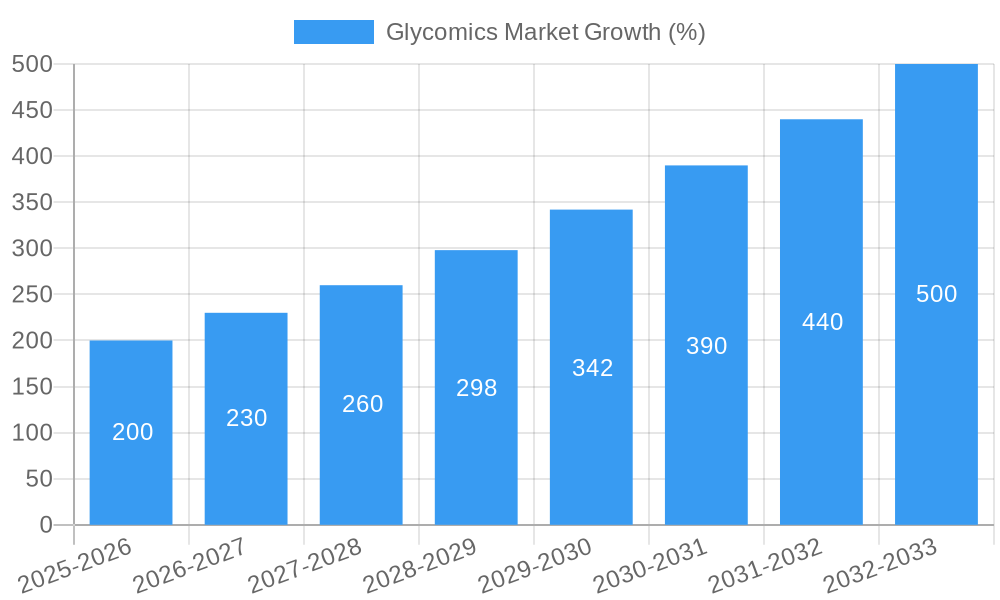
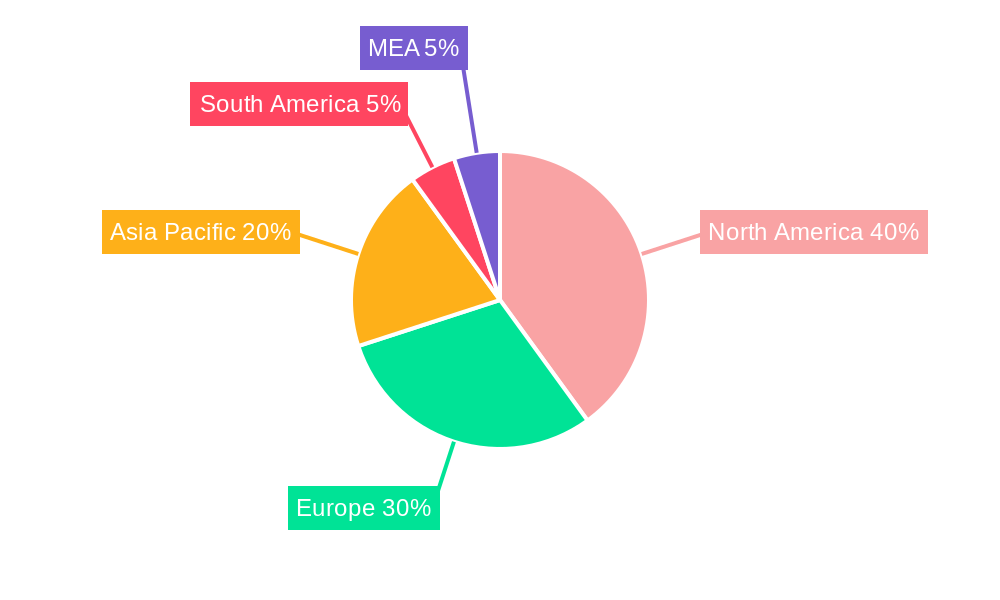
The global glycomics market is experiencing robust growth, driven by the increasing prevalence of chronic diseases like cancer and diabetes, coupled with advancements in glycomics technologies. The market's Compound Annual Growth Rate (CAGR) of 13.90% from 2019 to 2024 indicates significant expansion, projected to continue through 2033. Key drivers include the rising demand for personalized medicine, growing applications in diagnostics and drug development, and the development of innovative tools and techniques for glycan analysis, such as mass spectrometry and microarrays. The market segmentation reveals that instruments and reagents/kits constitute a significant portion of the market, reflecting the need for advanced analytical tools. The drug development application segment is expected to witness substantial growth, propelled by the increasing understanding of the role of glycans in disease pathogenesis and the potential for developing targeted therapies. While regulatory hurdles and the complexity of glycan analysis pose challenges, ongoing research and development are addressing these limitations, paving the way for wider adoption of glycomics technologies across various industries. Geographic analysis reveals that North America and Europe currently dominate the market, owing to the presence of well-established research institutions and pharmaceutical companies. However, the Asia-Pacific region is expected to showcase rapid growth in the coming years, driven by increasing healthcare spending and rising awareness of glycomics' potential.
The competitive landscape is characterized by the presence of both large multinational corporations and specialized biotechnology firms. Key players like Merck KGaA, Waters Corporation, and Thermo Fisher Scientific are investing heavily in research and development, aiming to enhance the sensitivity and throughput of glycomics technologies. Smaller companies are focusing on niche applications and developing innovative solutions. Strategic partnerships and collaborations are becoming increasingly prevalent, furthering innovation and expanding market reach. The future of the glycomics market appears bright, with continued technological advancements promising to unlock further applications in various fields, leading to improved disease diagnosis, treatment, and prevention. This will ultimately drive further market expansion and growth, exceeding the initial projected CAGR in the long term as more complex analyses become readily available.
Glycomics Market Report: 2019-2033 Forecast - Unlock Explosive Growth Potential
This comprehensive Glycomics Market report offers an in-depth analysis of this rapidly evolving sector, providing critical insights for investors, industry stakeholders, and strategic decision-makers. Projected to reach xx Million by 2033, the market presents significant opportunities for growth. This report covers the period 2019-2033, with a focus on the forecast period 2025-2033 and a base year of 2025.
Glycomics Market Dynamics & Concentration
The glycomics market is characterized by moderate concentration, with key players like Merck KGaA, Waters Corporation, and ThermoFisher Scientific Inc holding significant market share. However, the market also features numerous smaller, specialized companies driving innovation. The market is influenced by several dynamic factors:
Innovation Drivers: Advancements in mass spectrometry, microfluidics, and bioinformatics are revolutionizing glycan analysis, driving market expansion. New analytical techniques and improved workflow solutions are constantly being developed.
Regulatory Frameworks: Stringent regulatory requirements for diagnostic and therapeutic applications influence market dynamics, demanding high levels of quality and validation. Changes in regulatory landscape across different geographies significantly impact market growth.
Product Substitutes: While no perfect substitutes exist, alternative technologies for analyzing glycoproteins are emerging, creating competitive pressures and requiring continuous innovation.
End-User Trends: The increasing prevalence of chronic diseases and the growing demand for personalized medicine are fueling market growth. Researchers and clinicians are increasingly recognizing the crucial role of glycans in various diseases.
M&A Activities: A moderate level of mergers and acquisitions (M&A) activity is observed, with approximately xx M&A deals in the past five years, contributing to market consolidation and technology integration. Larger players are actively acquiring smaller companies with specialized technologies to expand their product portfolios. The market share of top 5 companies is approximately xx%.
Glycomics Market Industry Trends & Analysis
The glycomics market is experiencing robust growth, driven by several key trends:
Technological Disruptions: Next-generation sequencing (NGS), advanced imaging techniques, and AI-powered data analysis are transforming glycomics research, leading to improved efficiency and accuracy in glycan analysis. The adoption of these technologies is improving at a CAGR of approximately xx%.
Market Growth Drivers: The rising incidence of chronic diseases such as cancer, diabetes, and autoimmune disorders fuels high demand for glyco-biomarker discovery and development. This trend is expected to continue to drive market expansion.
Consumer Preferences: Growing awareness of the importance of personalized medicine and the role of glycans in health and disease is shaping consumer preferences and driving demand for advanced glycomics-based diagnostics and therapeutics.
Competitive Dynamics: The market is characterized by intense competition among established players and emerging companies. Companies are focusing on expanding their product portfolios, strengthening their technological capabilities, and forging strategic collaborations to gain a competitive edge. Market penetration by leading players is xx%.
Leading Markets & Segments in Glycomics Market
The North American region currently holds the largest share of the global glycomics market, driven by extensive research funding, advanced infrastructure, and the presence of major market players. Within the segments:
By Product Type:
- Instruments: Mass spectrometers dominate the market due to their versatility and high sensitivity.
- Reagents and Kits: The demand for high-quality reagents and kits is rising rapidly as research activities increase.
- Enzymes: Enzymes play a vital role in glycan analysis, with significant market growth observed in this segment.
By Application:
- Drug Development: Glycomics plays a significant role in drug discovery and development, with substantial investment in this area.
- Diagnostics: The development of glycan-based diagnostic tools is accelerating, offering potential for early disease detection and personalized medicine.
- Other Applications: Glycomics is also finding increasing applications in areas such as food science, agriculture, and environmental monitoring.
Key Drivers for North American Dominance:
- Extensive research funding and government initiatives supporting glycomics research.
- Advanced healthcare infrastructure and strong presence of pharmaceutical and biotechnology companies.
- High awareness of the importance of glycomics in disease diagnostics and therapeutics.
Glycomics Market Product Developments
Recent innovations include miniaturized systems for glycan analysis, improved labeling techniques, and automated workflows. These advancements enhance efficiency, throughput, and accuracy, leading to improved diagnostics and therapeutics. New platforms integrating multiple analytical techniques are also emerging, simplifying the workflow and accelerating research. The focus is on improving the speed and accuracy of glycosylation analysis.
Key Drivers of Glycomics Market Growth
Technological advancements, increasing prevalence of chronic diseases, and rising demand for personalized medicine are driving substantial growth. Furthermore, growing research funding and government initiatives, coupled with favorable regulatory frameworks in certain regions, are also significant contributors.
Challenges in the Glycomics Market
High costs associated with instruments and reagents, coupled with the complexity of glycan analysis, pose significant challenges. Additionally, the lack of standardized protocols and data analysis methods limits widespread adoption. Regulatory hurdles in obtaining approvals for new diagnostic tools further constrain market growth.
Emerging Opportunities in Glycomics Market
The development of novel therapeutic strategies targeting glycans presents substantial opportunities. Strategic partnerships and collaborations among research institutions, pharmaceutical companies, and technology providers will accelerate innovation. Expanding into emerging markets with high prevalence of chronic diseases will also drive significant growth.
Leading Players in the Glycomics Market Sector
- Merck KGaA
- Waters Corporation
- Bruker
- QA-Bio
- Takara Bio Inc
- Agilent Technologies Inc
- New England Biolabs Inc
- Shimadzu Corporation
- Danaher (SCIEX)
- ThermoFisher Scientific Inc
Key Milestones in Glycomics Market Industry
- 2020: Launch of a novel mass spectrometry-based platform for high-throughput glycan analysis by Company X.
- 2022: FDA approval of a glycan-based diagnostic test for early detection of cancer by Company Y.
- 2023: Acquisition of a small glycomics company specializing in enzyme technology by Company Z. (Specific dates and company names may vary and require further research)
Strategic Outlook for Glycomics Market
The glycomics market holds immense potential for future growth, driven by continued technological advancements, expanding applications, and increased focus on personalized medicine. Strategic investments in R&D, strategic partnerships, and expansion into emerging markets will be key to unlocking this potential. The market is poised for significant expansion, offering lucrative opportunities for players who can adapt to changing dynamics and develop innovative solutions.
Glycomics Market Segmentation
-
1. Product Type
- 1.1. Instruments
- 1.2. Reagents and Kits
- 1.3. Enzymes
-
2. Application
- 2.1. Drug Development
- 2.2. Diagnostics
- 2.3. Other Applications
Glycomics Market Segmentation By Geography
-
1. North America
- 1.1. United States
- 1.2. Canada
- 1.3. Mexico
-
2. Europe
- 2.1. Germany
- 2.2. United Kingdom
- 2.3. France
- 2.4. Italy
- 2.5. Spain
- 2.6. Rest of Europe
-
3. Asia Pacific
- 3.1. China
- 3.2. Japan
- 3.3. India
- 3.4. Australia
- 3.5. South Korea
- 3.6. Rest of Asia Pacific
- 4. Rest of the World
Glycomics Market REPORT HIGHLIGHTS
| Aspects | Details |
|---|---|
| Study Period | 2019-2033 |
| Base Year | 2024 |
| Estimated Year | 2025 |
| Forecast Period | 2025-2033 |
| Historical Period | 2019-2024 |
| Growth Rate | CAGR of 13.90% from 2019-2033 |
| Segmentation |
|
Table of Contents
- 1. Introduction
- 1.1. Research Scope
- 1.2. Market Segmentation
- 1.3. Research Methodology
- 1.4. Definitions and Assumptions
- 2. Executive Summary
- 2.1. Introduction
- 3. Market Dynamics
- 3.1. Introduction
- 3.2. Market Drivers
- 3.2.1. ; Increasing Research and Development Activities in Glycomics; Technological Advancements in Products
- 3.3. Market Restrains
- 3.3.1. ; Complexity of Glycomics Coupled With The High Cost Involved in the Process
- 3.4. Market Trends
- 3.4.1. Drug Discovery and Development Segment is Expected to Hold a Major Market Share in the Glycomics Market
- 4. Market Factor Analysis
- 4.1. Porters Five Forces
- 4.2. Supply/Value Chain
- 4.3. PESTEL analysis
- 4.4. Market Entropy
- 4.5. Patent/Trademark Analysis
- 5. Global Glycomics Market Analysis, Insights and Forecast, 2019-2031
- 5.1. Market Analysis, Insights and Forecast - by Product Type
- 5.1.1. Instruments
- 5.1.2. Reagents and Kits
- 5.1.3. Enzymes
- 5.2. Market Analysis, Insights and Forecast - by Application
- 5.2.1. Drug Development
- 5.2.2. Diagnostics
- 5.2.3. Other Applications
- 5.3. Market Analysis, Insights and Forecast - by Region
- 5.3.1. North America
- 5.3.2. Europe
- 5.3.3. Asia Pacific
- 5.3.4. Rest of the World
- 5.1. Market Analysis, Insights and Forecast - by Product Type
- 6. North America Glycomics Market Analysis, Insights and Forecast, 2019-2031
- 6.1. Market Analysis, Insights and Forecast - by Product Type
- 6.1.1. Instruments
- 6.1.2. Reagents and Kits
- 6.1.3. Enzymes
- 6.2. Market Analysis, Insights and Forecast - by Application
- 6.2.1. Drug Development
- 6.2.2. Diagnostics
- 6.2.3. Other Applications
- 6.1. Market Analysis, Insights and Forecast - by Product Type
- 7. Europe Glycomics Market Analysis, Insights and Forecast, 2019-2031
- 7.1. Market Analysis, Insights and Forecast - by Product Type
- 7.1.1. Instruments
- 7.1.2. Reagents and Kits
- 7.1.3. Enzymes
- 7.2. Market Analysis, Insights and Forecast - by Application
- 7.2.1. Drug Development
- 7.2.2. Diagnostics
- 7.2.3. Other Applications
- 7.1. Market Analysis, Insights and Forecast - by Product Type
- 8. Asia Pacific Glycomics Market Analysis, Insights and Forecast, 2019-2031
- 8.1. Market Analysis, Insights and Forecast - by Product Type
- 8.1.1. Instruments
- 8.1.2. Reagents and Kits
- 8.1.3. Enzymes
- 8.2. Market Analysis, Insights and Forecast - by Application
- 8.2.1. Drug Development
- 8.2.2. Diagnostics
- 8.2.3. Other Applications
- 8.1. Market Analysis, Insights and Forecast - by Product Type
- 9. Rest of the World Glycomics Market Analysis, Insights and Forecast, 2019-2031
- 9.1. Market Analysis, Insights and Forecast - by Product Type
- 9.1.1. Instruments
- 9.1.2. Reagents and Kits
- 9.1.3. Enzymes
- 9.2. Market Analysis, Insights and Forecast - by Application
- 9.2.1. Drug Development
- 9.2.2. Diagnostics
- 9.2.3. Other Applications
- 9.1. Market Analysis, Insights and Forecast - by Product Type
- 10. North America Glycomics Market Analysis, Insights and Forecast, 2019-2031
- 10.1. Market Analysis, Insights and Forecast - By Country/Sub-region
- 10.1.1 United States
- 10.1.2 Canada
- 10.1.3 Mexico
- 11. Europe Glycomics Market Analysis, Insights and Forecast, 2019-2031
- 11.1. Market Analysis, Insights and Forecast - By Country/Sub-region
- 11.1.1 Germany
- 11.1.2 United Kingdom
- 11.1.3 France
- 11.1.4 Spain
- 11.1.5 Italy
- 11.1.6 Spain
- 11.1.7 Belgium
- 11.1.8 Netherland
- 11.1.9 Nordics
- 11.1.10 Rest of Europe
- 12. Asia Pacific Glycomics Market Analysis, Insights and Forecast, 2019-2031
- 12.1. Market Analysis, Insights and Forecast - By Country/Sub-region
- 12.1.1 China
- 12.1.2 Japan
- 12.1.3 India
- 12.1.4 South Korea
- 12.1.5 Southeast Asia
- 12.1.6 Australia
- 12.1.7 Indonesia
- 12.1.8 Phillipes
- 12.1.9 Singapore
- 12.1.10 Thailandc
- 12.1.11 Rest of Asia Pacific
- 13. South America Glycomics Market Analysis, Insights and Forecast, 2019-2031
- 13.1. Market Analysis, Insights and Forecast - By Country/Sub-region
- 13.1.1 Brazil
- 13.1.2 Argentina
- 13.1.3 Peru
- 13.1.4 Chile
- 13.1.5 Colombia
- 13.1.6 Ecuador
- 13.1.7 Venezuela
- 13.1.8 Rest of South America
- 14. North America Glycomics Market Analysis, Insights and Forecast, 2019-2031
- 14.1. Market Analysis, Insights and Forecast - By Country/Sub-region
- 14.1.1 United States
- 14.1.2 Canada
- 14.1.3 Mexico
- 15. MEA Glycomics Market Analysis, Insights and Forecast, 2019-2031
- 15.1. Market Analysis, Insights and Forecast - By Country/Sub-region
- 15.1.1 United Arab Emirates
- 15.1.2 Saudi Arabia
- 15.1.3 South Africa
- 15.1.4 Rest of Middle East and Africa
- 16. Competitive Analysis
- 16.1. Global Market Share Analysis 2024
- 16.2. Company Profiles
- 16.2.1 Merck KGaA
- 16.2.1.1. Overview
- 16.2.1.2. Products
- 16.2.1.3. SWOT Analysis
- 16.2.1.4. Recent Developments
- 16.2.1.5. Financials (Based on Availability)
- 16.2.2 Waters Corporation
- 16.2.2.1. Overview
- 16.2.2.2. Products
- 16.2.2.3. SWOT Analysis
- 16.2.2.4. Recent Developments
- 16.2.2.5. Financials (Based on Availability)
- 16.2.3 Bruker
- 16.2.3.1. Overview
- 16.2.3.2. Products
- 16.2.3.3. SWOT Analysis
- 16.2.3.4. Recent Developments
- 16.2.3.5. Financials (Based on Availability)
- 16.2.4 QA-Bio
- 16.2.4.1. Overview
- 16.2.4.2. Products
- 16.2.4.3. SWOT Analysis
- 16.2.4.4. Recent Developments
- 16.2.4.5. Financials (Based on Availability)
- 16.2.5 Takara Bio Inc
- 16.2.5.1. Overview
- 16.2.5.2. Products
- 16.2.5.3. SWOT Analysis
- 16.2.5.4. Recent Developments
- 16.2.5.5. Financials (Based on Availability)
- 16.2.6 Agilent Technologies Inc
- 16.2.6.1. Overview
- 16.2.6.2. Products
- 16.2.6.3. SWOT Analysis
- 16.2.6.4. Recent Developments
- 16.2.6.5. Financials (Based on Availability)
- 16.2.7 New England Biolabs Inc
- 16.2.7.1. Overview
- 16.2.7.2. Products
- 16.2.7.3. SWOT Analysis
- 16.2.7.4. Recent Developments
- 16.2.7.5. Financials (Based on Availability)
- 16.2.8 Shimadzu Corporation
- 16.2.8.1. Overview
- 16.2.8.2. Products
- 16.2.8.3. SWOT Analysis
- 16.2.8.4. Recent Developments
- 16.2.8.5. Financials (Based on Availability)
- 16.2.9 Danaher (SCIEX)
- 16.2.9.1. Overview
- 16.2.9.2. Products
- 16.2.9.3. SWOT Analysis
- 16.2.9.4. Recent Developments
- 16.2.9.5. Financials (Based on Availability)
- 16.2.10 ThermoFisher Scientific Inc
- 16.2.10.1. Overview
- 16.2.10.2. Products
- 16.2.10.3. SWOT Analysis
- 16.2.10.4. Recent Developments
- 16.2.10.5. Financials (Based on Availability)
- 16.2.1 Merck KGaA
List of Figures
- Figure 1: Global Glycomics Market Revenue Breakdown (Million, %) by Region 2024 & 2032
- Figure 2: Global Glycomics Market Volume Breakdown (K Unit, %) by Region 2024 & 2032
- Figure 3: North America Glycomics Market Revenue (Million), by Country 2024 & 2032
- Figure 4: North America Glycomics Market Volume (K Unit), by Country 2024 & 2032
- Figure 5: North America Glycomics Market Revenue Share (%), by Country 2024 & 2032
- Figure 6: North America Glycomics Market Volume Share (%), by Country 2024 & 2032
- Figure 7: Europe Glycomics Market Revenue (Million), by Country 2024 & 2032
- Figure 8: Europe Glycomics Market Volume (K Unit), by Country 2024 & 2032
- Figure 9: Europe Glycomics Market Revenue Share (%), by Country 2024 & 2032
- Figure 10: Europe Glycomics Market Volume Share (%), by Country 2024 & 2032
- Figure 11: Asia Pacific Glycomics Market Revenue (Million), by Country 2024 & 2032
- Figure 12: Asia Pacific Glycomics Market Volume (K Unit), by Country 2024 & 2032
- Figure 13: Asia Pacific Glycomics Market Revenue Share (%), by Country 2024 & 2032
- Figure 14: Asia Pacific Glycomics Market Volume Share (%), by Country 2024 & 2032
- Figure 15: South America Glycomics Market Revenue (Million), by Country 2024 & 2032
- Figure 16: South America Glycomics Market Volume (K Unit), by Country 2024 & 2032
- Figure 17: South America Glycomics Market Revenue Share (%), by Country 2024 & 2032
- Figure 18: South America Glycomics Market Volume Share (%), by Country 2024 & 2032
- Figure 19: North America Glycomics Market Revenue (Million), by Country 2024 & 2032
- Figure 20: North America Glycomics Market Volume (K Unit), by Country 2024 & 2032
- Figure 21: North America Glycomics Market Revenue Share (%), by Country 2024 & 2032
- Figure 22: North America Glycomics Market Volume Share (%), by Country 2024 & 2032
- Figure 23: MEA Glycomics Market Revenue (Million), by Country 2024 & 2032
- Figure 24: MEA Glycomics Market Volume (K Unit), by Country 2024 & 2032
- Figure 25: MEA Glycomics Market Revenue Share (%), by Country 2024 & 2032
- Figure 26: MEA Glycomics Market Volume Share (%), by Country 2024 & 2032
- Figure 27: North America Glycomics Market Revenue (Million), by Product Type 2024 & 2032
- Figure 28: North America Glycomics Market Volume (K Unit), by Product Type 2024 & 2032
- Figure 29: North America Glycomics Market Revenue Share (%), by Product Type 2024 & 2032
- Figure 30: North America Glycomics Market Volume Share (%), by Product Type 2024 & 2032
- Figure 31: North America Glycomics Market Revenue (Million), by Application 2024 & 2032
- Figure 32: North America Glycomics Market Volume (K Unit), by Application 2024 & 2032
- Figure 33: North America Glycomics Market Revenue Share (%), by Application 2024 & 2032
- Figure 34: North America Glycomics Market Volume Share (%), by Application 2024 & 2032
- Figure 35: North America Glycomics Market Revenue (Million), by Country 2024 & 2032
- Figure 36: North America Glycomics Market Volume (K Unit), by Country 2024 & 2032
- Figure 37: North America Glycomics Market Revenue Share (%), by Country 2024 & 2032
- Figure 38: North America Glycomics Market Volume Share (%), by Country 2024 & 2032
- Figure 39: Europe Glycomics Market Revenue (Million), by Product Type 2024 & 2032
- Figure 40: Europe Glycomics Market Volume (K Unit), by Product Type 2024 & 2032
- Figure 41: Europe Glycomics Market Revenue Share (%), by Product Type 2024 & 2032
- Figure 42: Europe Glycomics Market Volume Share (%), by Product Type 2024 & 2032
- Figure 43: Europe Glycomics Market Revenue (Million), by Application 2024 & 2032
- Figure 44: Europe Glycomics Market Volume (K Unit), by Application 2024 & 2032
- Figure 45: Europe Glycomics Market Revenue Share (%), by Application 2024 & 2032
- Figure 46: Europe Glycomics Market Volume Share (%), by Application 2024 & 2032
- Figure 47: Europe Glycomics Market Revenue (Million), by Country 2024 & 2032
- Figure 48: Europe Glycomics Market Volume (K Unit), by Country 2024 & 2032
- Figure 49: Europe Glycomics Market Revenue Share (%), by Country 2024 & 2032
- Figure 50: Europe Glycomics Market Volume Share (%), by Country 2024 & 2032
- Figure 51: Asia Pacific Glycomics Market Revenue (Million), by Product Type 2024 & 2032
- Figure 52: Asia Pacific Glycomics Market Volume (K Unit), by Product Type 2024 & 2032
- Figure 53: Asia Pacific Glycomics Market Revenue Share (%), by Product Type 2024 & 2032
- Figure 54: Asia Pacific Glycomics Market Volume Share (%), by Product Type 2024 & 2032
- Figure 55: Asia Pacific Glycomics Market Revenue (Million), by Application 2024 & 2032
- Figure 56: Asia Pacific Glycomics Market Volume (K Unit), by Application 2024 & 2032
- Figure 57: Asia Pacific Glycomics Market Revenue Share (%), by Application 2024 & 2032
- Figure 58: Asia Pacific Glycomics Market Volume Share (%), by Application 2024 & 2032
- Figure 59: Asia Pacific Glycomics Market Revenue (Million), by Country 2024 & 2032
- Figure 60: Asia Pacific Glycomics Market Volume (K Unit), by Country 2024 & 2032
- Figure 61: Asia Pacific Glycomics Market Revenue Share (%), by Country 2024 & 2032
- Figure 62: Asia Pacific Glycomics Market Volume Share (%), by Country 2024 & 2032
- Figure 63: Rest of the World Glycomics Market Revenue (Million), by Product Type 2024 & 2032
- Figure 64: Rest of the World Glycomics Market Volume (K Unit), by Product Type 2024 & 2032
- Figure 65: Rest of the World Glycomics Market Revenue Share (%), by Product Type 2024 & 2032
- Figure 66: Rest of the World Glycomics Market Volume Share (%), by Product Type 2024 & 2032
- Figure 67: Rest of the World Glycomics Market Revenue (Million), by Application 2024 & 2032
- Figure 68: Rest of the World Glycomics Market Volume (K Unit), by Application 2024 & 2032
- Figure 69: Rest of the World Glycomics Market Revenue Share (%), by Application 2024 & 2032
- Figure 70: Rest of the World Glycomics Market Volume Share (%), by Application 2024 & 2032
- Figure 71: Rest of the World Glycomics Market Revenue (Million), by Country 2024 & 2032
- Figure 72: Rest of the World Glycomics Market Volume (K Unit), by Country 2024 & 2032
- Figure 73: Rest of the World Glycomics Market Revenue Share (%), by Country 2024 & 2032
- Figure 74: Rest of the World Glycomics Market Volume Share (%), by Country 2024 & 2032
List of Tables
- Table 1: Global Glycomics Market Revenue Million Forecast, by Region 2019 & 2032
- Table 2: Global Glycomics Market Volume K Unit Forecast, by Region 2019 & 2032
- Table 3: Global Glycomics Market Revenue Million Forecast, by Product Type 2019 & 2032
- Table 4: Global Glycomics Market Volume K Unit Forecast, by Product Type 2019 & 2032
- Table 5: Global Glycomics Market Revenue Million Forecast, by Application 2019 & 2032
- Table 6: Global Glycomics Market Volume K Unit Forecast, by Application 2019 & 2032
- Table 7: Global Glycomics Market Revenue Million Forecast, by Region 2019 & 2032
- Table 8: Global Glycomics Market Volume K Unit Forecast, by Region 2019 & 2032
- Table 9: Global Glycomics Market Revenue Million Forecast, by Country 2019 & 2032
- Table 10: Global Glycomics Market Volume K Unit Forecast, by Country 2019 & 2032
- Table 11: United States Glycomics Market Revenue (Million) Forecast, by Application 2019 & 2032
- Table 12: United States Glycomics Market Volume (K Unit) Forecast, by Application 2019 & 2032
- Table 13: Canada Glycomics Market Revenue (Million) Forecast, by Application 2019 & 2032
- Table 14: Canada Glycomics Market Volume (K Unit) Forecast, by Application 2019 & 2032
- Table 15: Mexico Glycomics Market Revenue (Million) Forecast, by Application 2019 & 2032
- Table 16: Mexico Glycomics Market Volume (K Unit) Forecast, by Application 2019 & 2032
- Table 17: Global Glycomics Market Revenue Million Forecast, by Country 2019 & 2032
- Table 18: Global Glycomics Market Volume K Unit Forecast, by Country 2019 & 2032
- Table 19: Germany Glycomics Market Revenue (Million) Forecast, by Application 2019 & 2032
- Table 20: Germany Glycomics Market Volume (K Unit) Forecast, by Application 2019 & 2032
- Table 21: United Kingdom Glycomics Market Revenue (Million) Forecast, by Application 2019 & 2032
- Table 22: United Kingdom Glycomics Market Volume (K Unit) Forecast, by Application 2019 & 2032
- Table 23: France Glycomics Market Revenue (Million) Forecast, by Application 2019 & 2032
- Table 24: France Glycomics Market Volume (K Unit) Forecast, by Application 2019 & 2032
- Table 25: Spain Glycomics Market Revenue (Million) Forecast, by Application 2019 & 2032
- Table 26: Spain Glycomics Market Volume (K Unit) Forecast, by Application 2019 & 2032
- Table 27: Italy Glycomics Market Revenue (Million) Forecast, by Application 2019 & 2032
- Table 28: Italy Glycomics Market Volume (K Unit) Forecast, by Application 2019 & 2032
- Table 29: Spain Glycomics Market Revenue (Million) Forecast, by Application 2019 & 2032
- Table 30: Spain Glycomics Market Volume (K Unit) Forecast, by Application 2019 & 2032
- Table 31: Belgium Glycomics Market Revenue (Million) Forecast, by Application 2019 & 2032
- Table 32: Belgium Glycomics Market Volume (K Unit) Forecast, by Application 2019 & 2032
- Table 33: Netherland Glycomics Market Revenue (Million) Forecast, by Application 2019 & 2032
- Table 34: Netherland Glycomics Market Volume (K Unit) Forecast, by Application 2019 & 2032
- Table 35: Nordics Glycomics Market Revenue (Million) Forecast, by Application 2019 & 2032
- Table 36: Nordics Glycomics Market Volume (K Unit) Forecast, by Application 2019 & 2032
- Table 37: Rest of Europe Glycomics Market Revenue (Million) Forecast, by Application 2019 & 2032
- Table 38: Rest of Europe Glycomics Market Volume (K Unit) Forecast, by Application 2019 & 2032
- Table 39: Global Glycomics Market Revenue Million Forecast, by Country 2019 & 2032
- Table 40: Global Glycomics Market Volume K Unit Forecast, by Country 2019 & 2032
- Table 41: China Glycomics Market Revenue (Million) Forecast, by Application 2019 & 2032
- Table 42: China Glycomics Market Volume (K Unit) Forecast, by Application 2019 & 2032
- Table 43: Japan Glycomics Market Revenue (Million) Forecast, by Application 2019 & 2032
- Table 44: Japan Glycomics Market Volume (K Unit) Forecast, by Application 2019 & 2032
- Table 45: India Glycomics Market Revenue (Million) Forecast, by Application 2019 & 2032
- Table 46: India Glycomics Market Volume (K Unit) Forecast, by Application 2019 & 2032
- Table 47: South Korea Glycomics Market Revenue (Million) Forecast, by Application 2019 & 2032
- Table 48: South Korea Glycomics Market Volume (K Unit) Forecast, by Application 2019 & 2032
- Table 49: Southeast Asia Glycomics Market Revenue (Million) Forecast, by Application 2019 & 2032
- Table 50: Southeast Asia Glycomics Market Volume (K Unit) Forecast, by Application 2019 & 2032
- Table 51: Australia Glycomics Market Revenue (Million) Forecast, by Application 2019 & 2032
- Table 52: Australia Glycomics Market Volume (K Unit) Forecast, by Application 2019 & 2032
- Table 53: Indonesia Glycomics Market Revenue (Million) Forecast, by Application 2019 & 2032
- Table 54: Indonesia Glycomics Market Volume (K Unit) Forecast, by Application 2019 & 2032
- Table 55: Phillipes Glycomics Market Revenue (Million) Forecast, by Application 2019 & 2032
- Table 56: Phillipes Glycomics Market Volume (K Unit) Forecast, by Application 2019 & 2032
- Table 57: Singapore Glycomics Market Revenue (Million) Forecast, by Application 2019 & 2032
- Table 58: Singapore Glycomics Market Volume (K Unit) Forecast, by Application 2019 & 2032
- Table 59: Thailandc Glycomics Market Revenue (Million) Forecast, by Application 2019 & 2032
- Table 60: Thailandc Glycomics Market Volume (K Unit) Forecast, by Application 2019 & 2032
- Table 61: Rest of Asia Pacific Glycomics Market Revenue (Million) Forecast, by Application 2019 & 2032
- Table 62: Rest of Asia Pacific Glycomics Market Volume (K Unit) Forecast, by Application 2019 & 2032
- Table 63: Global Glycomics Market Revenue Million Forecast, by Country 2019 & 2032
- Table 64: Global Glycomics Market Volume K Unit Forecast, by Country 2019 & 2032
- Table 65: Brazil Glycomics Market Revenue (Million) Forecast, by Application 2019 & 2032
- Table 66: Brazil Glycomics Market Volume (K Unit) Forecast, by Application 2019 & 2032
- Table 67: Argentina Glycomics Market Revenue (Million) Forecast, by Application 2019 & 2032
- Table 68: Argentina Glycomics Market Volume (K Unit) Forecast, by Application 2019 & 2032
- Table 69: Peru Glycomics Market Revenue (Million) Forecast, by Application 2019 & 2032
- Table 70: Peru Glycomics Market Volume (K Unit) Forecast, by Application 2019 & 2032
- Table 71: Chile Glycomics Market Revenue (Million) Forecast, by Application 2019 & 2032
- Table 72: Chile Glycomics Market Volume (K Unit) Forecast, by Application 2019 & 2032
- Table 73: Colombia Glycomics Market Revenue (Million) Forecast, by Application 2019 & 2032
- Table 74: Colombia Glycomics Market Volume (K Unit) Forecast, by Application 2019 & 2032
- Table 75: Ecuador Glycomics Market Revenue (Million) Forecast, by Application 2019 & 2032
- Table 76: Ecuador Glycomics Market Volume (K Unit) Forecast, by Application 2019 & 2032
- Table 77: Venezuela Glycomics Market Revenue (Million) Forecast, by Application 2019 & 2032
- Table 78: Venezuela Glycomics Market Volume (K Unit) Forecast, by Application 2019 & 2032
- Table 79: Rest of South America Glycomics Market Revenue (Million) Forecast, by Application 2019 & 2032
- Table 80: Rest of South America Glycomics Market Volume (K Unit) Forecast, by Application 2019 & 2032
- Table 81: Global Glycomics Market Revenue Million Forecast, by Country 2019 & 2032
- Table 82: Global Glycomics Market Volume K Unit Forecast, by Country 2019 & 2032
- Table 83: United States Glycomics Market Revenue (Million) Forecast, by Application 2019 & 2032
- Table 84: United States Glycomics Market Volume (K Unit) Forecast, by Application 2019 & 2032
- Table 85: Canada Glycomics Market Revenue (Million) Forecast, by Application 2019 & 2032
- Table 86: Canada Glycomics Market Volume (K Unit) Forecast, by Application 2019 & 2032
- Table 87: Mexico Glycomics Market Revenue (Million) Forecast, by Application 2019 & 2032
- Table 88: Mexico Glycomics Market Volume (K Unit) Forecast, by Application 2019 & 2032
- Table 89: Global Glycomics Market Revenue Million Forecast, by Country 2019 & 2032
- Table 90: Global Glycomics Market Volume K Unit Forecast, by Country 2019 & 2032
- Table 91: United Arab Emirates Glycomics Market Revenue (Million) Forecast, by Application 2019 & 2032
- Table 92: United Arab Emirates Glycomics Market Volume (K Unit) Forecast, by Application 2019 & 2032
- Table 93: Saudi Arabia Glycomics Market Revenue (Million) Forecast, by Application 2019 & 2032
- Table 94: Saudi Arabia Glycomics Market Volume (K Unit) Forecast, by Application 2019 & 2032
- Table 95: South Africa Glycomics Market Revenue (Million) Forecast, by Application 2019 & 2032
- Table 96: South Africa Glycomics Market Volume (K Unit) Forecast, by Application 2019 & 2032
- Table 97: Rest of Middle East and Africa Glycomics Market Revenue (Million) Forecast, by Application 2019 & 2032
- Table 98: Rest of Middle East and Africa Glycomics Market Volume (K Unit) Forecast, by Application 2019 & 2032
- Table 99: Global Glycomics Market Revenue Million Forecast, by Product Type 2019 & 2032
- Table 100: Global Glycomics Market Volume K Unit Forecast, by Product Type 2019 & 2032
- Table 101: Global Glycomics Market Revenue Million Forecast, by Application 2019 & 2032
- Table 102: Global Glycomics Market Volume K Unit Forecast, by Application 2019 & 2032
- Table 103: Global Glycomics Market Revenue Million Forecast, by Country 2019 & 2032
- Table 104: Global Glycomics Market Volume K Unit Forecast, by Country 2019 & 2032
- Table 105: United States Glycomics Market Revenue (Million) Forecast, by Application 2019 & 2032
- Table 106: United States Glycomics Market Volume (K Unit) Forecast, by Application 2019 & 2032
- Table 107: Canada Glycomics Market Revenue (Million) Forecast, by Application 2019 & 2032
- Table 108: Canada Glycomics Market Volume (K Unit) Forecast, by Application 2019 & 2032
- Table 109: Mexico Glycomics Market Revenue (Million) Forecast, by Application 2019 & 2032
- Table 110: Mexico Glycomics Market Volume (K Unit) Forecast, by Application 2019 & 2032
- Table 111: Global Glycomics Market Revenue Million Forecast, by Product Type 2019 & 2032
- Table 112: Global Glycomics Market Volume K Unit Forecast, by Product Type 2019 & 2032
- Table 113: Global Glycomics Market Revenue Million Forecast, by Application 2019 & 2032
- Table 114: Global Glycomics Market Volume K Unit Forecast, by Application 2019 & 2032
- Table 115: Global Glycomics Market Revenue Million Forecast, by Country 2019 & 2032
- Table 116: Global Glycomics Market Volume K Unit Forecast, by Country 2019 & 2032
- Table 117: Germany Glycomics Market Revenue (Million) Forecast, by Application 2019 & 2032
- Table 118: Germany Glycomics Market Volume (K Unit) Forecast, by Application 2019 & 2032
- Table 119: United Kingdom Glycomics Market Revenue (Million) Forecast, by Application 2019 & 2032
- Table 120: United Kingdom Glycomics Market Volume (K Unit) Forecast, by Application 2019 & 2032
- Table 121: France Glycomics Market Revenue (Million) Forecast, by Application 2019 & 2032
- Table 122: France Glycomics Market Volume (K Unit) Forecast, by Application 2019 & 2032
- Table 123: Italy Glycomics Market Revenue (Million) Forecast, by Application 2019 & 2032
- Table 124: Italy Glycomics Market Volume (K Unit) Forecast, by Application 2019 & 2032
- Table 125: Spain Glycomics Market Revenue (Million) Forecast, by Application 2019 & 2032
- Table 126: Spain Glycomics Market Volume (K Unit) Forecast, by Application 2019 & 2032
- Table 127: Rest of Europe Glycomics Market Revenue (Million) Forecast, by Application 2019 & 2032
- Table 128: Rest of Europe Glycomics Market Volume (K Unit) Forecast, by Application 2019 & 2032
- Table 129: Global Glycomics Market Revenue Million Forecast, by Product Type 2019 & 2032
- Table 130: Global Glycomics Market Volume K Unit Forecast, by Product Type 2019 & 2032
- Table 131: Global Glycomics Market Revenue Million Forecast, by Application 2019 & 2032
- Table 132: Global Glycomics Market Volume K Unit Forecast, by Application 2019 & 2032
- Table 133: Global Glycomics Market Revenue Million Forecast, by Country 2019 & 2032
- Table 134: Global Glycomics Market Volume K Unit Forecast, by Country 2019 & 2032
- Table 135: China Glycomics Market Revenue (Million) Forecast, by Application 2019 & 2032
- Table 136: China Glycomics Market Volume (K Unit) Forecast, by Application 2019 & 2032
- Table 137: Japan Glycomics Market Revenue (Million) Forecast, by Application 2019 & 2032
- Table 138: Japan Glycomics Market Volume (K Unit) Forecast, by Application 2019 & 2032
- Table 139: India Glycomics Market Revenue (Million) Forecast, by Application 2019 & 2032
- Table 140: India Glycomics Market Volume (K Unit) Forecast, by Application 2019 & 2032
- Table 141: Australia Glycomics Market Revenue (Million) Forecast, by Application 2019 & 2032
- Table 142: Australia Glycomics Market Volume (K Unit) Forecast, by Application 2019 & 2032
- Table 143: South Korea Glycomics Market Revenue (Million) Forecast, by Application 2019 & 2032
- Table 144: South Korea Glycomics Market Volume (K Unit) Forecast, by Application 2019 & 2032
- Table 145: Rest of Asia Pacific Glycomics Market Revenue (Million) Forecast, by Application 2019 & 2032
- Table 146: Rest of Asia Pacific Glycomics Market Volume (K Unit) Forecast, by Application 2019 & 2032
- Table 147: Global Glycomics Market Revenue Million Forecast, by Product Type 2019 & 2032
- Table 148: Global Glycomics Market Volume K Unit Forecast, by Product Type 2019 & 2032
- Table 149: Global Glycomics Market Revenue Million Forecast, by Application 2019 & 2032
- Table 150: Global Glycomics Market Volume K Unit Forecast, by Application 2019 & 2032
- Table 151: Global Glycomics Market Revenue Million Forecast, by Country 2019 & 2032
- Table 152: Global Glycomics Market Volume K Unit Forecast, by Country 2019 & 2032
Frequently Asked Questions
1. What is the projected Compound Annual Growth Rate (CAGR) of the Glycomics Market?
The projected CAGR is approximately 13.90%.
2. Which companies are prominent players in the Glycomics Market?
Key companies in the market include Merck KGaA, Waters Corporation, Bruker, QA-Bio, Takara Bio Inc, Agilent Technologies Inc, New England Biolabs Inc, Shimadzu Corporation, Danaher (SCIEX), ThermoFisher Scientific Inc.
3. What are the main segments of the Glycomics Market?
The market segments include Product Type, Application.
4. Can you provide details about the market size?
The market size is estimated to be USD XX Million as of 2022.
5. What are some drivers contributing to market growth?
; Increasing Research and Development Activities in Glycomics; Technological Advancements in Products.
6. What are the notable trends driving market growth?
Drug Discovery and Development Segment is Expected to Hold a Major Market Share in the Glycomics Market.
7. Are there any restraints impacting market growth?
; Complexity of Glycomics Coupled With The High Cost Involved in the Process.
8. Can you provide examples of recent developments in the market?
N/A
9. What pricing options are available for accessing the report?
Pricing options include single-user, multi-user, and enterprise licenses priced at USD 4750, USD 5250, and USD 8750 respectively.
10. Is the market size provided in terms of value or volume?
The market size is provided in terms of value, measured in Million and volume, measured in K Unit.
11. Are there any specific market keywords associated with the report?
Yes, the market keyword associated with the report is "Glycomics Market," which aids in identifying and referencing the specific market segment covered.
12. How do I determine which pricing option suits my needs best?
The pricing options vary based on user requirements and access needs. Individual users may opt for single-user licenses, while businesses requiring broader access may choose multi-user or enterprise licenses for cost-effective access to the report.
13. Are there any additional resources or data provided in the Glycomics Market report?
While the report offers comprehensive insights, it's advisable to review the specific contents or supplementary materials provided to ascertain if additional resources or data are available.
14. How can I stay updated on further developments or reports in the Glycomics Market?
To stay informed about further developments, trends, and reports in the Glycomics Market, consider subscribing to industry newsletters, following relevant companies and organizations, or regularly checking reputable industry news sources and publications.
Methodology
Step 1 - Identification of Relevant Samples Size from Population Database


Step 2 - Approaches for Defining Global Market Size (Value, Volume* & Price*)

Note*: In applicable scenarios
Step 3 - Data Sources
Primary Research
- Web Analytics
- Survey Reports
- Research Institute
- Latest Research Reports
- Opinion Leaders
Secondary Research
- Annual Reports
- White Paper
- Latest Press Release
- Industry Association
- Paid Database
- Investor Presentations

Step 4 - Data Triangulation
Involves using different sources of information in order to increase the validity of a study
These sources are likely to be stakeholders in a program - participants, other researchers, program staff, other community members, and so on.
Then we put all data in single framework & apply various statistical tools to find out the dynamic on the market.
During the analysis stage, feedback from the stakeholder groups would be compared to determine areas of agreement as well as areas of divergence
