

Key Insights
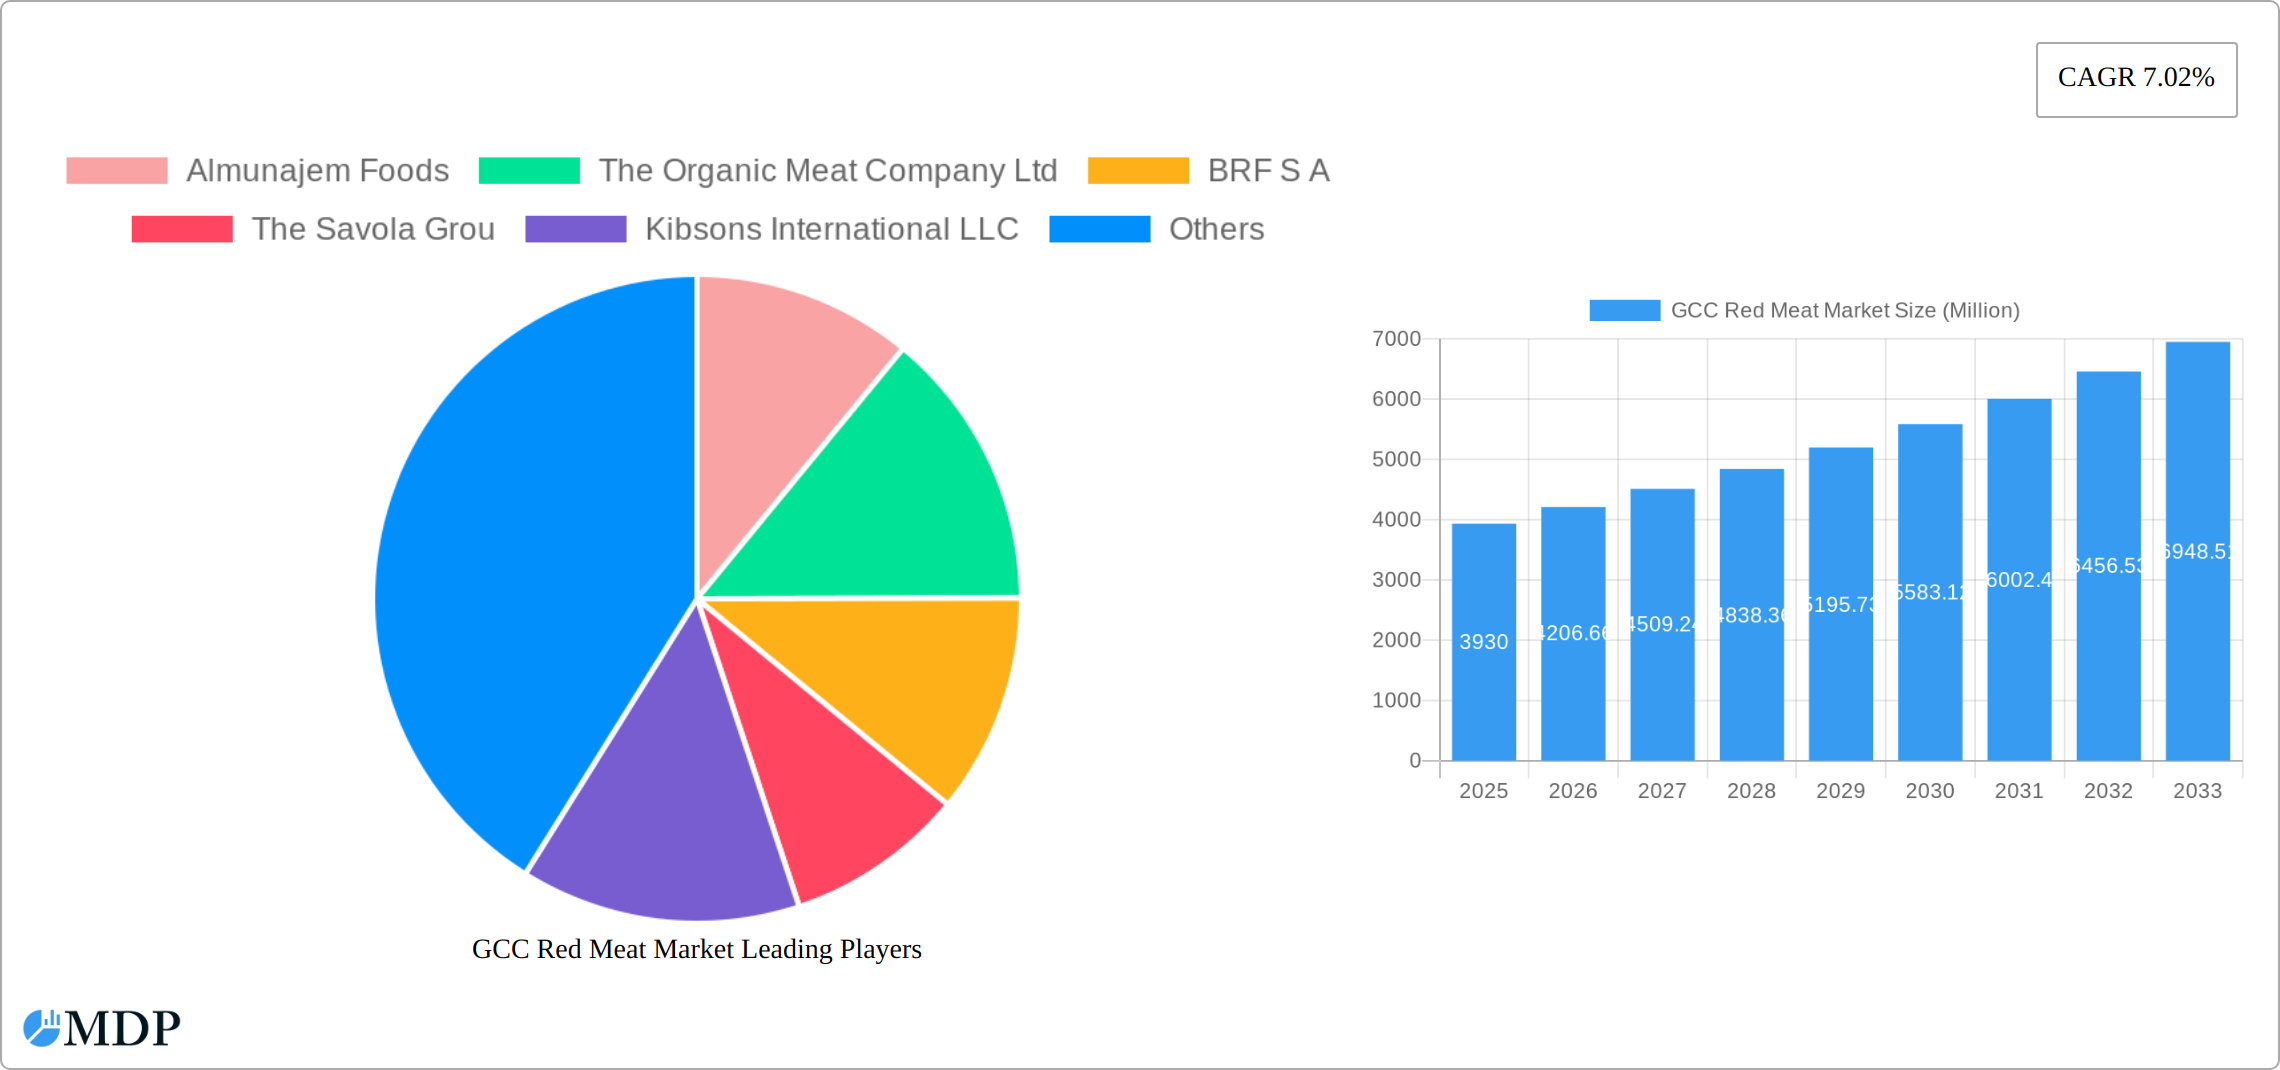
The GCC red meat market, valued at $3.93 billion in 2025, is projected to experience robust growth, driven by several key factors. Increasing consumer disposable incomes across the Gulf Cooperation Council (GCC) nations, coupled with a rising preference for high-quality protein sources, fuels demand for red meat. The expanding food service sector, including restaurants and hotels catering to both local populations and tourists, significantly contributes to market expansion. Furthermore, government initiatives promoting food security and diversification of food sources are likely bolstering domestic red meat production and supporting market growth. The preference for specific cuts and preparations varies regionally, influencing the product mix. For example, Saudi Arabia and the UAE may show higher demand for specific cuts favored in their cuisine. While the canned segment might witness steady growth due to convenience and longer shelf life, fresh and chilled red meat maintains a significant market share owing to consumer preference for quality and freshness. The on-trade channel (restaurants, hotels) is expected to witness growth, fueled by the hospitality sector’s expansion. However, challenges such as fluctuating livestock prices, import regulations, and increasing awareness of health concerns related to red meat consumption could potentially moderate market growth. Competition among major players, including both domestic and international companies, is expected to remain high, necessitating strategic marketing and product differentiation.
The forecast period (2025-2033) anticipates continued growth, projected at a Compound Annual Growth Rate (CAGR) of 7.02%. This growth trajectory will likely be influenced by factors such as population growth, evolving consumer preferences, and government policies related to food security and agricultural development within the GCC region. Specific segments, such as processed red meat, may experience accelerated growth owing to the increasing demand for convenient and ready-to-eat options. The market's geographical segmentation will likely reflect varying consumption patterns across the UAE, Saudi Arabia, South Africa, and the rest of the Middle East and Africa. Companies operating in this market are likely focusing on improving supply chain efficiencies, enhancing product quality, and expanding their distribution networks to cater to the growing demand.
GCC Red Meat Market: A Comprehensive Report (2019-2033)
This in-depth report provides a comprehensive analysis of the GCC red meat market, offering invaluable insights for industry stakeholders. Covering the period from 2019 to 2033, with a focus on 2025, this report unveils market dynamics, trends, and future growth potential. It features detailed analysis of leading companies, segments, and key industry developments, providing actionable intelligence for strategic decision-making. Expect data presented in Millions.
GCC Red Meat Market Market Dynamics & Concentration
The GCC red meat market is a dynamic landscape shaped by several key factors influencing its concentration and overall growth trajectory. While a few major players currently dominate the market, holding approximately xx% of the overall share in 2024, the market is experiencing a shift towards less concentration. This change is driven by increased consumer demand and the emergence of new competitors. Innovative processing and packaging techniques, coupled with the rising popularity of value-added products like marinated meats and ready-to-cook options, are key growth catalysts. The regulatory environment, encompassing food safety standards and import/export regulations, significantly impacts market dynamics and presents both challenges and opportunities for businesses. Furthermore, the period between 2019 and 2024 witnessed significant merger and acquisition (M&A) activity, with xx major deals recorded, reshaping the competitive landscape. The market also faces competition from substitute products such as poultry and plant-based alternatives, although their current impact remains relatively limited. Finally, evolving consumer preferences, increasingly focused on healthier and more sustainably sourced red meat, are playing a crucial role in shaping market trends and influencing product development strategies.
- Market Concentration: Top 5 companies hold xx% market share (2024), indicating a potential for increased competition.
- Innovation Drivers: Advanced processing technologies, value-added products (e.g., marinated meats, ready-to-cook options), sustainable and ethical sourcing practices.
- Regulatory Frameworks: Stringent food safety standards, import/export regulations impacting market access and trade flows.
- Product Substitutes: Growing competition from poultry and plant-based alternatives necessitates strategic adaptation.
- End-User Trends: Increasing demand for healthy, sustainably sourced, and ethically produced red meat fuels premium segment growth.
- M&A Activities: xx major deals (2019-2024) reflecting consolidation and strategic expansion within the industry.
GCC Red Meat Market Industry Trends & Analysis
The GCC red meat market is experiencing robust growth, with a projected Compound Annual Growth Rate (CAGR) of xx% from 2025 to 2033. This expansion is fueled by several interconnected factors, including rising disposable incomes across the region, a growing population, and evolving dietary habits. Technological advancements in meat processing and preservation techniques are leading to improved product quality, extended shelf life, and reduced waste. Consumer preferences are shifting towards premium and organic red meat options, driving growth in higher value segments of the market. The competitive landscape is dynamic, characterized by both established players and new entrants vying for market share. While processed red meat products maintain a significant market penetration (xx% in 2024), substantial opportunities remain for further growth, particularly within niche segments catering to specialized dietary needs and preferences.
Leading Markets & Segments in GCC Red Meat Market
Within the GCC region, Saudi Arabia represents the largest market segment, accounting for approximately xx% of the total market value in 2024. This dominance is attributed to its substantial population, robust economic growth, and well-developed infrastructure. The "Off-Trade" distribution channel, encompassing supermarkets and hypermarkets, holds the largest market share at xx%, highlighting the importance of retail channels in reaching consumers. In terms of product forms, fresh/chilled red meat dominates, representing xx% of the market in 2024. This preference underscores the strong consumer demand for high-quality, fresh products.
- Key Drivers for Saudi Arabia Dominance: Large and growing population, high disposable incomes, strong retail infrastructure, and significant investment in food processing and distribution networks.
- Off-Trade Channel Dominance: Extensive and well-established retail network offering convenience and accessibility to consumers.
- Fresh/Chilled Meat Dominance: Consumer preference for quality, freshness, and food safety, driving demand for premium products.
GCC Red Meat Market Product Developments
Recent product innovations focus on enhancing convenience, improving shelf life, and catering to health-conscious consumers. Technological advancements include modified atmosphere packaging (MAP) and vacuum packaging to extend the freshness of red meat products. Value-added products, such as marinated and ready-to-cook meats, are gaining traction. These developments offer competitive advantages through enhanced product quality, improved shelf life, and increased consumer convenience.
Key Drivers of GCC Red Meat Market Growth
Several factors contribute to the growth of the GCC red meat market. Firstly, rising disposable incomes in the GCC countries fuel higher spending on meat products. Secondly, population growth creates increased demand for protein-rich food sources. Finally, government initiatives promoting domestic meat production and investment in infrastructure support market expansion.
Challenges in the GCC Red Meat Market Market
The GCC red meat market faces challenges, including stringent import regulations and high import tariffs impacting product availability and pricing. Supply chain disruptions and volatility in global commodity prices pose significant risks to market stability. Intense competition among established players and emerging entrants pressures profit margins. The combined impact of these factors results in an estimated xx Million loss in revenue annually.
Emerging Opportunities in GCC Red Meat Market
The GCC red meat market presents several attractive emerging opportunities for businesses. The increasing demand for organic and sustainably produced red meat offers a significant growth avenue, allowing companies to cater to health-conscious consumers. Strategic partnerships between local producers and international companies are facilitating technology transfer, improving production efficiency, and enhancing market access. Expansion into new product categories and the development of innovative value-added offerings (e.g., ready meals, specialty cuts) cater to evolving consumer preferences and contribute to increased profitability.
Leading Players in the GCC Red Meat Market Sector
- Almunajem Foods
- The Organic Meat Company Ltd
- BRF S A
- The Savola Group
- Kibsons International LLC
- JBS SA
- Tanmiah Food Company
- Golden Gate Meat Company
Key Milestones in GCC Red Meat Market Industry
- December 2021: Tanmiah Food Company expands its business model by diversifying into the quick-service restaurant (QSR) sector, leveraging its existing meat production capabilities.
- July 2022: Tanmiah Food Company and Tyson Foods form a strategic partnership focused on expanding meat production capacity, enhancing efficiency, and improving supply chain operations.
- February 2023: Renewal of the partnership between Tanmiah Food Company and Tyson Foods signals continued commitment to growth and investment in the GCC red meat market.
Strategic Outlook for GCC Red Meat Market Market
The GCC red meat market holds substantial growth potential fueled by sustained population growth, rising disposable incomes, and evolving consumer preferences. Strategic opportunities include investments in sustainable and ethical meat production, expansion into niche segments like organic and halal meat, and leveraging technological advancements to enhance product quality and efficiency. This presents significant opportunities for both established players and new entrants seeking to capitalize on the market's potential.
GCC Red Meat Market Segmentation
-
1. Type
- 1.1. Beef
- 1.2. Mutton
- 1.3. Other Meat
-
2. Form
- 2.1. Canned
- 2.2. Fresh / Chilled
- 2.3. Frozen
- 2.4. Processed
-
3. Distribution Channel
-
3.1. Off-Trade
- 3.1.1. Convenience Stores
- 3.1.2. Online Channel
- 3.1.3. Supermarkets and Hypermarkets
- 3.1.4. Others
- 3.2. On-Trade
-
3.1. Off-Trade
GCC Red Meat Market Segmentation By Geography
-
1. North America
- 1.1. United States
- 1.2. Canada
- 1.3. Mexico
-
2. South America
- 2.1. Brazil
- 2.2. Argentina
- 2.3. Rest of South America
-
3. Europe
- 3.1. United Kingdom
- 3.2. Germany
- 3.3. France
- 3.4. Italy
- 3.5. Spain
- 3.6. Russia
- 3.7. Benelux
- 3.8. Nordics
- 3.9. Rest of Europe
-
4. Middle East & Africa
- 4.1. Turkey
- 4.2. Israel
- 4.3. GCC
- 4.4. North Africa
- 4.5. South Africa
- 4.6. Rest of Middle East & Africa
-
5. Asia Pacific
- 5.1. China
- 5.2. India
- 5.3. Japan
- 5.4. South Korea
- 5.5. ASEAN
- 5.6. Oceania
- 5.7. Rest of Asia Pacific

GCC Red Meat Market REPORT HIGHLIGHTS
| Aspects | Details |
|---|---|
| Study Period | 2019-2033 |
| Base Year | 2024 |
| Estimated Year | 2025 |
| Forecast Period | 2025-2033 |
| Historical Period | 2019-2024 |
| Growth Rate | CAGR of 7.02% from 2019-2033 |
| Segmentation |
|
Table of Contents
- 1. Introduction
- 1.1. Research Scope
- 1.2. Market Segmentation
- 1.3. Research Methodology
- 1.4. Definitions and Assumptions
- 2. Executive Summary
- 2.1. Introduction
- 3. Market Dynamics
- 3.1. Introduction
- 3.2. Market Drivers
- 3.2.1. Rising Demand for Clean Label Food & Beverage Products; Rising Demand for Dairy Products
- 3.3. Market Restrains
- 3.3.1. Presence of Preservatives in Ready Meals may Hamper the Market Growth
- 3.4. Market Trends
- 3.4.1. OTHER KEY INDUSTRY TRENDS COVERED IN THE REPORT
- 4. Market Factor Analysis
- 4.1. Porters Five Forces
- 4.2. Supply/Value Chain
- 4.3. PESTEL analysis
- 4.4. Market Entropy
- 4.5. Patent/Trademark Analysis
- 5. Global GCC Red Meat Market Analysis, Insights and Forecast, 2019-2031
- 5.1. Market Analysis, Insights and Forecast - by Type
- 5.1.1. Beef
- 5.1.2. Mutton
- 5.1.3. Other Meat
- 5.2. Market Analysis, Insights and Forecast - by Form
- 5.2.1. Canned
- 5.2.2. Fresh / Chilled
- 5.2.3. Frozen
- 5.2.4. Processed
- 5.3. Market Analysis, Insights and Forecast - by Distribution Channel
- 5.3.1. Off-Trade
- 5.3.1.1. Convenience Stores
- 5.3.1.2. Online Channel
- 5.3.1.3. Supermarkets and Hypermarkets
- 5.3.1.4. Others
- 5.3.2. On-Trade
- 5.3.1. Off-Trade
- 5.4. Market Analysis, Insights and Forecast - by Region
- 5.4.1. North America
- 5.4.2. South America
- 5.4.3. Europe
- 5.4.4. Middle East & Africa
- 5.4.5. Asia Pacific
- 5.1. Market Analysis, Insights and Forecast - by Type
- 6. North America GCC Red Meat Market Analysis, Insights and Forecast, 2019-2031
- 6.1. Market Analysis, Insights and Forecast - by Type
- 6.1.1. Beef
- 6.1.2. Mutton
- 6.1.3. Other Meat
- 6.2. Market Analysis, Insights and Forecast - by Form
- 6.2.1. Canned
- 6.2.2. Fresh / Chilled
- 6.2.3. Frozen
- 6.2.4. Processed
- 6.3. Market Analysis, Insights and Forecast - by Distribution Channel
- 6.3.1. Off-Trade
- 6.3.1.1. Convenience Stores
- 6.3.1.2. Online Channel
- 6.3.1.3. Supermarkets and Hypermarkets
- 6.3.1.4. Others
- 6.3.2. On-Trade
- 6.3.1. Off-Trade
- 6.1. Market Analysis, Insights and Forecast - by Type
- 7. South America GCC Red Meat Market Analysis, Insights and Forecast, 2019-2031
- 7.1. Market Analysis, Insights and Forecast - by Type
- 7.1.1. Beef
- 7.1.2. Mutton
- 7.1.3. Other Meat
- 7.2. Market Analysis, Insights and Forecast - by Form
- 7.2.1. Canned
- 7.2.2. Fresh / Chilled
- 7.2.3. Frozen
- 7.2.4. Processed
- 7.3. Market Analysis, Insights and Forecast - by Distribution Channel
- 7.3.1. Off-Trade
- 7.3.1.1. Convenience Stores
- 7.3.1.2. Online Channel
- 7.3.1.3. Supermarkets and Hypermarkets
- 7.3.1.4. Others
- 7.3.2. On-Trade
- 7.3.1. Off-Trade
- 7.1. Market Analysis, Insights and Forecast - by Type
- 8. Europe GCC Red Meat Market Analysis, Insights and Forecast, 2019-2031
- 8.1. Market Analysis, Insights and Forecast - by Type
- 8.1.1. Beef
- 8.1.2. Mutton
- 8.1.3. Other Meat
- 8.2. Market Analysis, Insights and Forecast - by Form
- 8.2.1. Canned
- 8.2.2. Fresh / Chilled
- 8.2.3. Frozen
- 8.2.4. Processed
- 8.3. Market Analysis, Insights and Forecast - by Distribution Channel
- 8.3.1. Off-Trade
- 8.3.1.1. Convenience Stores
- 8.3.1.2. Online Channel
- 8.3.1.3. Supermarkets and Hypermarkets
- 8.3.1.4. Others
- 8.3.2. On-Trade
- 8.3.1. Off-Trade
- 8.1. Market Analysis, Insights and Forecast - by Type
- 9. Middle East & Africa GCC Red Meat Market Analysis, Insights and Forecast, 2019-2031
- 9.1. Market Analysis, Insights and Forecast - by Type
- 9.1.1. Beef
- 9.1.2. Mutton
- 9.1.3. Other Meat
- 9.2. Market Analysis, Insights and Forecast - by Form
- 9.2.1. Canned
- 9.2.2. Fresh / Chilled
- 9.2.3. Frozen
- 9.2.4. Processed
- 9.3. Market Analysis, Insights and Forecast - by Distribution Channel
- 9.3.1. Off-Trade
- 9.3.1.1. Convenience Stores
- 9.3.1.2. Online Channel
- 9.3.1.3. Supermarkets and Hypermarkets
- 9.3.1.4. Others
- 9.3.2. On-Trade
- 9.3.1. Off-Trade
- 9.1. Market Analysis, Insights and Forecast - by Type
- 10. Asia Pacific GCC Red Meat Market Analysis, Insights and Forecast, 2019-2031
- 10.1. Market Analysis, Insights and Forecast - by Type
- 10.1.1. Beef
- 10.1.2. Mutton
- 10.1.3. Other Meat
- 10.2. Market Analysis, Insights and Forecast - by Form
- 10.2.1. Canned
- 10.2.2. Fresh / Chilled
- 10.2.3. Frozen
- 10.2.4. Processed
- 10.3. Market Analysis, Insights and Forecast - by Distribution Channel
- 10.3.1. Off-Trade
- 10.3.1.1. Convenience Stores
- 10.3.1.2. Online Channel
- 10.3.1.3. Supermarkets and Hypermarkets
- 10.3.1.4. Others
- 10.3.2. On-Trade
- 10.3.1. Off-Trade
- 10.1. Market Analysis, Insights and Forecast - by Type
- 11. UAE GCC Red Meat Market Analysis, Insights and Forecast, 2019-2031
- 12. South Africa GCC Red Meat Market Analysis, Insights and Forecast, 2019-2031
- 13. Saudi Arabia GCC Red Meat Market Analysis, Insights and Forecast, 2019-2031
- 14. Rest of MEA GCC Red Meat Market Analysis, Insights and Forecast, 2019-2031
- 15. Competitive Analysis
- 15.1. Global Market Share Analysis 2024
- 15.2. Company Profiles
- 15.2.1 Almunajem Foods
- 15.2.1.1. Overview
- 15.2.1.2. Products
- 15.2.1.3. SWOT Analysis
- 15.2.1.4. Recent Developments
- 15.2.1.5. Financials (Based on Availability)
- 15.2.2 The Organic Meat Company Ltd
- 15.2.2.1. Overview
- 15.2.2.2. Products
- 15.2.2.3. SWOT Analysis
- 15.2.2.4. Recent Developments
- 15.2.2.5. Financials (Based on Availability)
- 15.2.3 BRF S A
- 15.2.3.1. Overview
- 15.2.3.2. Products
- 15.2.3.3. SWOT Analysis
- 15.2.3.4. Recent Developments
- 15.2.3.5. Financials (Based on Availability)
- 15.2.4 The Savola Grou
- 15.2.4.1. Overview
- 15.2.4.2. Products
- 15.2.4.3. SWOT Analysis
- 15.2.4.4. Recent Developments
- 15.2.4.5. Financials (Based on Availability)
- 15.2.5 Kibsons International LLC
- 15.2.5.1. Overview
- 15.2.5.2. Products
- 15.2.5.3. SWOT Analysis
- 15.2.5.4. Recent Developments
- 15.2.5.5. Financials (Based on Availability)
- 15.2.6 JBS SA
- 15.2.6.1. Overview
- 15.2.6.2. Products
- 15.2.6.3. SWOT Analysis
- 15.2.6.4. Recent Developments
- 15.2.6.5. Financials (Based on Availability)
- 15.2.7 Tanmiah Food Company
- 15.2.7.1. Overview
- 15.2.7.2. Products
- 15.2.7.3. SWOT Analysis
- 15.2.7.4. Recent Developments
- 15.2.7.5. Financials (Based on Availability)
- 15.2.8 Golden Gate Meat Company
- 15.2.8.1. Overview
- 15.2.8.2. Products
- 15.2.8.3. SWOT Analysis
- 15.2.8.4. Recent Developments
- 15.2.8.5. Financials (Based on Availability)
- 15.2.1 Almunajem Foods
List of Figures
- Figure 1: Global GCC Red Meat Market Revenue Breakdown (Million, %) by Region 2024 & 2032
- Figure 2: Global GCC Red Meat Market Volume Breakdown (K Tons, %) by Region 2024 & 2032
- Figure 3: Middle East & Africa GCC Red Meat Market Revenue (Million), by Country 2024 & 2032
- Figure 4: Middle East & Africa GCC Red Meat Market Volume (K Tons), by Country 2024 & 2032
- Figure 5: Middle East & Africa GCC Red Meat Market Revenue Share (%), by Country 2024 & 2032
- Figure 6: Middle East & Africa GCC Red Meat Market Volume Share (%), by Country 2024 & 2032
- Figure 7: North America GCC Red Meat Market Revenue (Million), by Type 2024 & 2032
- Figure 8: North America GCC Red Meat Market Volume (K Tons), by Type 2024 & 2032
- Figure 9: North America GCC Red Meat Market Revenue Share (%), by Type 2024 & 2032
- Figure 10: North America GCC Red Meat Market Volume Share (%), by Type 2024 & 2032
- Figure 11: North America GCC Red Meat Market Revenue (Million), by Form 2024 & 2032
- Figure 12: North America GCC Red Meat Market Volume (K Tons), by Form 2024 & 2032
- Figure 13: North America GCC Red Meat Market Revenue Share (%), by Form 2024 & 2032
- Figure 14: North America GCC Red Meat Market Volume Share (%), by Form 2024 & 2032
- Figure 15: North America GCC Red Meat Market Revenue (Million), by Distribution Channel 2024 & 2032
- Figure 16: North America GCC Red Meat Market Volume (K Tons), by Distribution Channel 2024 & 2032
- Figure 17: North America GCC Red Meat Market Revenue Share (%), by Distribution Channel 2024 & 2032
- Figure 18: North America GCC Red Meat Market Volume Share (%), by Distribution Channel 2024 & 2032
- Figure 19: North America GCC Red Meat Market Revenue (Million), by Country 2024 & 2032
- Figure 20: North America GCC Red Meat Market Volume (K Tons), by Country 2024 & 2032
- Figure 21: North America GCC Red Meat Market Revenue Share (%), by Country 2024 & 2032
- Figure 22: North America GCC Red Meat Market Volume Share (%), by Country 2024 & 2032
- Figure 23: South America GCC Red Meat Market Revenue (Million), by Type 2024 & 2032
- Figure 24: South America GCC Red Meat Market Volume (K Tons), by Type 2024 & 2032
- Figure 25: South America GCC Red Meat Market Revenue Share (%), by Type 2024 & 2032
- Figure 26: South America GCC Red Meat Market Volume Share (%), by Type 2024 & 2032
- Figure 27: South America GCC Red Meat Market Revenue (Million), by Form 2024 & 2032
- Figure 28: South America GCC Red Meat Market Volume (K Tons), by Form 2024 & 2032
- Figure 29: South America GCC Red Meat Market Revenue Share (%), by Form 2024 & 2032
- Figure 30: South America GCC Red Meat Market Volume Share (%), by Form 2024 & 2032
- Figure 31: South America GCC Red Meat Market Revenue (Million), by Distribution Channel 2024 & 2032
- Figure 32: South America GCC Red Meat Market Volume (K Tons), by Distribution Channel 2024 & 2032
- Figure 33: South America GCC Red Meat Market Revenue Share (%), by Distribution Channel 2024 & 2032
- Figure 34: South America GCC Red Meat Market Volume Share (%), by Distribution Channel 2024 & 2032
- Figure 35: South America GCC Red Meat Market Revenue (Million), by Country 2024 & 2032
- Figure 36: South America GCC Red Meat Market Volume (K Tons), by Country 2024 & 2032
- Figure 37: South America GCC Red Meat Market Revenue Share (%), by Country 2024 & 2032
- Figure 38: South America GCC Red Meat Market Volume Share (%), by Country 2024 & 2032
- Figure 39: Europe GCC Red Meat Market Revenue (Million), by Type 2024 & 2032
- Figure 40: Europe GCC Red Meat Market Volume (K Tons), by Type 2024 & 2032
- Figure 41: Europe GCC Red Meat Market Revenue Share (%), by Type 2024 & 2032
- Figure 42: Europe GCC Red Meat Market Volume Share (%), by Type 2024 & 2032
- Figure 43: Europe GCC Red Meat Market Revenue (Million), by Form 2024 & 2032
- Figure 44: Europe GCC Red Meat Market Volume (K Tons), by Form 2024 & 2032
- Figure 45: Europe GCC Red Meat Market Revenue Share (%), by Form 2024 & 2032
- Figure 46: Europe GCC Red Meat Market Volume Share (%), by Form 2024 & 2032
- Figure 47: Europe GCC Red Meat Market Revenue (Million), by Distribution Channel 2024 & 2032
- Figure 48: Europe GCC Red Meat Market Volume (K Tons), by Distribution Channel 2024 & 2032
- Figure 49: Europe GCC Red Meat Market Revenue Share (%), by Distribution Channel 2024 & 2032
- Figure 50: Europe GCC Red Meat Market Volume Share (%), by Distribution Channel 2024 & 2032
- Figure 51: Europe GCC Red Meat Market Revenue (Million), by Country 2024 & 2032
- Figure 52: Europe GCC Red Meat Market Volume (K Tons), by Country 2024 & 2032
- Figure 53: Europe GCC Red Meat Market Revenue Share (%), by Country 2024 & 2032
- Figure 54: Europe GCC Red Meat Market Volume Share (%), by Country 2024 & 2032
- Figure 55: Middle East & Africa GCC Red Meat Market Revenue (Million), by Type 2024 & 2032
- Figure 56: Middle East & Africa GCC Red Meat Market Volume (K Tons), by Type 2024 & 2032
- Figure 57: Middle East & Africa GCC Red Meat Market Revenue Share (%), by Type 2024 & 2032
- Figure 58: Middle East & Africa GCC Red Meat Market Volume Share (%), by Type 2024 & 2032
- Figure 59: Middle East & Africa GCC Red Meat Market Revenue (Million), by Form 2024 & 2032
- Figure 60: Middle East & Africa GCC Red Meat Market Volume (K Tons), by Form 2024 & 2032
- Figure 61: Middle East & Africa GCC Red Meat Market Revenue Share (%), by Form 2024 & 2032
- Figure 62: Middle East & Africa GCC Red Meat Market Volume Share (%), by Form 2024 & 2032
- Figure 63: Middle East & Africa GCC Red Meat Market Revenue (Million), by Distribution Channel 2024 & 2032
- Figure 64: Middle East & Africa GCC Red Meat Market Volume (K Tons), by Distribution Channel 2024 & 2032
- Figure 65: Middle East & Africa GCC Red Meat Market Revenue Share (%), by Distribution Channel 2024 & 2032
- Figure 66: Middle East & Africa GCC Red Meat Market Volume Share (%), by Distribution Channel 2024 & 2032
- Figure 67: Middle East & Africa GCC Red Meat Market Revenue (Million), by Country 2024 & 2032
- Figure 68: Middle East & Africa GCC Red Meat Market Volume (K Tons), by Country 2024 & 2032
- Figure 69: Middle East & Africa GCC Red Meat Market Revenue Share (%), by Country 2024 & 2032
- Figure 70: Middle East & Africa GCC Red Meat Market Volume Share (%), by Country 2024 & 2032
- Figure 71: Asia Pacific GCC Red Meat Market Revenue (Million), by Type 2024 & 2032
- Figure 72: Asia Pacific GCC Red Meat Market Volume (K Tons), by Type 2024 & 2032
- Figure 73: Asia Pacific GCC Red Meat Market Revenue Share (%), by Type 2024 & 2032
- Figure 74: Asia Pacific GCC Red Meat Market Volume Share (%), by Type 2024 & 2032
- Figure 75: Asia Pacific GCC Red Meat Market Revenue (Million), by Form 2024 & 2032
- Figure 76: Asia Pacific GCC Red Meat Market Volume (K Tons), by Form 2024 & 2032
- Figure 77: Asia Pacific GCC Red Meat Market Revenue Share (%), by Form 2024 & 2032
- Figure 78: Asia Pacific GCC Red Meat Market Volume Share (%), by Form 2024 & 2032
- Figure 79: Asia Pacific GCC Red Meat Market Revenue (Million), by Distribution Channel 2024 & 2032
- Figure 80: Asia Pacific GCC Red Meat Market Volume (K Tons), by Distribution Channel 2024 & 2032
- Figure 81: Asia Pacific GCC Red Meat Market Revenue Share (%), by Distribution Channel 2024 & 2032
- Figure 82: Asia Pacific GCC Red Meat Market Volume Share (%), by Distribution Channel 2024 & 2032
- Figure 83: Asia Pacific GCC Red Meat Market Revenue (Million), by Country 2024 & 2032
- Figure 84: Asia Pacific GCC Red Meat Market Volume (K Tons), by Country 2024 & 2032
- Figure 85: Asia Pacific GCC Red Meat Market Revenue Share (%), by Country 2024 & 2032
- Figure 86: Asia Pacific GCC Red Meat Market Volume Share (%), by Country 2024 & 2032
List of Tables
- Table 1: Global GCC Red Meat Market Revenue Million Forecast, by Region 2019 & 2032
- Table 2: Global GCC Red Meat Market Volume K Tons Forecast, by Region 2019 & 2032
- Table 3: Global GCC Red Meat Market Revenue Million Forecast, by Type 2019 & 2032
- Table 4: Global GCC Red Meat Market Volume K Tons Forecast, by Type 2019 & 2032
- Table 5: Global GCC Red Meat Market Revenue Million Forecast, by Form 2019 & 2032
- Table 6: Global GCC Red Meat Market Volume K Tons Forecast, by Form 2019 & 2032
- Table 7: Global GCC Red Meat Market Revenue Million Forecast, by Distribution Channel 2019 & 2032
- Table 8: Global GCC Red Meat Market Volume K Tons Forecast, by Distribution Channel 2019 & 2032
- Table 9: Global GCC Red Meat Market Revenue Million Forecast, by Region 2019 & 2032
- Table 10: Global GCC Red Meat Market Volume K Tons Forecast, by Region 2019 & 2032
- Table 11: Global GCC Red Meat Market Revenue Million Forecast, by Country 2019 & 2032
- Table 12: Global GCC Red Meat Market Volume K Tons Forecast, by Country 2019 & 2032
- Table 13: UAE GCC Red Meat Market Revenue (Million) Forecast, by Application 2019 & 2032
- Table 14: UAE GCC Red Meat Market Volume (K Tons) Forecast, by Application 2019 & 2032
- Table 15: South Africa GCC Red Meat Market Revenue (Million) Forecast, by Application 2019 & 2032
- Table 16: South Africa GCC Red Meat Market Volume (K Tons) Forecast, by Application 2019 & 2032
- Table 17: Saudi Arabia GCC Red Meat Market Revenue (Million) Forecast, by Application 2019 & 2032
- Table 18: Saudi Arabia GCC Red Meat Market Volume (K Tons) Forecast, by Application 2019 & 2032
- Table 19: Rest of MEA GCC Red Meat Market Revenue (Million) Forecast, by Application 2019 & 2032
- Table 20: Rest of MEA GCC Red Meat Market Volume (K Tons) Forecast, by Application 2019 & 2032
- Table 21: Global GCC Red Meat Market Revenue Million Forecast, by Type 2019 & 2032
- Table 22: Global GCC Red Meat Market Volume K Tons Forecast, by Type 2019 & 2032
- Table 23: Global GCC Red Meat Market Revenue Million Forecast, by Form 2019 & 2032
- Table 24: Global GCC Red Meat Market Volume K Tons Forecast, by Form 2019 & 2032
- Table 25: Global GCC Red Meat Market Revenue Million Forecast, by Distribution Channel 2019 & 2032
- Table 26: Global GCC Red Meat Market Volume K Tons Forecast, by Distribution Channel 2019 & 2032
- Table 27: Global GCC Red Meat Market Revenue Million Forecast, by Country 2019 & 2032
- Table 28: Global GCC Red Meat Market Volume K Tons Forecast, by Country 2019 & 2032
- Table 29: United States GCC Red Meat Market Revenue (Million) Forecast, by Application 2019 & 2032
- Table 30: United States GCC Red Meat Market Volume (K Tons) Forecast, by Application 2019 & 2032
- Table 31: Canada GCC Red Meat Market Revenue (Million) Forecast, by Application 2019 & 2032
- Table 32: Canada GCC Red Meat Market Volume (K Tons) Forecast, by Application 2019 & 2032
- Table 33: Mexico GCC Red Meat Market Revenue (Million) Forecast, by Application 2019 & 2032
- Table 34: Mexico GCC Red Meat Market Volume (K Tons) Forecast, by Application 2019 & 2032
- Table 35: Global GCC Red Meat Market Revenue Million Forecast, by Type 2019 & 2032
- Table 36: Global GCC Red Meat Market Volume K Tons Forecast, by Type 2019 & 2032
- Table 37: Global GCC Red Meat Market Revenue Million Forecast, by Form 2019 & 2032
- Table 38: Global GCC Red Meat Market Volume K Tons Forecast, by Form 2019 & 2032
- Table 39: Global GCC Red Meat Market Revenue Million Forecast, by Distribution Channel 2019 & 2032
- Table 40: Global GCC Red Meat Market Volume K Tons Forecast, by Distribution Channel 2019 & 2032
- Table 41: Global GCC Red Meat Market Revenue Million Forecast, by Country 2019 & 2032
- Table 42: Global GCC Red Meat Market Volume K Tons Forecast, by Country 2019 & 2032
- Table 43: Brazil GCC Red Meat Market Revenue (Million) Forecast, by Application 2019 & 2032
- Table 44: Brazil GCC Red Meat Market Volume (K Tons) Forecast, by Application 2019 & 2032
- Table 45: Argentina GCC Red Meat Market Revenue (Million) Forecast, by Application 2019 & 2032
- Table 46: Argentina GCC Red Meat Market Volume (K Tons) Forecast, by Application 2019 & 2032
- Table 47: Rest of South America GCC Red Meat Market Revenue (Million) Forecast, by Application 2019 & 2032
- Table 48: Rest of South America GCC Red Meat Market Volume (K Tons) Forecast, by Application 2019 & 2032
- Table 49: Global GCC Red Meat Market Revenue Million Forecast, by Type 2019 & 2032
- Table 50: Global GCC Red Meat Market Volume K Tons Forecast, by Type 2019 & 2032
- Table 51: Global GCC Red Meat Market Revenue Million Forecast, by Form 2019 & 2032
- Table 52: Global GCC Red Meat Market Volume K Tons Forecast, by Form 2019 & 2032
- Table 53: Global GCC Red Meat Market Revenue Million Forecast, by Distribution Channel 2019 & 2032
- Table 54: Global GCC Red Meat Market Volume K Tons Forecast, by Distribution Channel 2019 & 2032
- Table 55: Global GCC Red Meat Market Revenue Million Forecast, by Country 2019 & 2032
- Table 56: Global GCC Red Meat Market Volume K Tons Forecast, by Country 2019 & 2032
- Table 57: United Kingdom GCC Red Meat Market Revenue (Million) Forecast, by Application 2019 & 2032
- Table 58: United Kingdom GCC Red Meat Market Volume (K Tons) Forecast, by Application 2019 & 2032
- Table 59: Germany GCC Red Meat Market Revenue (Million) Forecast, by Application 2019 & 2032
- Table 60: Germany GCC Red Meat Market Volume (K Tons) Forecast, by Application 2019 & 2032
- Table 61: France GCC Red Meat Market Revenue (Million) Forecast, by Application 2019 & 2032
- Table 62: France GCC Red Meat Market Volume (K Tons) Forecast, by Application 2019 & 2032
- Table 63: Italy GCC Red Meat Market Revenue (Million) Forecast, by Application 2019 & 2032
- Table 64: Italy GCC Red Meat Market Volume (K Tons) Forecast, by Application 2019 & 2032
- Table 65: Spain GCC Red Meat Market Revenue (Million) Forecast, by Application 2019 & 2032
- Table 66: Spain GCC Red Meat Market Volume (K Tons) Forecast, by Application 2019 & 2032
- Table 67: Russia GCC Red Meat Market Revenue (Million) Forecast, by Application 2019 & 2032
- Table 68: Russia GCC Red Meat Market Volume (K Tons) Forecast, by Application 2019 & 2032
- Table 69: Benelux GCC Red Meat Market Revenue (Million) Forecast, by Application 2019 & 2032
- Table 70: Benelux GCC Red Meat Market Volume (K Tons) Forecast, by Application 2019 & 2032
- Table 71: Nordics GCC Red Meat Market Revenue (Million) Forecast, by Application 2019 & 2032
- Table 72: Nordics GCC Red Meat Market Volume (K Tons) Forecast, by Application 2019 & 2032
- Table 73: Rest of Europe GCC Red Meat Market Revenue (Million) Forecast, by Application 2019 & 2032
- Table 74: Rest of Europe GCC Red Meat Market Volume (K Tons) Forecast, by Application 2019 & 2032
- Table 75: Global GCC Red Meat Market Revenue Million Forecast, by Type 2019 & 2032
- Table 76: Global GCC Red Meat Market Volume K Tons Forecast, by Type 2019 & 2032
- Table 77: Global GCC Red Meat Market Revenue Million Forecast, by Form 2019 & 2032
- Table 78: Global GCC Red Meat Market Volume K Tons Forecast, by Form 2019 & 2032
- Table 79: Global GCC Red Meat Market Revenue Million Forecast, by Distribution Channel 2019 & 2032
- Table 80: Global GCC Red Meat Market Volume K Tons Forecast, by Distribution Channel 2019 & 2032
- Table 81: Global GCC Red Meat Market Revenue Million Forecast, by Country 2019 & 2032
- Table 82: Global GCC Red Meat Market Volume K Tons Forecast, by Country 2019 & 2032
- Table 83: Turkey GCC Red Meat Market Revenue (Million) Forecast, by Application 2019 & 2032
- Table 84: Turkey GCC Red Meat Market Volume (K Tons) Forecast, by Application 2019 & 2032
- Table 85: Israel GCC Red Meat Market Revenue (Million) Forecast, by Application 2019 & 2032
- Table 86: Israel GCC Red Meat Market Volume (K Tons) Forecast, by Application 2019 & 2032
- Table 87: GCC GCC Red Meat Market Revenue (Million) Forecast, by Application 2019 & 2032
- Table 88: GCC GCC Red Meat Market Volume (K Tons) Forecast, by Application 2019 & 2032
- Table 89: North Africa GCC Red Meat Market Revenue (Million) Forecast, by Application 2019 & 2032
- Table 90: North Africa GCC Red Meat Market Volume (K Tons) Forecast, by Application 2019 & 2032
- Table 91: South Africa GCC Red Meat Market Revenue (Million) Forecast, by Application 2019 & 2032
- Table 92: South Africa GCC Red Meat Market Volume (K Tons) Forecast, by Application 2019 & 2032
- Table 93: Rest of Middle East & Africa GCC Red Meat Market Revenue (Million) Forecast, by Application 2019 & 2032
- Table 94: Rest of Middle East & Africa GCC Red Meat Market Volume (K Tons) Forecast, by Application 2019 & 2032
- Table 95: Global GCC Red Meat Market Revenue Million Forecast, by Type 2019 & 2032
- Table 96: Global GCC Red Meat Market Volume K Tons Forecast, by Type 2019 & 2032
- Table 97: Global GCC Red Meat Market Revenue Million Forecast, by Form 2019 & 2032
- Table 98: Global GCC Red Meat Market Volume K Tons Forecast, by Form 2019 & 2032
- Table 99: Global GCC Red Meat Market Revenue Million Forecast, by Distribution Channel 2019 & 2032
- Table 100: Global GCC Red Meat Market Volume K Tons Forecast, by Distribution Channel 2019 & 2032
- Table 101: Global GCC Red Meat Market Revenue Million Forecast, by Country 2019 & 2032
- Table 102: Global GCC Red Meat Market Volume K Tons Forecast, by Country 2019 & 2032
- Table 103: China GCC Red Meat Market Revenue (Million) Forecast, by Application 2019 & 2032
- Table 104: China GCC Red Meat Market Volume (K Tons) Forecast, by Application 2019 & 2032
- Table 105: India GCC Red Meat Market Revenue (Million) Forecast, by Application 2019 & 2032
- Table 106: India GCC Red Meat Market Volume (K Tons) Forecast, by Application 2019 & 2032
- Table 107: Japan GCC Red Meat Market Revenue (Million) Forecast, by Application 2019 & 2032
- Table 108: Japan GCC Red Meat Market Volume (K Tons) Forecast, by Application 2019 & 2032
- Table 109: South Korea GCC Red Meat Market Revenue (Million) Forecast, by Application 2019 & 2032
- Table 110: South Korea GCC Red Meat Market Volume (K Tons) Forecast, by Application 2019 & 2032
- Table 111: ASEAN GCC Red Meat Market Revenue (Million) Forecast, by Application 2019 & 2032
- Table 112: ASEAN GCC Red Meat Market Volume (K Tons) Forecast, by Application 2019 & 2032
- Table 113: Oceania GCC Red Meat Market Revenue (Million) Forecast, by Application 2019 & 2032
- Table 114: Oceania GCC Red Meat Market Volume (K Tons) Forecast, by Application 2019 & 2032
- Table 115: Rest of Asia Pacific GCC Red Meat Market Revenue (Million) Forecast, by Application 2019 & 2032
- Table 116: Rest of Asia Pacific GCC Red Meat Market Volume (K Tons) Forecast, by Application 2019 & 2032
Frequently Asked Questions
1. What is the projected Compound Annual Growth Rate (CAGR) of the GCC Red Meat Market?
The projected CAGR is approximately 7.02%.
2. Which companies are prominent players in the GCC Red Meat Market?
Key companies in the market include Almunajem Foods, The Organic Meat Company Ltd, BRF S A, The Savola Grou, Kibsons International LLC, JBS SA, Tanmiah Food Company, Golden Gate Meat Company.
3. What are the main segments of the GCC Red Meat Market?
The market segments include Type, Form, Distribution Channel.
4. Can you provide details about the market size?
The market size is estimated to be USD 3.93 Million as of 2022.
5. What are some drivers contributing to market growth?
Rising Demand for Clean Label Food & Beverage Products; Rising Demand for Dairy Products.
6. What are the notable trends driving market growth?
OTHER KEY INDUSTRY TRENDS COVERED IN THE REPORT.
7. Are there any restraints impacting market growth?
Presence of Preservatives in Ready Meals may Hamper the Market Growth.
8. Can you provide examples of recent developments in the market?
February 2023: Saudi-based Tanmiah Food Company and US-based Tyson Foods Inc. renewed their partnership signed previously in 2022. The partnership was signed in order to recognize the potential growth opportunities across Saudi Arabia and the broader Middle East.July 2022: Tanmiah Food Company and Tyson Foods entered a strategic partnership to expand meat production capacity. The investment is expected to enable Tanmiah Food Company to access the high demand for protein in the Middle East and other international markets.December 2021: Tanmiah Food Company’s wholly owned subsidiary Gulf Brand Fast Food Co. signed a master franchise and development agreement with Popeyes, an international quick service restaurant chain, to diversify across the value chain by offering high-quality food options, including Popeyes Chicken Sandwich made from fresh and locally sourced fresh chicken.
9. What pricing options are available for accessing the report?
Pricing options include single-user, multi-user, and enterprise licenses priced at USD 3800, USD 4500, and USD 5800 respectively.
10. Is the market size provided in terms of value or volume?
The market size is provided in terms of value, measured in Million and volume, measured in K Tons.
11. Are there any specific market keywords associated with the report?
Yes, the market keyword associated with the report is "GCC Red Meat Market," which aids in identifying and referencing the specific market segment covered.
12. How do I determine which pricing option suits my needs best?
The pricing options vary based on user requirements and access needs. Individual users may opt for single-user licenses, while businesses requiring broader access may choose multi-user or enterprise licenses for cost-effective access to the report.
13. Are there any additional resources or data provided in the GCC Red Meat Market report?
While the report offers comprehensive insights, it's advisable to review the specific contents or supplementary materials provided to ascertain if additional resources or data are available.
14. How can I stay updated on further developments or reports in the GCC Red Meat Market?
To stay informed about further developments, trends, and reports in the GCC Red Meat Market, consider subscribing to industry newsletters, following relevant companies and organizations, or regularly checking reputable industry news sources and publications.
Methodology
Step 1 - Identification of Relevant Samples Size from Population Database


Step 2 - Approaches for Defining Global Market Size (Value, Volume* & Price*)

Note*: In applicable scenarios
Step 3 - Data Sources
Primary Research
- Web Analytics
- Survey Reports
- Research Institute
- Latest Research Reports
- Opinion Leaders
Secondary Research
- Annual Reports
- White Paper
- Latest Press Release
- Industry Association
- Paid Database
- Investor Presentations

Step 4 - Data Triangulation
Involves using different sources of information in order to increase the validity of a study
These sources are likely to be stakeholders in a program - participants, other researchers, program staff, other community members, and so on.
Then we put all data in single framework & apply various statistical tools to find out the dynamic on the market.
During the analysis stage, feedback from the stakeholder groups would be compared to determine areas of agreement as well as areas of divergence
