

Key Insights
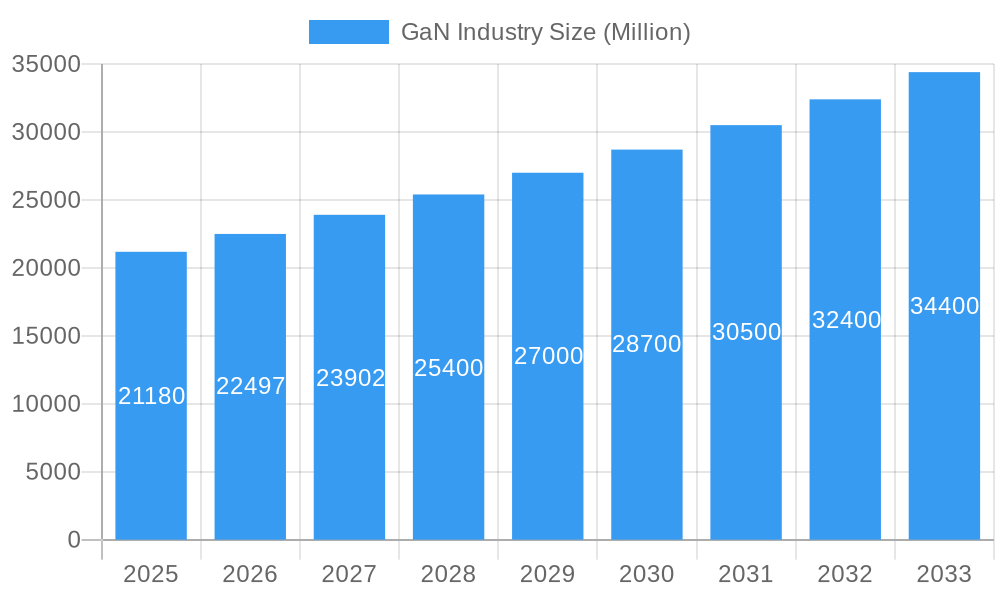
The GaN semiconductor market, valued at $21.18 billion in 2025, is experiencing robust growth, projected to expand at a Compound Annual Growth Rate (CAGR) of 6.06% from 2025 to 2033. This expansion is driven by several key factors. The increasing demand for energy-efficient power solutions across various industries, notably automotive and consumer electronics, fuels the adoption of GaN-based devices. GaN's superior performance characteristics, including higher switching frequencies and lower power losses compared to traditional silicon, are significant drivers. Furthermore, advancements in GaN technology are leading to smaller, more efficient power supplies, crucial for miniaturization trends in electronics. The automotive sector's push towards electric vehicles (EVs) and hybrid electric vehicles (HEVs) is a major catalyst, demanding high-efficiency power electronics that GaN excels at providing. The growing adoption of 5G infrastructure and the proliferation of high-power applications in data centers also contribute to the market's growth trajectory. While supply chain complexities and the relatively high cost of GaN devices currently pose some restraints, ongoing technological improvements and economies of scale are expected to mitigate these challenges in the coming years.
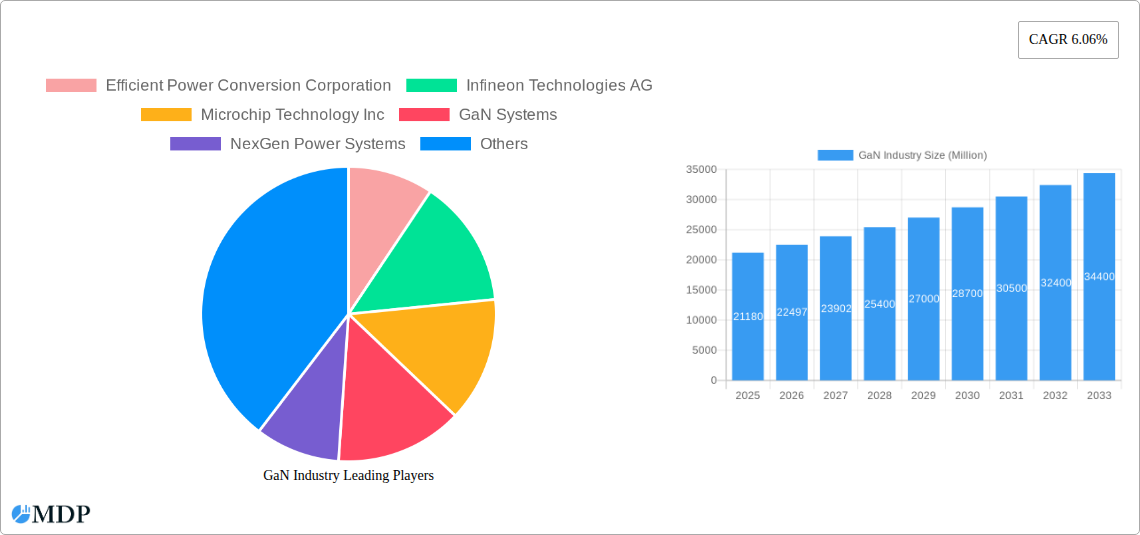
GaN Industry Market Size (In Billion)
The market segmentation reveals significant opportunities across different device types and end-user industries. Power semiconductors represent a substantial portion of the market, fueled by the increasing demand for efficient power conversion in various applications. Within devices, transistors and power ICs are expected to witness the fastest growth, driven by their increasing integration in high-power density applications. Geographically, North America and Asia Pacific are leading markets, benefiting from strong technological advancements and substantial manufacturing capacities. However, the market in regions like Europe and Asia Pacific (excluding China and Japan) also presents significant growth potential, primarily driven by the increasing adoption of energy-efficient technologies and growing investments in infrastructure development. Key players like Infineon, Microchip, and Wolfspeed are driving innovation and expanding their market share through strategic partnerships, research and development investments, and product diversification. The continued evolution of GaN technology and its growing adoption across various sectors ensures sustained market growth in the foreseeable future.
GaN Industry Company Market Share
GaN Industry Market Report: 2019-2033 Forecast
This comprehensive report provides a detailed analysis of the GaN industry, projecting a market valued at xx Million by 2033. Gain crucial insights into market dynamics, leading players, emerging trends, and future growth opportunities. Ideal for investors, industry professionals, and strategic decision-makers seeking a deep understanding of this rapidly evolving sector. The report covers the period from 2019 to 2033, with a base year of 2025 and a forecast period of 2025-2033.
GaN Industry Market Dynamics & Concentration
The GaN industry is characterized by a moderately concentrated market structure, with key players like Infineon Technologies AG, Wolfspeed Inc, and NXP Semiconductors holding significant market share. However, the landscape is dynamic, with ongoing mergers and acquisitions (M&A) activity shaping the competitive dynamics. In 2024 alone, there were approximately xx M&A deals in the GaN sector, primarily driven by the need to expand product portfolios and access new technologies. The market's innovation is fueled by increasing demand for energy-efficient electronics and the advancements in GaN technology. Stringent regulatory frameworks, particularly concerning energy efficiency and environmental impact, are further driving the adoption of GaN-based solutions. While silicon-based semiconductors remain a dominant substitute, GaN's superior performance characteristics in power conversion are progressively eroding this advantage. End-user trends show a strong preference for smaller, lighter, and more efficient devices, bolstering the growth of the GaN market across various sectors.
- Market Share (2024): Infineon: xx%; Wolfspeed: xx%; NXP: xx%; Others: xx%
- M&A Deal Count (2024): xx
- Key Innovation Drivers: Improved energy efficiency, higher switching frequencies, smaller form factors.
- Regulatory Influences: Government initiatives promoting energy efficiency and renewable energy technologies.
GaN Industry Industry Trends & Analysis
The GaN industry is experiencing robust growth, driven by several factors. The Compound Annual Growth Rate (CAGR) for the forecast period (2025-2033) is estimated at xx%, exceeding the historical CAGR of xx% (2019-2024). This growth is fueled by a confluence of factors, including technological advancements that continuously improve GaN's performance, cost-effectiveness, and reliability. Technological disruptions, particularly in power electronics and RF applications, are opening up new markets for GaN devices. Consumer preference for energy-efficient electronics is creating a large market demand. The competitive landscape is characterized by intense innovation and strategic partnerships, leading to continuous improvements in product performance and cost reductions. Market penetration is growing rapidly across multiple end-user industries, indicating strong adoption rates.
Leading Markets & Segments in GaN Industry
The Power Semiconductors segment holds the largest market share within the GaN industry by type, followed by RF Semiconductors and Opto-Semiconductors. Within devices, Transistors dominate the market due to their widespread application in power electronics. The Automotive sector represents the largest end-user industry for GaN devices, driven by the increasing demand for electric vehicles and hybrid electric vehicles (HEVs). North America and Asia are the leading regions for GaN adoption due to robust technological infrastructure, supportive government policies, and strong presence of major industry players.
- Key Drivers for Automotive Sector Dominance: Stringent emission norms, increasing adoption of EVs and HEVs.
- Key Drivers for North America and Asia: Strong technological innovation, significant investments in R&D, government support.
Other Leading Segments (By Type):
- RF Semiconductors: Growing demand in 5G infrastructure and mobile devices.
- Opto-Semiconductors: Applications in lighting and sensing technologies.
Other Leading Segments (By Devices):
- Power ICs: Increasing integration of multiple functions onto a single chip.
- Diodes and Rectifiers: Essential components in power conversion circuits.
Other Leading Segments (By End-user Industry):
- Consumer Electronics: Demand for efficient charging solutions and power adapters.
- Aerospace & Defense: Applications in radar systems, satellite communication, and power systems.
GaN Industry Product Developments
Recent product developments reflect a push towards higher power density, increased efficiency, and improved thermal management. Innovations include the development of GaN-based power integrated circuits (PICs) integrating multiple components into a single package, leading to smaller form factors and simplified designs. Companies are focusing on optimizing GaN devices for specific applications, enhancing their competitive advantages by improving efficiency, reliability, and overall performance. This targeted approach caters to the diverse demands of various end-user industries.
Key Drivers of GaN Industry Growth
Several factors are propelling the growth of the GaN industry. Technological advancements leading to improved performance, lower cost, and higher reliability of GaN devices are key drivers. The growing demand for energy-efficient electronics across various sectors, including consumer electronics, automotive, and renewable energy, creates substantial market opportunities. Government regulations promoting energy efficiency and the adoption of renewable energy technologies also contribute to this growth. For example, many governments are offering incentives and subsidies for the development and deployment of GaN-based technologies, encouraging innovation and adoption.
Challenges in the GaN Industry Market
The GaN industry faces several challenges, including the relatively high cost of GaN devices compared to silicon-based alternatives. Supply chain disruptions can impact the availability and pricing of raw materials and manufacturing capacity. Intense competition among existing and emerging players necessitates constant innovation and cost reduction to maintain market share. These factors can impact the industry's growth trajectory. For example, xx% of the GaN manufacturing facilities faced disruptions in 2024, resulting in an estimated xx Million loss in production.
Emerging Opportunities in GaN Industry
Significant growth potential lies in the expansion of GaN applications into new sectors, such as 5G infrastructure, data centers, and industrial automation. Strategic partnerships between GaN manufacturers and system integrators are streamlining the adoption of GaN technologies, accelerating market penetration. Breakthroughs in GaN-on-silicon technology and advancements in packaging technologies are poised to significantly reduce costs, opening up new opportunities in cost-sensitive markets. Expansion into emerging economies presents significant long-term growth potential.
Leading Players in the GaN Industry Sector
- Efficient Power Conversion Corporation
- Infineon Technologies AG
- Microchip Technology Inc
- GaN Systems
- NexGen Power Systems
- NXP Semiconductors
- Wolfspeed Inc
- Toshiba Electronic Devices & Storage Corporation
- Soitec
- Qorvo Inc
- Texas Instruments Incorporated
- NTT Advanced Technology Corporation
- List Not Exhaustive
Key Milestones in GaN Industry Industry
- July 2023: STMicroelectronics begins large-scale manufacturing of e-mode PowerGaN HEMT devices, significantly expanding production capacity and driving down costs.
- January 2024: Silvaco Group, Inc. partners with GaN Valley to advance GaN power device design using its Victory TCAD platform, accelerating innovation in GaN technology.
Strategic Outlook for GaN Industry Market
The GaN industry is poised for significant growth, driven by continued technological innovation, expanding applications across various sectors, and supportive government policies. Strategic partnerships and investments in R&D are expected to accelerate the adoption of GaN technologies, further solidifying its position as a leading semiconductor technology. The long-term market potential is substantial, and companies focusing on efficiency, cost reduction, and product diversification are best positioned to capitalize on the growth opportunities.
GaN Industry Segmentation
-
1. Type
- 1.1. Power Semiconductors
- 1.2. Opto-Semiconductors
- 1.3. RF Semiconductors
-
2. Devices
- 2.1. Transistors
- 2.2. Diodes
- 2.3. Rectifiers
- 2.4. Power ICs
-
3. End-user Industry
- 3.1. Automotive
- 3.2. Consumer Electronics
- 3.3. Aerospace and Defense
- 3.4. Medical
- 3.5. Information Communication and Technology
- 3.6. Other End-user Industries
GaN Industry Segmentation By Geography
- 1. United States
- 2. Europe
- 3. Japan
- 4. China
- 5. Korea
- 6. Taiwan
- 7. Latin America
- 8. Middle East and Africa
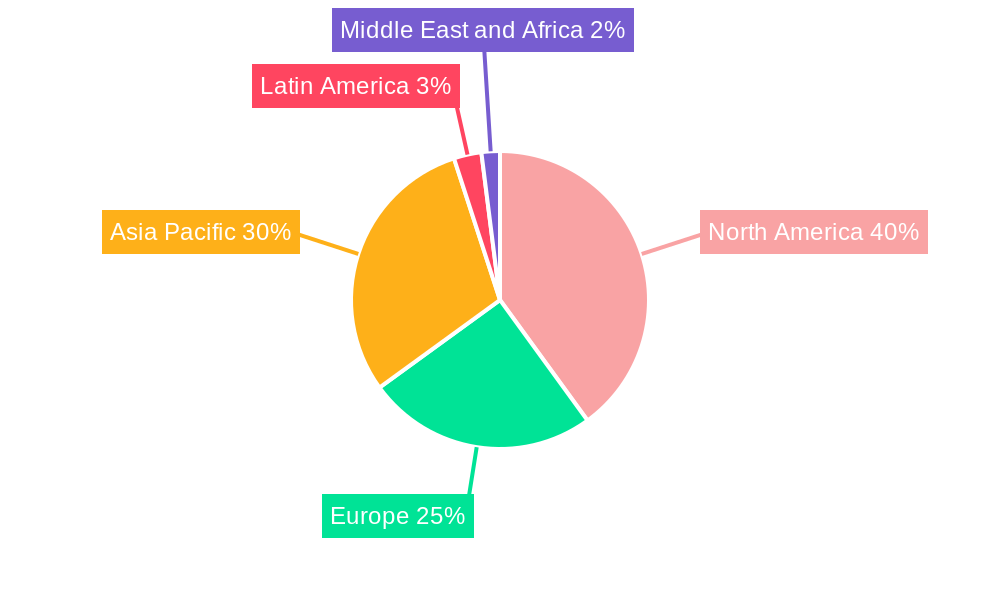
GaN Industry Regional Market Share
Geographic Coverage of GaN Industry
GaN Industry REPORT HIGHLIGHTS
| Aspects | Details |
|---|---|
| Study Period | 2020-2034 |
| Base Year | 2025 |
| Estimated Year | 2026 |
| Forecast Period | 2026-2034 |
| Historical Period | 2020-2025 |
| Growth Rate | CAGR of 6.06% from 2020-2034 |
| Segmentation |
|
Table of Contents
- 1. Introduction
- 1.1. Research Scope
- 1.2. Market Segmentation
- 1.3. Research Methodology
- 1.4. Definitions and Assumptions
- 2. Executive Summary
- 2.1. Introduction
- 3. Market Dynamics
- 3.1. Introduction
- 3.2. Market Drivers
- 3.2.1. Strong Demand from Telecom Infrastructure Segment Driven by Advancements in 5G Implementation; Favorable Attributes Such As High-performance and Small Form Factor to Drive Adoption in the Military Segment
- 3.3. Market Restrains
- 3.3.1. ; Declining Volume of Traditional Mails; High Adoption Costs
- 3.4. Market Trends
- 3.4.1. Consumer Electronics to Hold Significant Market Share
- 4. Market Factor Analysis
- 4.1. Porters Five Forces
- 4.2. Supply/Value Chain
- 4.3. PESTEL analysis
- 4.4. Market Entropy
- 4.5. Patent/Trademark Analysis
- 5. Global GaN Industry Analysis, Insights and Forecast, 2020-2032
- 5.1. Market Analysis, Insights and Forecast - by Type
- 5.1.1. Power Semiconductors
- 5.1.2. Opto-Semiconductors
- 5.1.3. RF Semiconductors
- 5.2. Market Analysis, Insights and Forecast - by Devices
- 5.2.1. Transistors
- 5.2.2. Diodes
- 5.2.3. Rectifiers
- 5.2.4. Power ICs
- 5.3. Market Analysis, Insights and Forecast - by End-user Industry
- 5.3.1. Automotive
- 5.3.2. Consumer Electronics
- 5.3.3. Aerospace and Defense
- 5.3.4. Medical
- 5.3.5. Information Communication and Technology
- 5.3.6. Other End-user Industries
- 5.4. Market Analysis, Insights and Forecast - by Region
- 5.4.1. United States
- 5.4.2. Europe
- 5.4.3. Japan
- 5.4.4. China
- 5.4.5. Korea
- 5.4.6. Taiwan
- 5.4.7. Latin America
- 5.4.8. Middle East and Africa
- 5.1. Market Analysis, Insights and Forecast - by Type
- 6. United States GaN Industry Analysis, Insights and Forecast, 2020-2032
- 6.1. Market Analysis, Insights and Forecast - by Type
- 6.1.1. Power Semiconductors
- 6.1.2. Opto-Semiconductors
- 6.1.3. RF Semiconductors
- 6.2. Market Analysis, Insights and Forecast - by Devices
- 6.2.1. Transistors
- 6.2.2. Diodes
- 6.2.3. Rectifiers
- 6.2.4. Power ICs
- 6.3. Market Analysis, Insights and Forecast - by End-user Industry
- 6.3.1. Automotive
- 6.3.2. Consumer Electronics
- 6.3.3. Aerospace and Defense
- 6.3.4. Medical
- 6.3.5. Information Communication and Technology
- 6.3.6. Other End-user Industries
- 6.1. Market Analysis, Insights and Forecast - by Type
- 7. Europe GaN Industry Analysis, Insights and Forecast, 2020-2032
- 7.1. Market Analysis, Insights and Forecast - by Type
- 7.1.1. Power Semiconductors
- 7.1.2. Opto-Semiconductors
- 7.1.3. RF Semiconductors
- 7.2. Market Analysis, Insights and Forecast - by Devices
- 7.2.1. Transistors
- 7.2.2. Diodes
- 7.2.3. Rectifiers
- 7.2.4. Power ICs
- 7.3. Market Analysis, Insights and Forecast - by End-user Industry
- 7.3.1. Automotive
- 7.3.2. Consumer Electronics
- 7.3.3. Aerospace and Defense
- 7.3.4. Medical
- 7.3.5. Information Communication and Technology
- 7.3.6. Other End-user Industries
- 7.1. Market Analysis, Insights and Forecast - by Type
- 8. Japan GaN Industry Analysis, Insights and Forecast, 2020-2032
- 8.1. Market Analysis, Insights and Forecast - by Type
- 8.1.1. Power Semiconductors
- 8.1.2. Opto-Semiconductors
- 8.1.3. RF Semiconductors
- 8.2. Market Analysis, Insights and Forecast - by Devices
- 8.2.1. Transistors
- 8.2.2. Diodes
- 8.2.3. Rectifiers
- 8.2.4. Power ICs
- 8.3. Market Analysis, Insights and Forecast - by End-user Industry
- 8.3.1. Automotive
- 8.3.2. Consumer Electronics
- 8.3.3. Aerospace and Defense
- 8.3.4. Medical
- 8.3.5. Information Communication and Technology
- 8.3.6. Other End-user Industries
- 8.1. Market Analysis, Insights and Forecast - by Type
- 9. China GaN Industry Analysis, Insights and Forecast, 2020-2032
- 9.1. Market Analysis, Insights and Forecast - by Type
- 9.1.1. Power Semiconductors
- 9.1.2. Opto-Semiconductors
- 9.1.3. RF Semiconductors
- 9.2. Market Analysis, Insights and Forecast - by Devices
- 9.2.1. Transistors
- 9.2.2. Diodes
- 9.2.3. Rectifiers
- 9.2.4. Power ICs
- 9.3. Market Analysis, Insights and Forecast - by End-user Industry
- 9.3.1. Automotive
- 9.3.2. Consumer Electronics
- 9.3.3. Aerospace and Defense
- 9.3.4. Medical
- 9.3.5. Information Communication and Technology
- 9.3.6. Other End-user Industries
- 9.1. Market Analysis, Insights and Forecast - by Type
- 10. Korea GaN Industry Analysis, Insights and Forecast, 2020-2032
- 10.1. Market Analysis, Insights and Forecast - by Type
- 10.1.1. Power Semiconductors
- 10.1.2. Opto-Semiconductors
- 10.1.3. RF Semiconductors
- 10.2. Market Analysis, Insights and Forecast - by Devices
- 10.2.1. Transistors
- 10.2.2. Diodes
- 10.2.3. Rectifiers
- 10.2.4. Power ICs
- 10.3. Market Analysis, Insights and Forecast - by End-user Industry
- 10.3.1. Automotive
- 10.3.2. Consumer Electronics
- 10.3.3. Aerospace and Defense
- 10.3.4. Medical
- 10.3.5. Information Communication and Technology
- 10.3.6. Other End-user Industries
- 10.1. Market Analysis, Insights and Forecast - by Type
- 11. Taiwan GaN Industry Analysis, Insights and Forecast, 2020-2032
- 11.1. Market Analysis, Insights and Forecast - by Type
- 11.1.1. Power Semiconductors
- 11.1.2. Opto-Semiconductors
- 11.1.3. RF Semiconductors
- 11.2. Market Analysis, Insights and Forecast - by Devices
- 11.2.1. Transistors
- 11.2.2. Diodes
- 11.2.3. Rectifiers
- 11.2.4. Power ICs
- 11.3. Market Analysis, Insights and Forecast - by End-user Industry
- 11.3.1. Automotive
- 11.3.2. Consumer Electronics
- 11.3.3. Aerospace and Defense
- 11.3.4. Medical
- 11.3.5. Information Communication and Technology
- 11.3.6. Other End-user Industries
- 11.1. Market Analysis, Insights and Forecast - by Type
- 12. Latin America GaN Industry Analysis, Insights and Forecast, 2020-2032
- 12.1. Market Analysis, Insights and Forecast - by Type
- 12.1.1. Power Semiconductors
- 12.1.2. Opto-Semiconductors
- 12.1.3. RF Semiconductors
- 12.2. Market Analysis, Insights and Forecast - by Devices
- 12.2.1. Transistors
- 12.2.2. Diodes
- 12.2.3. Rectifiers
- 12.2.4. Power ICs
- 12.3. Market Analysis, Insights and Forecast - by End-user Industry
- 12.3.1. Automotive
- 12.3.2. Consumer Electronics
- 12.3.3. Aerospace and Defense
- 12.3.4. Medical
- 12.3.5. Information Communication and Technology
- 12.3.6. Other End-user Industries
- 12.1. Market Analysis, Insights and Forecast - by Type
- 13. Middle East and Africa GaN Industry Analysis, Insights and Forecast, 2020-2032
- 13.1. Market Analysis, Insights and Forecast - by Type
- 13.1.1. Power Semiconductors
- 13.1.2. Opto-Semiconductors
- 13.1.3. RF Semiconductors
- 13.2. Market Analysis, Insights and Forecast - by Devices
- 13.2.1. Transistors
- 13.2.2. Diodes
- 13.2.3. Rectifiers
- 13.2.4. Power ICs
- 13.3. Market Analysis, Insights and Forecast - by End-user Industry
- 13.3.1. Automotive
- 13.3.2. Consumer Electronics
- 13.3.3. Aerospace and Defense
- 13.3.4. Medical
- 13.3.5. Information Communication and Technology
- 13.3.6. Other End-user Industries
- 13.1. Market Analysis, Insights and Forecast - by Type
- 14. Competitive Analysis
- 14.1. Global Market Share Analysis 2025
- 14.2. Company Profiles
- 14.2.1 Efficient Power Conversion Corporation
- 14.2.1.1. Overview
- 14.2.1.2. Products
- 14.2.1.3. SWOT Analysis
- 14.2.1.4. Recent Developments
- 14.2.1.5. Financials (Based on Availability)
- 14.2.2 Infineon Technologies AG
- 14.2.2.1. Overview
- 14.2.2.2. Products
- 14.2.2.3. SWOT Analysis
- 14.2.2.4. Recent Developments
- 14.2.2.5. Financials (Based on Availability)
- 14.2.3 Microchip Technology Inc
- 14.2.3.1. Overview
- 14.2.3.2. Products
- 14.2.3.3. SWOT Analysis
- 14.2.3.4. Recent Developments
- 14.2.3.5. Financials (Based on Availability)
- 14.2.4 GaN Systems
- 14.2.4.1. Overview
- 14.2.4.2. Products
- 14.2.4.3. SWOT Analysis
- 14.2.4.4. Recent Developments
- 14.2.4.5. Financials (Based on Availability)
- 14.2.5 NexGen Power Systems
- 14.2.5.1. Overview
- 14.2.5.2. Products
- 14.2.5.3. SWOT Analysis
- 14.2.5.4. Recent Developments
- 14.2.5.5. Financials (Based on Availability)
- 14.2.6 NXP Semiconductors
- 14.2.6.1. Overview
- 14.2.6.2. Products
- 14.2.6.3. SWOT Analysis
- 14.2.6.4. Recent Developments
- 14.2.6.5. Financials (Based on Availability)
- 14.2.7 Wolfspeed Inc
- 14.2.7.1. Overview
- 14.2.7.2. Products
- 14.2.7.3. SWOT Analysis
- 14.2.7.4. Recent Developments
- 14.2.7.5. Financials (Based on Availability)
- 14.2.8 Toshiba Electronic Devices & Storage Corporation
- 14.2.8.1. Overview
- 14.2.8.2. Products
- 14.2.8.3. SWOT Analysis
- 14.2.8.4. Recent Developments
- 14.2.8.5. Financials (Based on Availability)
- 14.2.9 Soitec
- 14.2.9.1. Overview
- 14.2.9.2. Products
- 14.2.9.3. SWOT Analysis
- 14.2.9.4. Recent Developments
- 14.2.9.5. Financials (Based on Availability)
- 14.2.10 Qorvo Inc
- 14.2.10.1. Overview
- 14.2.10.2. Products
- 14.2.10.3. SWOT Analysis
- 14.2.10.4. Recent Developments
- 14.2.10.5. Financials (Based on Availability)
- 14.2.11 Texas Instruments Incorporated
- 14.2.11.1. Overview
- 14.2.11.2. Products
- 14.2.11.3. SWOT Analysis
- 14.2.11.4. Recent Developments
- 14.2.11.5. Financials (Based on Availability)
- 14.2.12 NTT Advanced Technology Corporation*List Not Exhaustive
- 14.2.12.1. Overview
- 14.2.12.2. Products
- 14.2.12.3. SWOT Analysis
- 14.2.12.4. Recent Developments
- 14.2.12.5. Financials (Based on Availability)
- 14.2.1 Efficient Power Conversion Corporation
List of Figures
- Figure 1: Global GaN Industry Revenue Breakdown (Million, %) by Region 2025 & 2033
- Figure 2: United States GaN Industry Revenue (Million), by Type 2025 & 2033
- Figure 3: United States GaN Industry Revenue Share (%), by Type 2025 & 2033
- Figure 4: United States GaN Industry Revenue (Million), by Devices 2025 & 2033
- Figure 5: United States GaN Industry Revenue Share (%), by Devices 2025 & 2033
- Figure 6: United States GaN Industry Revenue (Million), by End-user Industry 2025 & 2033
- Figure 7: United States GaN Industry Revenue Share (%), by End-user Industry 2025 & 2033
- Figure 8: United States GaN Industry Revenue (Million), by Country 2025 & 2033
- Figure 9: United States GaN Industry Revenue Share (%), by Country 2025 & 2033
- Figure 10: Europe GaN Industry Revenue (Million), by Type 2025 & 2033
- Figure 11: Europe GaN Industry Revenue Share (%), by Type 2025 & 2033
- Figure 12: Europe GaN Industry Revenue (Million), by Devices 2025 & 2033
- Figure 13: Europe GaN Industry Revenue Share (%), by Devices 2025 & 2033
- Figure 14: Europe GaN Industry Revenue (Million), by End-user Industry 2025 & 2033
- Figure 15: Europe GaN Industry Revenue Share (%), by End-user Industry 2025 & 2033
- Figure 16: Europe GaN Industry Revenue (Million), by Country 2025 & 2033
- Figure 17: Europe GaN Industry Revenue Share (%), by Country 2025 & 2033
- Figure 18: Japan GaN Industry Revenue (Million), by Type 2025 & 2033
- Figure 19: Japan GaN Industry Revenue Share (%), by Type 2025 & 2033
- Figure 20: Japan GaN Industry Revenue (Million), by Devices 2025 & 2033
- Figure 21: Japan GaN Industry Revenue Share (%), by Devices 2025 & 2033
- Figure 22: Japan GaN Industry Revenue (Million), by End-user Industry 2025 & 2033
- Figure 23: Japan GaN Industry Revenue Share (%), by End-user Industry 2025 & 2033
- Figure 24: Japan GaN Industry Revenue (Million), by Country 2025 & 2033
- Figure 25: Japan GaN Industry Revenue Share (%), by Country 2025 & 2033
- Figure 26: China GaN Industry Revenue (Million), by Type 2025 & 2033
- Figure 27: China GaN Industry Revenue Share (%), by Type 2025 & 2033
- Figure 28: China GaN Industry Revenue (Million), by Devices 2025 & 2033
- Figure 29: China GaN Industry Revenue Share (%), by Devices 2025 & 2033
- Figure 30: China GaN Industry Revenue (Million), by End-user Industry 2025 & 2033
- Figure 31: China GaN Industry Revenue Share (%), by End-user Industry 2025 & 2033
- Figure 32: China GaN Industry Revenue (Million), by Country 2025 & 2033
- Figure 33: China GaN Industry Revenue Share (%), by Country 2025 & 2033
- Figure 34: Korea GaN Industry Revenue (Million), by Type 2025 & 2033
- Figure 35: Korea GaN Industry Revenue Share (%), by Type 2025 & 2033
- Figure 36: Korea GaN Industry Revenue (Million), by Devices 2025 & 2033
- Figure 37: Korea GaN Industry Revenue Share (%), by Devices 2025 & 2033
- Figure 38: Korea GaN Industry Revenue (Million), by End-user Industry 2025 & 2033
- Figure 39: Korea GaN Industry Revenue Share (%), by End-user Industry 2025 & 2033
- Figure 40: Korea GaN Industry Revenue (Million), by Country 2025 & 2033
- Figure 41: Korea GaN Industry Revenue Share (%), by Country 2025 & 2033
- Figure 42: Taiwan GaN Industry Revenue (Million), by Type 2025 & 2033
- Figure 43: Taiwan GaN Industry Revenue Share (%), by Type 2025 & 2033
- Figure 44: Taiwan GaN Industry Revenue (Million), by Devices 2025 & 2033
- Figure 45: Taiwan GaN Industry Revenue Share (%), by Devices 2025 & 2033
- Figure 46: Taiwan GaN Industry Revenue (Million), by End-user Industry 2025 & 2033
- Figure 47: Taiwan GaN Industry Revenue Share (%), by End-user Industry 2025 & 2033
- Figure 48: Taiwan GaN Industry Revenue (Million), by Country 2025 & 2033
- Figure 49: Taiwan GaN Industry Revenue Share (%), by Country 2025 & 2033
- Figure 50: Latin America GaN Industry Revenue (Million), by Type 2025 & 2033
- Figure 51: Latin America GaN Industry Revenue Share (%), by Type 2025 & 2033
- Figure 52: Latin America GaN Industry Revenue (Million), by Devices 2025 & 2033
- Figure 53: Latin America GaN Industry Revenue Share (%), by Devices 2025 & 2033
- Figure 54: Latin America GaN Industry Revenue (Million), by End-user Industry 2025 & 2033
- Figure 55: Latin America GaN Industry Revenue Share (%), by End-user Industry 2025 & 2033
- Figure 56: Latin America GaN Industry Revenue (Million), by Country 2025 & 2033
- Figure 57: Latin America GaN Industry Revenue Share (%), by Country 2025 & 2033
- Figure 58: Middle East and Africa GaN Industry Revenue (Million), by Type 2025 & 2033
- Figure 59: Middle East and Africa GaN Industry Revenue Share (%), by Type 2025 & 2033
- Figure 60: Middle East and Africa GaN Industry Revenue (Million), by Devices 2025 & 2033
- Figure 61: Middle East and Africa GaN Industry Revenue Share (%), by Devices 2025 & 2033
- Figure 62: Middle East and Africa GaN Industry Revenue (Million), by End-user Industry 2025 & 2033
- Figure 63: Middle East and Africa GaN Industry Revenue Share (%), by End-user Industry 2025 & 2033
- Figure 64: Middle East and Africa GaN Industry Revenue (Million), by Country 2025 & 2033
- Figure 65: Middle East and Africa GaN Industry Revenue Share (%), by Country 2025 & 2033
List of Tables
- Table 1: Global GaN Industry Revenue Million Forecast, by Type 2020 & 2033
- Table 2: Global GaN Industry Revenue Million Forecast, by Devices 2020 & 2033
- Table 3: Global GaN Industry Revenue Million Forecast, by End-user Industry 2020 & 2033
- Table 4: Global GaN Industry Revenue Million Forecast, by Region 2020 & 2033
- Table 5: Global GaN Industry Revenue Million Forecast, by Type 2020 & 2033
- Table 6: Global GaN Industry Revenue Million Forecast, by Devices 2020 & 2033
- Table 7: Global GaN Industry Revenue Million Forecast, by End-user Industry 2020 & 2033
- Table 8: Global GaN Industry Revenue Million Forecast, by Country 2020 & 2033
- Table 9: Global GaN Industry Revenue Million Forecast, by Type 2020 & 2033
- Table 10: Global GaN Industry Revenue Million Forecast, by Devices 2020 & 2033
- Table 11: Global GaN Industry Revenue Million Forecast, by End-user Industry 2020 & 2033
- Table 12: Global GaN Industry Revenue Million Forecast, by Country 2020 & 2033
- Table 13: Global GaN Industry Revenue Million Forecast, by Type 2020 & 2033
- Table 14: Global GaN Industry Revenue Million Forecast, by Devices 2020 & 2033
- Table 15: Global GaN Industry Revenue Million Forecast, by End-user Industry 2020 & 2033
- Table 16: Global GaN Industry Revenue Million Forecast, by Country 2020 & 2033
- Table 17: Global GaN Industry Revenue Million Forecast, by Type 2020 & 2033
- Table 18: Global GaN Industry Revenue Million Forecast, by Devices 2020 & 2033
- Table 19: Global GaN Industry Revenue Million Forecast, by End-user Industry 2020 & 2033
- Table 20: Global GaN Industry Revenue Million Forecast, by Country 2020 & 2033
- Table 21: Global GaN Industry Revenue Million Forecast, by Type 2020 & 2033
- Table 22: Global GaN Industry Revenue Million Forecast, by Devices 2020 & 2033
- Table 23: Global GaN Industry Revenue Million Forecast, by End-user Industry 2020 & 2033
- Table 24: Global GaN Industry Revenue Million Forecast, by Country 2020 & 2033
- Table 25: Global GaN Industry Revenue Million Forecast, by Type 2020 & 2033
- Table 26: Global GaN Industry Revenue Million Forecast, by Devices 2020 & 2033
- Table 27: Global GaN Industry Revenue Million Forecast, by End-user Industry 2020 & 2033
- Table 28: Global GaN Industry Revenue Million Forecast, by Country 2020 & 2033
- Table 29: Global GaN Industry Revenue Million Forecast, by Type 2020 & 2033
- Table 30: Global GaN Industry Revenue Million Forecast, by Devices 2020 & 2033
- Table 31: Global GaN Industry Revenue Million Forecast, by End-user Industry 2020 & 2033
- Table 32: Global GaN Industry Revenue Million Forecast, by Country 2020 & 2033
- Table 33: Global GaN Industry Revenue Million Forecast, by Type 2020 & 2033
- Table 34: Global GaN Industry Revenue Million Forecast, by Devices 2020 & 2033
- Table 35: Global GaN Industry Revenue Million Forecast, by End-user Industry 2020 & 2033
- Table 36: Global GaN Industry Revenue Million Forecast, by Country 2020 & 2033
Frequently Asked Questions
1. What is the projected Compound Annual Growth Rate (CAGR) of the GaN Industry?
The projected CAGR is approximately 6.06%.
2. Which companies are prominent players in the GaN Industry?
Key companies in the market include Efficient Power Conversion Corporation, Infineon Technologies AG, Microchip Technology Inc, GaN Systems, NexGen Power Systems, NXP Semiconductors, Wolfspeed Inc, Toshiba Electronic Devices & Storage Corporation, Soitec, Qorvo Inc, Texas Instruments Incorporated, NTT Advanced Technology Corporation*List Not Exhaustive.
3. What are the main segments of the GaN Industry?
The market segments include Type, Devices, End-user Industry.
4. Can you provide details about the market size?
The market size is estimated to be USD 21.18 Million as of 2022.
5. What are some drivers contributing to market growth?
Strong Demand from Telecom Infrastructure Segment Driven by Advancements in 5G Implementation; Favorable Attributes Such As High-performance and Small Form Factor to Drive Adoption in the Military Segment.
6. What are the notable trends driving market growth?
Consumer Electronics to Hold Significant Market Share.
7. Are there any restraints impacting market growth?
; Declining Volume of Traditional Mails; High Adoption Costs.
8. Can you provide examples of recent developments in the market?
Jan 2024: Silvaco Group, Inc., a leading provider of TCAD, EDA software, and design IP, partnered with GaN Valley to drive advancements in efficient gallium nitride (GaN) power device design. By leveraging its Victory TCAD platform, Silvaco aims to empower customers to innovate and optimize performance in GaN-based semiconductor power devices. The Victory TCAD platform offers a comprehensive simulation environment, incorporating diverse numerical methods, physical models, SPICE model generation, and a user-friendly graphical interface, tailored specifically for the latest generation of GaN-based power devices.
9. What pricing options are available for accessing the report?
Pricing options include single-user, multi-user, and enterprise licenses priced at USD 4750, USD 5250, and USD 8750 respectively.
10. Is the market size provided in terms of value or volume?
The market size is provided in terms of value, measured in Million.
11. Are there any specific market keywords associated with the report?
Yes, the market keyword associated with the report is "GaN Industry," which aids in identifying and referencing the specific market segment covered.
12. How do I determine which pricing option suits my needs best?
The pricing options vary based on user requirements and access needs. Individual users may opt for single-user licenses, while businesses requiring broader access may choose multi-user or enterprise licenses for cost-effective access to the report.
13. Are there any additional resources or data provided in the GaN Industry report?
While the report offers comprehensive insights, it's advisable to review the specific contents or supplementary materials provided to ascertain if additional resources or data are available.
14. How can I stay updated on further developments or reports in the GaN Industry?
To stay informed about further developments, trends, and reports in the GaN Industry, consider subscribing to industry newsletters, following relevant companies and organizations, or regularly checking reputable industry news sources and publications.
Methodology
Step 1 - Identification of Relevant Samples Size from Population Database


Step 2 - Approaches for Defining Global Market Size (Value, Volume* & Price*)

Note*: In applicable scenarios
Step 3 - Data Sources
Primary Research
- Web Analytics
- Survey Reports
- Research Institute
- Latest Research Reports
- Opinion Leaders
Secondary Research
- Annual Reports
- White Paper
- Latest Press Release
- Industry Association
- Paid Database
- Investor Presentations

Step 4 - Data Triangulation
Involves using different sources of information in order to increase the validity of a study
These sources are likely to be stakeholders in a program - participants, other researchers, program staff, other community members, and so on.
Then we put all data in single framework & apply various statistical tools to find out the dynamic on the market.
During the analysis stage, feedback from the stakeholder groups would be compared to determine areas of agreement as well as areas of divergence