

Key Insights
The Functional Near-infrared Optical Brain Imaging (fNIRI) market is experiencing robust growth, driven by the increasing prevalence of neurological disorders like Parkinson's disease, epilepsy, and dementia, coupled with the rising demand for non-invasive brain imaging techniques. The market's Compound Annual Growth Rate (CAGR) of 5.65% from 2019 to 2024 indicates a steady expansion, projected to continue through 2033. This growth is fueled by technological advancements leading to improved image resolution and portability of fNIRI devices, making them more accessible for various clinical settings, including hospitals and diagnostic centers. Furthermore, the increasing adoption of fNIRI in research settings to study brain activity during cognitive tasks is further bolstering market expansion. The market segmentation reveals a significant share held by Parkinson's disease applications, followed by epilepsy and dementia, reflecting the high prevalence and unmet needs in these areas. North America currently holds a dominant market share, attributable to advanced healthcare infrastructure and high adoption rates of innovative technologies. However, the Asia Pacific region is anticipated to demonstrate significant growth potential due to rising healthcare spending and increasing awareness of neurological disorders. While high initial investment costs and the need for skilled professionals can act as restraints, the overall market outlook for fNIRI remains positive, driven by continuous technological innovation and expanding applications.
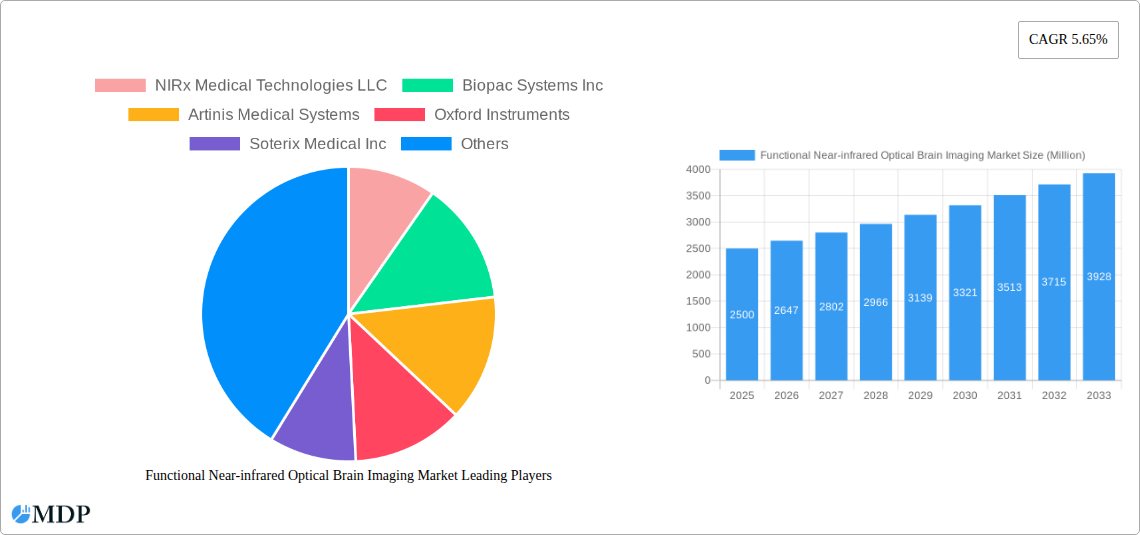
The competitive landscape is characterized by several key players, including NIRx Medical Technologies LLC, Biopac Systems Inc., and Artinis Medical Systems, who are actively engaged in developing advanced fNIRI systems and expanding their global reach. Strategic collaborations, mergers, and acquisitions are likely to shape the future competitive dynamics. The continued development of more sophisticated algorithms for data analysis and interpretation, coupled with the integration of fNIRI with other neuroimaging modalities, will further enhance the clinical utility of this technology and propel market growth in the coming years. The broader adoption of fNIRI across various research and clinical applications across different regions, especially in emerging markets, will be crucial for further market expansion and accessibility.
Functional Near-infrared Optical Brain Imaging Market Report: 2019-2033
This comprehensive report provides a detailed analysis of the Functional Near-infrared Optical Brain Imaging (fNIRS) market, offering invaluable insights for industry stakeholders, investors, and researchers. Covering the period 2019-2033, with a focus on 2025, this report unveils market dynamics, trends, leading players, and future growth potential. The market is segmented by application type (Parkinson's Disease, Epilepsy, Dementia, Traumatic Brain Injury, Sleep Disorders, Other) and end-user (Hospitals, Diagnostic Centers). The report also analyzes key industry developments, including recent product launches and technological advancements. Download now to gain a competitive edge.
Functional Near-infrared Optical Brain Imaging Market Market Dynamics & Concentration
The global functional near-infrared optical brain imaging market is experiencing significant growth, driven by increasing prevalence of neurological disorders, technological advancements, and rising demand for non-invasive brain imaging techniques. Market concentration is moderate, with several key players competing for market share. The market is estimated to be valued at xx Million in 2025, with a projected CAGR of xx% during the forecast period (2025-2033).
Market Concentration: The market shows a moderately consolidated structure, with the top five players holding approximately xx% of the market share in 2025. However, the presence of several smaller players indicates a competitive landscape.
Innovation Drivers: Continuous advancements in fNIRS technology, such as improved spatial resolution, portability, and data processing capabilities are driving market growth. The development of wearable and more user-friendly devices is a key factor.
Regulatory Frameworks: Regulatory approvals and guidelines for fNIRS devices vary across different regions, impacting market penetration and adoption rates. Streamlining regulatory processes could further accelerate market growth.
Product Substitutes: Other neuroimaging techniques like EEG and fMRI compete with fNIRS. However, fNIRS offers advantages in terms of portability, cost-effectiveness, and ease of use, making it a preferred choice in certain applications.
End-User Trends: Hospitals and diagnostic centers are the primary end-users, with a growing adoption of fNIRS in research settings and clinics specializing in neurology and psychiatry.
M&A Activities: The number of mergers and acquisitions in the fNIRS market has been moderate in recent years, with approximately xx deals recorded between 2019 and 2024. Strategic partnerships and collaborations are also prevalent.
Functional Near-infrared Optical Brain Imaging Market Industry Trends & Analysis
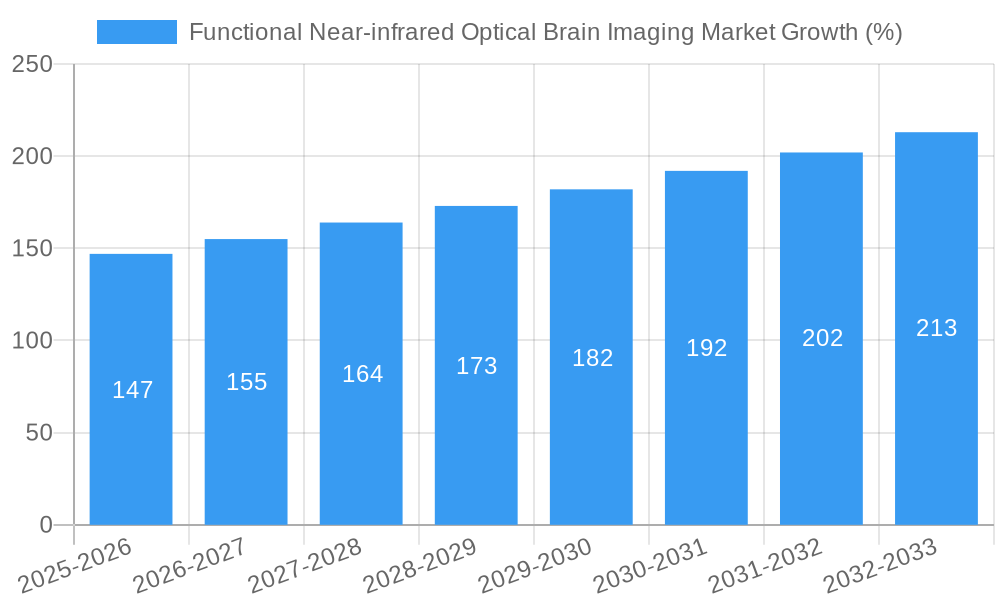
The fNIRS market is witnessing robust growth fueled by several factors. The increasing prevalence of neurological and psychiatric disorders globally is a primary driver, creating a significant demand for accurate and non-invasive diagnostic tools. Technological advancements, particularly in the development of portable and wearable fNIRS devices, are significantly impacting market penetration. The rising adoption of fNIRS in research and clinical settings further contributes to market expansion. Furthermore, favorable reimbursement policies in some regions are accelerating market growth. The market is expected to witness a CAGR of xx% during the forecast period, exceeding xx Million by 2033. Consumer preference for non-invasive and cost-effective diagnostic solutions is also playing a significant role. The competitive landscape is characterized by both established players and emerging companies, resulting in increased innovation and market diversification. Market penetration in developing economies is expected to increase with growing healthcare infrastructure and rising awareness about neurological disorders.
Leading Markets & Segments in Functional Near-infrared Optical Brain Imaging Market
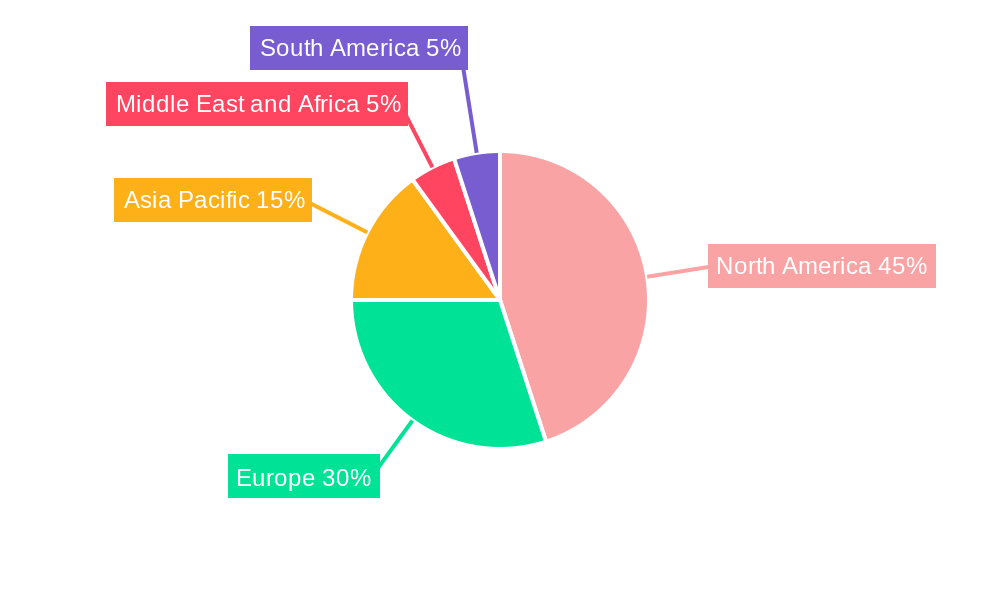
The North American region currently holds the largest market share due to advanced healthcare infrastructure, high adoption rates of advanced technologies, and significant research funding in neurology. Within application types, the diagnosis and management of Traumatic Brain Injury and Dementia are currently leading segments, although Parkinson's disease and epilepsy show significant growth potential.
Key Drivers in North America:
- Robust healthcare infrastructure.
- High levels of research and development funding.
- Favorable regulatory environment.
- Early adoption of advanced medical technologies.
Key Drivers in Europe:
- Increasing prevalence of neurological disorders.
- Growing investment in healthcare technologies.
- Government initiatives promoting healthcare innovation.
Dominance Analysis: The North American market's dominance is largely due to its well-established healthcare system, high disposable income, and strong presence of key players in the fNIRS industry. However, the European and Asian markets are expected to witness significant growth in the coming years due to increasing healthcare expenditure and rising awareness of neurological disorders. The application type segment focusing on Traumatic Brain Injury is expected to maintain its leading position due to the high incidence and increasing demand for accurate diagnosis and monitoring. Hospitals and Diagnostic centers are driving significant demand in the end-user segment due to their access to advanced equipment and trained professionals.
Functional Near-infrared Optical Brain Imaging Market Product Developments
Recent advancements in fNIRS technology have led to the development of smaller, more portable, and user-friendly devices. These devices often integrate advanced data processing capabilities and improved spatial resolution. This makes fNIRS more accessible and suitable for a broader range of applications, enhancing its market fit and competitive advantage against traditional neuroimaging techniques. The development of wearable fNIRS systems is a key area of innovation, offering the potential for continuous and remote monitoring of brain activity.
Key Drivers of Functional Near-infrared Optical Brain Imaging Market Growth
Several factors are driving the growth of the fNIRS market. Firstly, the increasing prevalence of neurological disorders necessitates more effective and non-invasive diagnostic tools. Secondly, technological advancements, such as the development of wearable and portable devices, are improving the accessibility and applicability of fNIRS. Lastly, supportive regulatory frameworks and increasing healthcare expenditure are bolstering market growth.
Challenges in the Functional Near-infrared Optical Brain Imaging Market Market
Despite significant growth potential, the fNIRS market faces challenges. High costs associated with advanced fNIRS systems can limit accessibility, particularly in resource-constrained settings. The complexity of data analysis and interpretation requires specialized training, potentially hindering widespread adoption. Furthermore, competition from other neuroimaging modalities creates a competitive pressure in the market. These factors are estimated to limit market growth by xx% in 2025 compared to the potential in a more accessible environment.
Emerging Opportunities in Functional Near-infrared Optical Brain Imaging Market
Emerging opportunities lie in the development of advanced fNIRS algorithms for improved data analysis and interpretation. Strategic partnerships between fNIRS technology providers and healthcare providers can broaden market access. Expansion into emerging markets with growing healthcare infrastructure represents a significant long-term growth opportunity. Furthermore, exploring applications beyond clinical diagnosis, such as in brain-computer interfaces and neurofeedback, could unlock substantial new markets.
Leading Players in the Functional Near-infrared Optical Brain Imaging Market Sector
- NIRx Medical Technologies LLC
- Biopac Systems Inc
- Artinis Medical Systems
- Oxford Instruments
- Soterix Medical Inc
- Gowerlabs Ltd
- Fujifilm Holdings Corporation (Hitachi Ltd)
- PerkinElmer Inc
- Shimadzu Corporation
Key Milestones in Functional Near-infrared Optical Brain Imaging Market Industry
- March 2022: Kernel launched the Kernel Flow, a wearable TD-fNIRS headset, significantly improving accessibility and resolution of brain measurements.
- March 2022: MYndspan launched a brain imaging service utilizing brain connectivity measurements, expanding the application of fNIRS in brain health assessment. These launches showcase significant advancements in fNIRS technology and broaden its applications.
Strategic Outlook for Functional Near-infrared Optical Brain Imaging Market Market
The fNIRS market holds substantial growth potential driven by technological advancements, the increasing prevalence of neurological disorders, and the demand for non-invasive brain imaging techniques. Strategic partnerships, expansion into emerging markets, and the development of innovative applications will be crucial for capturing market share and driving long-term growth. Focusing on improving data analysis capabilities and creating more user-friendly devices will further enhance market penetration and adoption.
Functional Near-infrared Optical Brain Imaging Market Segmentation
-
1. Application Type
- 1.1. Parkinson's Disease
- 1.2. Epilepsy
- 1.3. Dementia
- 1.4. Traumatic Brain Injury
- 1.5. Sleep Disorders
- 1.6. Other Application Types
-
2. End-User
- 2.1. Hospitals
- 2.2. Diagnostic Centers
Functional Near-infrared Optical Brain Imaging Market Segmentation By Geography
-
1. North America
- 1.1. United States
- 1.2. Canada
- 1.3. Mexico
-
2. Europe
- 2.1. Germany
- 2.2. United Kingdom
- 2.3. France
- 2.4. Italy
- 2.5. Spain
- 2.6. Rest of Europe
-
3. Asia Pacific
- 3.1. China
- 3.2. Japan
- 3.3. India
- 3.4. Australia
- 3.5. South Korea
- 3.6. Rest of Asia Pacific
-
4. Middle East and Africa
- 4.1. GCC
- 4.2. South Africa
- 4.3. Rest of Middle East and Africa
-
5. South America
- 5.1. Brazil
- 5.2. Argentina
- 5.3. Rest of South America
Functional Near-infrared Optical Brain Imaging Market REPORT HIGHLIGHTS
| Aspects | Details |
|---|---|
| Study Period | 2019-2033 |
| Base Year | 2024 |
| Estimated Year | 2025 |
| Forecast Period | 2025-2033 |
| Historical Period | 2019-2024 |
| Growth Rate | CAGR of 5.65% from 2019-2033 |
| Segmentation |
|
Table of Contents
- 1. Introduction
- 1.1. Research Scope
- 1.2. Market Segmentation
- 1.3. Research Methodology
- 1.4. Definitions and Assumptions
- 2. Executive Summary
- 2.1. Introduction
- 3. Market Dynamics
- 3.1. Introduction
- 3.2. Market Drivers
- 3.2.1. Rising Prevalence of Neurological Disorders; Emerging Trends in Products
- 3.3. Market Restrains
- 3.3.1. Lack of Skilled Professionals
- 3.4. Market Trends
- 3.4.1. Traumatic Brain Injury Segment Expects to Register a Strong Growth in the Forecast Period
- 4. Market Factor Analysis
- 4.1. Porters Five Forces
- 4.2. Supply/Value Chain
- 4.3. PESTEL analysis
- 4.4. Market Entropy
- 4.5. Patent/Trademark Analysis
- 5. Global Functional Near-infrared Optical Brain Imaging Market Analysis, Insights and Forecast, 2019-2031
- 5.1. Market Analysis, Insights and Forecast - by Application Type
- 5.1.1. Parkinson's Disease
- 5.1.2. Epilepsy
- 5.1.3. Dementia
- 5.1.4. Traumatic Brain Injury
- 5.1.5. Sleep Disorders
- 5.1.6. Other Application Types
- 5.2. Market Analysis, Insights and Forecast - by End-User
- 5.2.1. Hospitals
- 5.2.2. Diagnostic Centers
- 5.3. Market Analysis, Insights and Forecast - by Region
- 5.3.1. North America
- 5.3.2. Europe
- 5.3.3. Asia Pacific
- 5.3.4. Middle East and Africa
- 5.3.5. South America
- 5.1. Market Analysis, Insights and Forecast - by Application Type
- 6. North America Functional Near-infrared Optical Brain Imaging Market Analysis, Insights and Forecast, 2019-2031
- 6.1. Market Analysis, Insights and Forecast - by Application Type
- 6.1.1. Parkinson's Disease
- 6.1.2. Epilepsy
- 6.1.3. Dementia
- 6.1.4. Traumatic Brain Injury
- 6.1.5. Sleep Disorders
- 6.1.6. Other Application Types
- 6.2. Market Analysis, Insights and Forecast - by End-User
- 6.2.1. Hospitals
- 6.2.2. Diagnostic Centers
- 6.1. Market Analysis, Insights and Forecast - by Application Type
- 7. Europe Functional Near-infrared Optical Brain Imaging Market Analysis, Insights and Forecast, 2019-2031
- 7.1. Market Analysis, Insights and Forecast - by Application Type
- 7.1.1. Parkinson's Disease
- 7.1.2. Epilepsy
- 7.1.3. Dementia
- 7.1.4. Traumatic Brain Injury
- 7.1.5. Sleep Disorders
- 7.1.6. Other Application Types
- 7.2. Market Analysis, Insights and Forecast - by End-User
- 7.2.1. Hospitals
- 7.2.2. Diagnostic Centers
- 7.1. Market Analysis, Insights and Forecast - by Application Type
- 8. Asia Pacific Functional Near-infrared Optical Brain Imaging Market Analysis, Insights and Forecast, 2019-2031
- 8.1. Market Analysis, Insights and Forecast - by Application Type
- 8.1.1. Parkinson's Disease
- 8.1.2. Epilepsy
- 8.1.3. Dementia
- 8.1.4. Traumatic Brain Injury
- 8.1.5. Sleep Disorders
- 8.1.6. Other Application Types
- 8.2. Market Analysis, Insights and Forecast - by End-User
- 8.2.1. Hospitals
- 8.2.2. Diagnostic Centers
- 8.1. Market Analysis, Insights and Forecast - by Application Type
- 9. Middle East and Africa Functional Near-infrared Optical Brain Imaging Market Analysis, Insights and Forecast, 2019-2031
- 9.1. Market Analysis, Insights and Forecast - by Application Type
- 9.1.1. Parkinson's Disease
- 9.1.2. Epilepsy
- 9.1.3. Dementia
- 9.1.4. Traumatic Brain Injury
- 9.1.5. Sleep Disorders
- 9.1.6. Other Application Types
- 9.2. Market Analysis, Insights and Forecast - by End-User
- 9.2.1. Hospitals
- 9.2.2. Diagnostic Centers
- 9.1. Market Analysis, Insights and Forecast - by Application Type
- 10. South America Functional Near-infrared Optical Brain Imaging Market Analysis, Insights and Forecast, 2019-2031
- 10.1. Market Analysis, Insights and Forecast - by Application Type
- 10.1.1. Parkinson's Disease
- 10.1.2. Epilepsy
- 10.1.3. Dementia
- 10.1.4. Traumatic Brain Injury
- 10.1.5. Sleep Disorders
- 10.1.6. Other Application Types
- 10.2. Market Analysis, Insights and Forecast - by End-User
- 10.2.1. Hospitals
- 10.2.2. Diagnostic Centers
- 10.1. Market Analysis, Insights and Forecast - by Application Type
- 11. North America Functional Near-infrared Optical Brain Imaging Market Analysis, Insights and Forecast, 2019-2031
- 11.1. Market Analysis, Insights and Forecast - By Country/Sub-region
- 11.1.1. undefined
- 12. Europe Functional Near-infrared Optical Brain Imaging Market Analysis, Insights and Forecast, 2019-2031
- 12.1. Market Analysis, Insights and Forecast - By Country/Sub-region
- 12.1.1. undefined
- 13. Asia Pacific Functional Near-infrared Optical Brain Imaging Market Analysis, Insights and Forecast, 2019-2031
- 13.1. Market Analysis, Insights and Forecast - By Country/Sub-region
- 13.1.1. undefined
- 14. Middle East and Africa Functional Near-infrared Optical Brain Imaging Market Analysis, Insights and Forecast, 2019-2031
- 14.1. Market Analysis, Insights and Forecast - By Country/Sub-region
- 14.1.1. undefined
- 15. South America Functional Near-infrared Optical Brain Imaging Market Analysis, Insights and Forecast, 2019-2031
- 15.1. Market Analysis, Insights and Forecast - By Country/Sub-region
- 15.1.1. undefined
- 16. Competitive Analysis
- 16.1. Global Market Share Analysis 2024
- 16.2. Company Profiles
- 16.2.1 NIRx Medical Technologies LLC
- 16.2.1.1. Overview
- 16.2.1.2. Products
- 16.2.1.3. SWOT Analysis
- 16.2.1.4. Recent Developments
- 16.2.1.5. Financials (Based on Availability)
- 16.2.2 Biopac Systems Inc
- 16.2.2.1. Overview
- 16.2.2.2. Products
- 16.2.2.3. SWOT Analysis
- 16.2.2.4. Recent Developments
- 16.2.2.5. Financials (Based on Availability)
- 16.2.3 Artinis Medical Systems
- 16.2.3.1. Overview
- 16.2.3.2. Products
- 16.2.3.3. SWOT Analysis
- 16.2.3.4. Recent Developments
- 16.2.3.5. Financials (Based on Availability)
- 16.2.4 Oxford Instruments
- 16.2.4.1. Overview
- 16.2.4.2. Products
- 16.2.4.3. SWOT Analysis
- 16.2.4.4. Recent Developments
- 16.2.4.5. Financials (Based on Availability)
- 16.2.5 Soterix Medical Inc
- 16.2.5.1. Overview
- 16.2.5.2. Products
- 16.2.5.3. SWOT Analysis
- 16.2.5.4. Recent Developments
- 16.2.5.5. Financials (Based on Availability)
- 16.2.6 Gowerlabs Ltd
- 16.2.6.1. Overview
- 16.2.6.2. Products
- 16.2.6.3. SWOT Analysis
- 16.2.6.4. Recent Developments
- 16.2.6.5. Financials (Based on Availability)
- 16.2.7 Fujifilm Holdings Corporation (Hitachi Ltd )
- 16.2.7.1. Overview
- 16.2.7.2. Products
- 16.2.7.3. SWOT Analysis
- 16.2.7.4. Recent Developments
- 16.2.7.5. Financials (Based on Availability)
- 16.2.8 PerkinElmer Inc
- 16.2.8.1. Overview
- 16.2.8.2. Products
- 16.2.8.3. SWOT Analysis
- 16.2.8.4. Recent Developments
- 16.2.8.5. Financials (Based on Availability)
- 16.2.9 Shimadzu Corporation
- 16.2.9.1. Overview
- 16.2.9.2. Products
- 16.2.9.3. SWOT Analysis
- 16.2.9.4. Recent Developments
- 16.2.9.5. Financials (Based on Availability)
- 16.2.1 NIRx Medical Technologies LLC
List of Figures
- Figure 1: Global Functional Near-infrared Optical Brain Imaging Market Revenue Breakdown (Million, %) by Region 2024 & 2032
- Figure 2: Global Functional Near-infrared Optical Brain Imaging Market Volume Breakdown (K Unit, %) by Region 2024 & 2032
- Figure 3: North America Functional Near-infrared Optical Brain Imaging Market Revenue (Million), by Country 2024 & 2032
- Figure 4: North America Functional Near-infrared Optical Brain Imaging Market Volume (K Unit), by Country 2024 & 2032
- Figure 5: North America Functional Near-infrared Optical Brain Imaging Market Revenue Share (%), by Country 2024 & 2032
- Figure 6: North America Functional Near-infrared Optical Brain Imaging Market Volume Share (%), by Country 2024 & 2032
- Figure 7: Europe Functional Near-infrared Optical Brain Imaging Market Revenue (Million), by Country 2024 & 2032
- Figure 8: Europe Functional Near-infrared Optical Brain Imaging Market Volume (K Unit), by Country 2024 & 2032
- Figure 9: Europe Functional Near-infrared Optical Brain Imaging Market Revenue Share (%), by Country 2024 & 2032
- Figure 10: Europe Functional Near-infrared Optical Brain Imaging Market Volume Share (%), by Country 2024 & 2032
- Figure 11: Asia Pacific Functional Near-infrared Optical Brain Imaging Market Revenue (Million), by Country 2024 & 2032
- Figure 12: Asia Pacific Functional Near-infrared Optical Brain Imaging Market Volume (K Unit), by Country 2024 & 2032
- Figure 13: Asia Pacific Functional Near-infrared Optical Brain Imaging Market Revenue Share (%), by Country 2024 & 2032
- Figure 14: Asia Pacific Functional Near-infrared Optical Brain Imaging Market Volume Share (%), by Country 2024 & 2032
- Figure 15: Middle East and Africa Functional Near-infrared Optical Brain Imaging Market Revenue (Million), by Country 2024 & 2032
- Figure 16: Middle East and Africa Functional Near-infrared Optical Brain Imaging Market Volume (K Unit), by Country 2024 & 2032
- Figure 17: Middle East and Africa Functional Near-infrared Optical Brain Imaging Market Revenue Share (%), by Country 2024 & 2032
- Figure 18: Middle East and Africa Functional Near-infrared Optical Brain Imaging Market Volume Share (%), by Country 2024 & 2032
- Figure 19: South America Functional Near-infrared Optical Brain Imaging Market Revenue (Million), by Country 2024 & 2032
- Figure 20: South America Functional Near-infrared Optical Brain Imaging Market Volume (K Unit), by Country 2024 & 2032
- Figure 21: South America Functional Near-infrared Optical Brain Imaging Market Revenue Share (%), by Country 2024 & 2032
- Figure 22: South America Functional Near-infrared Optical Brain Imaging Market Volume Share (%), by Country 2024 & 2032
- Figure 23: North America Functional Near-infrared Optical Brain Imaging Market Revenue (Million), by Application Type 2024 & 2032
- Figure 24: North America Functional Near-infrared Optical Brain Imaging Market Volume (K Unit), by Application Type 2024 & 2032
- Figure 25: North America Functional Near-infrared Optical Brain Imaging Market Revenue Share (%), by Application Type 2024 & 2032
- Figure 26: North America Functional Near-infrared Optical Brain Imaging Market Volume Share (%), by Application Type 2024 & 2032
- Figure 27: North America Functional Near-infrared Optical Brain Imaging Market Revenue (Million), by End-User 2024 & 2032
- Figure 28: North America Functional Near-infrared Optical Brain Imaging Market Volume (K Unit), by End-User 2024 & 2032
- Figure 29: North America Functional Near-infrared Optical Brain Imaging Market Revenue Share (%), by End-User 2024 & 2032
- Figure 30: North America Functional Near-infrared Optical Brain Imaging Market Volume Share (%), by End-User 2024 & 2032
- Figure 31: North America Functional Near-infrared Optical Brain Imaging Market Revenue (Million), by Country 2024 & 2032
- Figure 32: North America Functional Near-infrared Optical Brain Imaging Market Volume (K Unit), by Country 2024 & 2032
- Figure 33: North America Functional Near-infrared Optical Brain Imaging Market Revenue Share (%), by Country 2024 & 2032
- Figure 34: North America Functional Near-infrared Optical Brain Imaging Market Volume Share (%), by Country 2024 & 2032
- Figure 35: Europe Functional Near-infrared Optical Brain Imaging Market Revenue (Million), by Application Type 2024 & 2032
- Figure 36: Europe Functional Near-infrared Optical Brain Imaging Market Volume (K Unit), by Application Type 2024 & 2032
- Figure 37: Europe Functional Near-infrared Optical Brain Imaging Market Revenue Share (%), by Application Type 2024 & 2032
- Figure 38: Europe Functional Near-infrared Optical Brain Imaging Market Volume Share (%), by Application Type 2024 & 2032
- Figure 39: Europe Functional Near-infrared Optical Brain Imaging Market Revenue (Million), by End-User 2024 & 2032
- Figure 40: Europe Functional Near-infrared Optical Brain Imaging Market Volume (K Unit), by End-User 2024 & 2032
- Figure 41: Europe Functional Near-infrared Optical Brain Imaging Market Revenue Share (%), by End-User 2024 & 2032
- Figure 42: Europe Functional Near-infrared Optical Brain Imaging Market Volume Share (%), by End-User 2024 & 2032
- Figure 43: Europe Functional Near-infrared Optical Brain Imaging Market Revenue (Million), by Country 2024 & 2032
- Figure 44: Europe Functional Near-infrared Optical Brain Imaging Market Volume (K Unit), by Country 2024 & 2032
- Figure 45: Europe Functional Near-infrared Optical Brain Imaging Market Revenue Share (%), by Country 2024 & 2032
- Figure 46: Europe Functional Near-infrared Optical Brain Imaging Market Volume Share (%), by Country 2024 & 2032
- Figure 47: Asia Pacific Functional Near-infrared Optical Brain Imaging Market Revenue (Million), by Application Type 2024 & 2032
- Figure 48: Asia Pacific Functional Near-infrared Optical Brain Imaging Market Volume (K Unit), by Application Type 2024 & 2032
- Figure 49: Asia Pacific Functional Near-infrared Optical Brain Imaging Market Revenue Share (%), by Application Type 2024 & 2032
- Figure 50: Asia Pacific Functional Near-infrared Optical Brain Imaging Market Volume Share (%), by Application Type 2024 & 2032
- Figure 51: Asia Pacific Functional Near-infrared Optical Brain Imaging Market Revenue (Million), by End-User 2024 & 2032
- Figure 52: Asia Pacific Functional Near-infrared Optical Brain Imaging Market Volume (K Unit), by End-User 2024 & 2032
- Figure 53: Asia Pacific Functional Near-infrared Optical Brain Imaging Market Revenue Share (%), by End-User 2024 & 2032
- Figure 54: Asia Pacific Functional Near-infrared Optical Brain Imaging Market Volume Share (%), by End-User 2024 & 2032
- Figure 55: Asia Pacific Functional Near-infrared Optical Brain Imaging Market Revenue (Million), by Country 2024 & 2032
- Figure 56: Asia Pacific Functional Near-infrared Optical Brain Imaging Market Volume (K Unit), by Country 2024 & 2032
- Figure 57: Asia Pacific Functional Near-infrared Optical Brain Imaging Market Revenue Share (%), by Country 2024 & 2032
- Figure 58: Asia Pacific Functional Near-infrared Optical Brain Imaging Market Volume Share (%), by Country 2024 & 2032
- Figure 59: Middle East and Africa Functional Near-infrared Optical Brain Imaging Market Revenue (Million), by Application Type 2024 & 2032
- Figure 60: Middle East and Africa Functional Near-infrared Optical Brain Imaging Market Volume (K Unit), by Application Type 2024 & 2032
- Figure 61: Middle East and Africa Functional Near-infrared Optical Brain Imaging Market Revenue Share (%), by Application Type 2024 & 2032
- Figure 62: Middle East and Africa Functional Near-infrared Optical Brain Imaging Market Volume Share (%), by Application Type 2024 & 2032
- Figure 63: Middle East and Africa Functional Near-infrared Optical Brain Imaging Market Revenue (Million), by End-User 2024 & 2032
- Figure 64: Middle East and Africa Functional Near-infrared Optical Brain Imaging Market Volume (K Unit), by End-User 2024 & 2032
- Figure 65: Middle East and Africa Functional Near-infrared Optical Brain Imaging Market Revenue Share (%), by End-User 2024 & 2032
- Figure 66: Middle East and Africa Functional Near-infrared Optical Brain Imaging Market Volume Share (%), by End-User 2024 & 2032
- Figure 67: Middle East and Africa Functional Near-infrared Optical Brain Imaging Market Revenue (Million), by Country 2024 & 2032
- Figure 68: Middle East and Africa Functional Near-infrared Optical Brain Imaging Market Volume (K Unit), by Country 2024 & 2032
- Figure 69: Middle East and Africa Functional Near-infrared Optical Brain Imaging Market Revenue Share (%), by Country 2024 & 2032
- Figure 70: Middle East and Africa Functional Near-infrared Optical Brain Imaging Market Volume Share (%), by Country 2024 & 2032
- Figure 71: South America Functional Near-infrared Optical Brain Imaging Market Revenue (Million), by Application Type 2024 & 2032
- Figure 72: South America Functional Near-infrared Optical Brain Imaging Market Volume (K Unit), by Application Type 2024 & 2032
- Figure 73: South America Functional Near-infrared Optical Brain Imaging Market Revenue Share (%), by Application Type 2024 & 2032
- Figure 74: South America Functional Near-infrared Optical Brain Imaging Market Volume Share (%), by Application Type 2024 & 2032
- Figure 75: South America Functional Near-infrared Optical Brain Imaging Market Revenue (Million), by End-User 2024 & 2032
- Figure 76: South America Functional Near-infrared Optical Brain Imaging Market Volume (K Unit), by End-User 2024 & 2032
- Figure 77: South America Functional Near-infrared Optical Brain Imaging Market Revenue Share (%), by End-User 2024 & 2032
- Figure 78: South America Functional Near-infrared Optical Brain Imaging Market Volume Share (%), by End-User 2024 & 2032
- Figure 79: South America Functional Near-infrared Optical Brain Imaging Market Revenue (Million), by Country 2024 & 2032
- Figure 80: South America Functional Near-infrared Optical Brain Imaging Market Volume (K Unit), by Country 2024 & 2032
- Figure 81: South America Functional Near-infrared Optical Brain Imaging Market Revenue Share (%), by Country 2024 & 2032
- Figure 82: South America Functional Near-infrared Optical Brain Imaging Market Volume Share (%), by Country 2024 & 2032
List of Tables
- Table 1: Global Functional Near-infrared Optical Brain Imaging Market Revenue Million Forecast, by Region 2019 & 2032
- Table 2: Global Functional Near-infrared Optical Brain Imaging Market Volume K Unit Forecast, by Region 2019 & 2032
- Table 3: Global Functional Near-infrared Optical Brain Imaging Market Revenue Million Forecast, by Application Type 2019 & 2032
- Table 4: Global Functional Near-infrared Optical Brain Imaging Market Volume K Unit Forecast, by Application Type 2019 & 2032
- Table 5: Global Functional Near-infrared Optical Brain Imaging Market Revenue Million Forecast, by End-User 2019 & 2032
- Table 6: Global Functional Near-infrared Optical Brain Imaging Market Volume K Unit Forecast, by End-User 2019 & 2032
- Table 7: Global Functional Near-infrared Optical Brain Imaging Market Revenue Million Forecast, by Region 2019 & 2032
- Table 8: Global Functional Near-infrared Optical Brain Imaging Market Volume K Unit Forecast, by Region 2019 & 2032
- Table 9: Global Functional Near-infrared Optical Brain Imaging Market Revenue Million Forecast, by Country 2019 & 2032
- Table 10: Global Functional Near-infrared Optical Brain Imaging Market Volume K Unit Forecast, by Country 2019 & 2032
- Table 11: Global Functional Near-infrared Optical Brain Imaging Market Revenue Million Forecast, by Country 2019 & 2032
- Table 12: Global Functional Near-infrared Optical Brain Imaging Market Volume K Unit Forecast, by Country 2019 & 2032
- Table 13: Global Functional Near-infrared Optical Brain Imaging Market Revenue Million Forecast, by Country 2019 & 2032
- Table 14: Global Functional Near-infrared Optical Brain Imaging Market Volume K Unit Forecast, by Country 2019 & 2032
- Table 15: Global Functional Near-infrared Optical Brain Imaging Market Revenue Million Forecast, by Country 2019 & 2032
- Table 16: Global Functional Near-infrared Optical Brain Imaging Market Volume K Unit Forecast, by Country 2019 & 2032
- Table 17: Global Functional Near-infrared Optical Brain Imaging Market Revenue Million Forecast, by Country 2019 & 2032
- Table 18: Global Functional Near-infrared Optical Brain Imaging Market Volume K Unit Forecast, by Country 2019 & 2032
- Table 19: Global Functional Near-infrared Optical Brain Imaging Market Revenue Million Forecast, by Application Type 2019 & 2032
- Table 20: Global Functional Near-infrared Optical Brain Imaging Market Volume K Unit Forecast, by Application Type 2019 & 2032
- Table 21: Global Functional Near-infrared Optical Brain Imaging Market Revenue Million Forecast, by End-User 2019 & 2032
- Table 22: Global Functional Near-infrared Optical Brain Imaging Market Volume K Unit Forecast, by End-User 2019 & 2032
- Table 23: Global Functional Near-infrared Optical Brain Imaging Market Revenue Million Forecast, by Country 2019 & 2032
- Table 24: Global Functional Near-infrared Optical Brain Imaging Market Volume K Unit Forecast, by Country 2019 & 2032
- Table 25: United States Functional Near-infrared Optical Brain Imaging Market Revenue (Million) Forecast, by Application 2019 & 2032
- Table 26: United States Functional Near-infrared Optical Brain Imaging Market Volume (K Unit) Forecast, by Application 2019 & 2032
- Table 27: Canada Functional Near-infrared Optical Brain Imaging Market Revenue (Million) Forecast, by Application 2019 & 2032
- Table 28: Canada Functional Near-infrared Optical Brain Imaging Market Volume (K Unit) Forecast, by Application 2019 & 2032
- Table 29: Mexico Functional Near-infrared Optical Brain Imaging Market Revenue (Million) Forecast, by Application 2019 & 2032
- Table 30: Mexico Functional Near-infrared Optical Brain Imaging Market Volume (K Unit) Forecast, by Application 2019 & 2032
- Table 31: Global Functional Near-infrared Optical Brain Imaging Market Revenue Million Forecast, by Application Type 2019 & 2032
- Table 32: Global Functional Near-infrared Optical Brain Imaging Market Volume K Unit Forecast, by Application Type 2019 & 2032
- Table 33: Global Functional Near-infrared Optical Brain Imaging Market Revenue Million Forecast, by End-User 2019 & 2032
- Table 34: Global Functional Near-infrared Optical Brain Imaging Market Volume K Unit Forecast, by End-User 2019 & 2032
- Table 35: Global Functional Near-infrared Optical Brain Imaging Market Revenue Million Forecast, by Country 2019 & 2032
- Table 36: Global Functional Near-infrared Optical Brain Imaging Market Volume K Unit Forecast, by Country 2019 & 2032
- Table 37: Germany Functional Near-infrared Optical Brain Imaging Market Revenue (Million) Forecast, by Application 2019 & 2032
- Table 38: Germany Functional Near-infrared Optical Brain Imaging Market Volume (K Unit) Forecast, by Application 2019 & 2032
- Table 39: United Kingdom Functional Near-infrared Optical Brain Imaging Market Revenue (Million) Forecast, by Application 2019 & 2032
- Table 40: United Kingdom Functional Near-infrared Optical Brain Imaging Market Volume (K Unit) Forecast, by Application 2019 & 2032
- Table 41: France Functional Near-infrared Optical Brain Imaging Market Revenue (Million) Forecast, by Application 2019 & 2032
- Table 42: France Functional Near-infrared Optical Brain Imaging Market Volume (K Unit) Forecast, by Application 2019 & 2032
- Table 43: Italy Functional Near-infrared Optical Brain Imaging Market Revenue (Million) Forecast, by Application 2019 & 2032
- Table 44: Italy Functional Near-infrared Optical Brain Imaging Market Volume (K Unit) Forecast, by Application 2019 & 2032
- Table 45: Spain Functional Near-infrared Optical Brain Imaging Market Revenue (Million) Forecast, by Application 2019 & 2032
- Table 46: Spain Functional Near-infrared Optical Brain Imaging Market Volume (K Unit) Forecast, by Application 2019 & 2032
- Table 47: Rest of Europe Functional Near-infrared Optical Brain Imaging Market Revenue (Million) Forecast, by Application 2019 & 2032
- Table 48: Rest of Europe Functional Near-infrared Optical Brain Imaging Market Volume (K Unit) Forecast, by Application 2019 & 2032
- Table 49: Global Functional Near-infrared Optical Brain Imaging Market Revenue Million Forecast, by Application Type 2019 & 2032
- Table 50: Global Functional Near-infrared Optical Brain Imaging Market Volume K Unit Forecast, by Application Type 2019 & 2032
- Table 51: Global Functional Near-infrared Optical Brain Imaging Market Revenue Million Forecast, by End-User 2019 & 2032
- Table 52: Global Functional Near-infrared Optical Brain Imaging Market Volume K Unit Forecast, by End-User 2019 & 2032
- Table 53: Global Functional Near-infrared Optical Brain Imaging Market Revenue Million Forecast, by Country 2019 & 2032
- Table 54: Global Functional Near-infrared Optical Brain Imaging Market Volume K Unit Forecast, by Country 2019 & 2032
- Table 55: China Functional Near-infrared Optical Brain Imaging Market Revenue (Million) Forecast, by Application 2019 & 2032
- Table 56: China Functional Near-infrared Optical Brain Imaging Market Volume (K Unit) Forecast, by Application 2019 & 2032
- Table 57: Japan Functional Near-infrared Optical Brain Imaging Market Revenue (Million) Forecast, by Application 2019 & 2032
- Table 58: Japan Functional Near-infrared Optical Brain Imaging Market Volume (K Unit) Forecast, by Application 2019 & 2032
- Table 59: India Functional Near-infrared Optical Brain Imaging Market Revenue (Million) Forecast, by Application 2019 & 2032
- Table 60: India Functional Near-infrared Optical Brain Imaging Market Volume (K Unit) Forecast, by Application 2019 & 2032
- Table 61: Australia Functional Near-infrared Optical Brain Imaging Market Revenue (Million) Forecast, by Application 2019 & 2032
- Table 62: Australia Functional Near-infrared Optical Brain Imaging Market Volume (K Unit) Forecast, by Application 2019 & 2032
- Table 63: South Korea Functional Near-infrared Optical Brain Imaging Market Revenue (Million) Forecast, by Application 2019 & 2032
- Table 64: South Korea Functional Near-infrared Optical Brain Imaging Market Volume (K Unit) Forecast, by Application 2019 & 2032
- Table 65: Rest of Asia Pacific Functional Near-infrared Optical Brain Imaging Market Revenue (Million) Forecast, by Application 2019 & 2032
- Table 66: Rest of Asia Pacific Functional Near-infrared Optical Brain Imaging Market Volume (K Unit) Forecast, by Application 2019 & 2032
- Table 67: Global Functional Near-infrared Optical Brain Imaging Market Revenue Million Forecast, by Application Type 2019 & 2032
- Table 68: Global Functional Near-infrared Optical Brain Imaging Market Volume K Unit Forecast, by Application Type 2019 & 2032
- Table 69: Global Functional Near-infrared Optical Brain Imaging Market Revenue Million Forecast, by End-User 2019 & 2032
- Table 70: Global Functional Near-infrared Optical Brain Imaging Market Volume K Unit Forecast, by End-User 2019 & 2032
- Table 71: Global Functional Near-infrared Optical Brain Imaging Market Revenue Million Forecast, by Country 2019 & 2032
- Table 72: Global Functional Near-infrared Optical Brain Imaging Market Volume K Unit Forecast, by Country 2019 & 2032
- Table 73: GCC Functional Near-infrared Optical Brain Imaging Market Revenue (Million) Forecast, by Application 2019 & 2032
- Table 74: GCC Functional Near-infrared Optical Brain Imaging Market Volume (K Unit) Forecast, by Application 2019 & 2032
- Table 75: South Africa Functional Near-infrared Optical Brain Imaging Market Revenue (Million) Forecast, by Application 2019 & 2032
- Table 76: South Africa Functional Near-infrared Optical Brain Imaging Market Volume (K Unit) Forecast, by Application 2019 & 2032
- Table 77: Rest of Middle East and Africa Functional Near-infrared Optical Brain Imaging Market Revenue (Million) Forecast, by Application 2019 & 2032
- Table 78: Rest of Middle East and Africa Functional Near-infrared Optical Brain Imaging Market Volume (K Unit) Forecast, by Application 2019 & 2032
- Table 79: Global Functional Near-infrared Optical Brain Imaging Market Revenue Million Forecast, by Application Type 2019 & 2032
- Table 80: Global Functional Near-infrared Optical Brain Imaging Market Volume K Unit Forecast, by Application Type 2019 & 2032
- Table 81: Global Functional Near-infrared Optical Brain Imaging Market Revenue Million Forecast, by End-User 2019 & 2032
- Table 82: Global Functional Near-infrared Optical Brain Imaging Market Volume K Unit Forecast, by End-User 2019 & 2032
- Table 83: Global Functional Near-infrared Optical Brain Imaging Market Revenue Million Forecast, by Country 2019 & 2032
- Table 84: Global Functional Near-infrared Optical Brain Imaging Market Volume K Unit Forecast, by Country 2019 & 2032
- Table 85: Brazil Functional Near-infrared Optical Brain Imaging Market Revenue (Million) Forecast, by Application 2019 & 2032
- Table 86: Brazil Functional Near-infrared Optical Brain Imaging Market Volume (K Unit) Forecast, by Application 2019 & 2032
- Table 87: Argentina Functional Near-infrared Optical Brain Imaging Market Revenue (Million) Forecast, by Application 2019 & 2032
- Table 88: Argentina Functional Near-infrared Optical Brain Imaging Market Volume (K Unit) Forecast, by Application 2019 & 2032
- Table 89: Rest of South America Functional Near-infrared Optical Brain Imaging Market Revenue (Million) Forecast, by Application 2019 & 2032
- Table 90: Rest of South America Functional Near-infrared Optical Brain Imaging Market Volume (K Unit) Forecast, by Application 2019 & 2032
Frequently Asked Questions
1. What is the projected Compound Annual Growth Rate (CAGR) of the Functional Near-infrared Optical Brain Imaging Market?
The projected CAGR is approximately 5.65%.
2. Which companies are prominent players in the Functional Near-infrared Optical Brain Imaging Market?
Key companies in the market include NIRx Medical Technologies LLC, Biopac Systems Inc, Artinis Medical Systems, Oxford Instruments, Soterix Medical Inc, Gowerlabs Ltd, Fujifilm Holdings Corporation (Hitachi Ltd ), PerkinElmer Inc, Shimadzu Corporation.
3. What are the main segments of the Functional Near-infrared Optical Brain Imaging Market?
The market segments include Application Type, End-User.
4. Can you provide details about the market size?
The market size is estimated to be USD XX Million as of 2022.
5. What are some drivers contributing to market growth?
Rising Prevalence of Neurological Disorders; Emerging Trends in Products.
6. What are the notable trends driving market growth?
Traumatic Brain Injury Segment Expects to Register a Strong Growth in the Forecast Period.
7. Are there any restraints impacting market growth?
Lack of Skilled Professionals.
8. Can you provide examples of recent developments in the market?
March 2022: Kernel, a neurotechnology company, developed a wearable headset device, Kernel Flow, for brain measurement which was based on time-domain functional near-infrared spectroscopy (TD-fNIRS), which enables accurate, high-resolution measurement of the brain and its functions by emitting picosecond pulses of light into tissue and measuring the arrival times of single photons. The device weighs 2.05 kg and contains 52 modules arranged in four plates that fit on either side of the head.
9. What pricing options are available for accessing the report?
Pricing options include single-user, multi-user, and enterprise licenses priced at USD 4750, USD 5250, and USD 8750 respectively.
10. Is the market size provided in terms of value or volume?
The market size is provided in terms of value, measured in Million and volume, measured in K Unit.
11. Are there any specific market keywords associated with the report?
Yes, the market keyword associated with the report is "Functional Near-infrared Optical Brain Imaging Market," which aids in identifying and referencing the specific market segment covered.
12. How do I determine which pricing option suits my needs best?
The pricing options vary based on user requirements and access needs. Individual users may opt for single-user licenses, while businesses requiring broader access may choose multi-user or enterprise licenses for cost-effective access to the report.
13. Are there any additional resources or data provided in the Functional Near-infrared Optical Brain Imaging Market report?
While the report offers comprehensive insights, it's advisable to review the specific contents or supplementary materials provided to ascertain if additional resources or data are available.
14. How can I stay updated on further developments or reports in the Functional Near-infrared Optical Brain Imaging Market?
To stay informed about further developments, trends, and reports in the Functional Near-infrared Optical Brain Imaging Market, consider subscribing to industry newsletters, following relevant companies and organizations, or regularly checking reputable industry news sources and publications.
Methodology
Step 1 - Identification of Relevant Samples Size from Population Database


Step 2 - Approaches for Defining Global Market Size (Value, Volume* & Price*)

Note*: In applicable scenarios
Step 3 - Data Sources
Primary Research
- Web Analytics
- Survey Reports
- Research Institute
- Latest Research Reports
- Opinion Leaders
Secondary Research
- Annual Reports
- White Paper
- Latest Press Release
- Industry Association
- Paid Database
- Investor Presentations

Step 4 - Data Triangulation
Involves using different sources of information in order to increase the validity of a study
These sources are likely to be stakeholders in a program - participants, other researchers, program staff, other community members, and so on.
Then we put all data in single framework & apply various statistical tools to find out the dynamic on the market.
During the analysis stage, feedback from the stakeholder groups would be compared to determine areas of agreement as well as areas of divergence
