

Key Insights
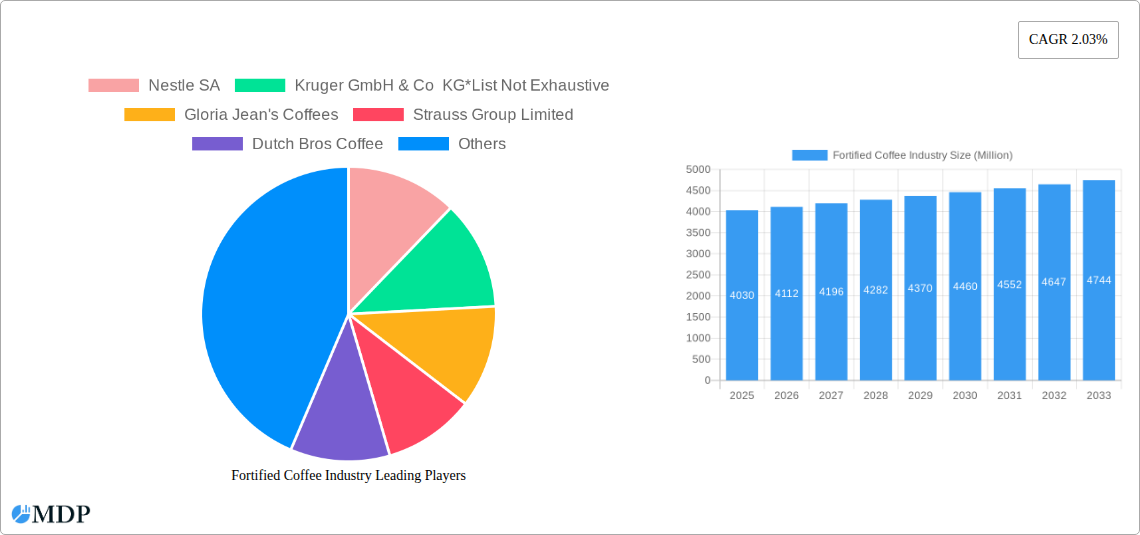
The fortified coffee market, valued at $4.03 billion in 2025, is projected to experience steady growth, driven by increasing consumer awareness of functional beverages and the desire for convenient, health-boosting options. The market's Compound Annual Growth Rate (CAGR) of 2.03% indicates a consistent expansion over the forecast period (2025-2033). Key drivers include the rising prevalence of health-conscious lifestyles, the growing demand for energy and cognitive enhancement, and the increasing popularity of functional foods and beverages. Product innovation, such as the incorporation of vitamins, minerals, probiotics, and adaptogens into coffee formulations, further fuels market expansion. The whole bean and ground coffee segments dominate the product type category, while supermarkets/hypermarkets and cafes/foodservice represent the primary distribution channels. However, the online retail segment is expected to witness significant growth, driven by e-commerce expansion and convenient home delivery options. Geographic regions like North America and Europe, with established coffee consumption cultures and high disposable incomes, currently hold substantial market share. However, rising coffee consumption in Asia-Pacific and other developing regions presents significant growth opportunities. Competition is intense, with established players like Nestlé, Starbucks, and Lavazza alongside emerging brands focusing on niche health-oriented products. Despite challenges such as fluctuating coffee bean prices and potential consumer resistance to heavily processed fortified products, the overall market outlook remains positive, driven by the continued demand for convenient and functional beverages.
The anticipated growth trajectory suggests a progressive increase in market value, reaching an estimated $5.0 billion by 2030 and potentially exceeding $6 billion by 2033. This growth will be largely influenced by effective marketing strategies emphasizing the health benefits of fortified coffee, alongside strategic partnerships between coffee companies and supplement manufacturers to enhance product offerings. Furthermore, regulatory changes concerning the labeling and safety of fortified food and beverage products may influence market growth in specific regions. Continued research and development efforts focusing on natural and sustainable fortification methods will contribute to the market's long-term expansion and sustainability. The success of individual companies will hinge on their ability to adapt to evolving consumer preferences, innovate product offerings, and establish strong distribution networks in both traditional and online channels.
Fortified Coffee Industry Market Report: 2019-2033
This comprehensive report provides an in-depth analysis of the Fortified Coffee industry, projecting a market valuation of $XX Million by 2033. Benefit from detailed insights into market dynamics, leading players, emerging trends, and lucrative growth opportunities within this rapidly expanding sector. This report is essential for investors, industry stakeholders, and businesses seeking to navigate the complexities of the fortified coffee market.
Fortified Coffee Industry Market Dynamics & Concentration
The global fortified coffee market, valued at $XX Million in 2024, is experiencing significant growth driven by increasing health consciousness and the rising demand for functional beverages. Market concentration is moderate, with several key players holding substantial market share but with ample room for smaller companies to carve a space for themselves. The market is characterized by:
- High Innovation: Continuous innovation in product formulations (e.g., adding vitamins, minerals, probiotics) fuels market growth.
- Stringent Regulatory Landscape: Regulations regarding labeling and health claims significantly impact market dynamics. Adherence is crucial for market entry and sustained operations.
- Substitute Products: The market faces competition from other functional beverages, including energy drinks and protein shakes.
- Evolving Consumer Preferences: Consumers are increasingly seeking convenience and healthier options, influencing product development.
- M&A Activity: The industry has witnessed a moderate level of mergers and acquisitions (M&A) activity, with approximately XX deals recorded between 2019 and 2024, indicating consolidation and expansion strategies.
The top five players currently hold approximately XX% of the market share, while the remaining share is distributed among numerous smaller companies. This indicates both opportunities for smaller businesses to compete and the potential for continued consolidation.
Fortified Coffee Industry Industry Trends & Analysis
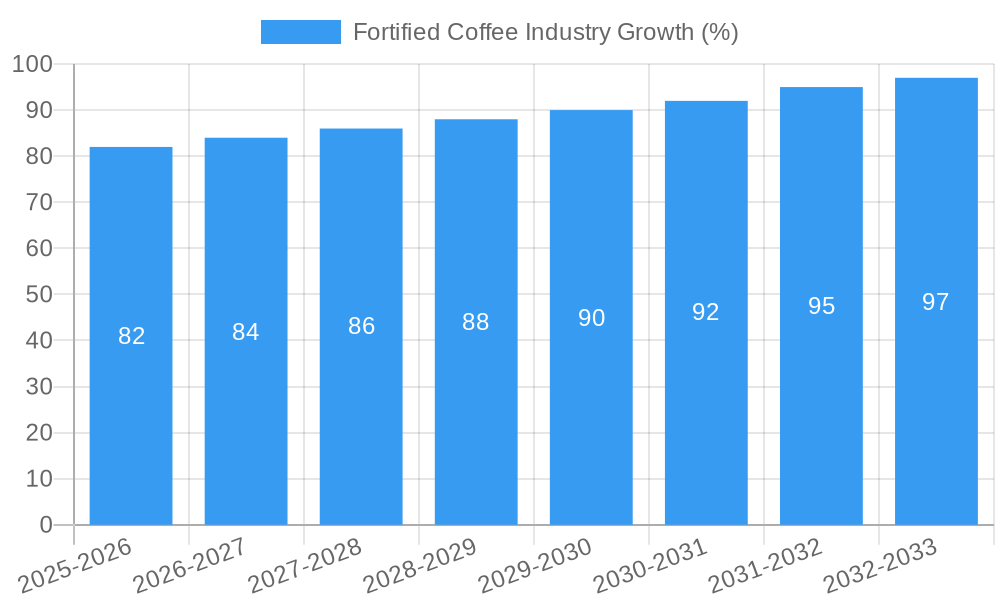
The fortified coffee market exhibits a robust Compound Annual Growth Rate (CAGR) of XX% during the forecast period (2025-2033). Several factors contribute to this growth:
- Health & Wellness Focus: Growing consumer interest in health and wellness significantly boosts the demand for fortified coffee products. The market penetration of fortified coffee among health-conscious consumers is estimated to be XX% in 2025.
- Technological Advancements: Improved extraction techniques and innovative packaging solutions are enhancing product quality and shelf life.
- Consumer Preferences: Demand for convenient, on-the-go options is driving growth in Ready-to-Drink (RTD) coffee segments. Furthermore, preference for specific functional ingredients, such as adaptogens or mushrooms, are pushing innovation.
- Competitive Dynamics: The rise of niche players and established coffee giants' increased foray into the fortified coffee space are both increasing competition and driving innovation. This competitive landscape fosters product differentiation and price competition.
Leading Markets & Segments in Fortified Coffee Industry
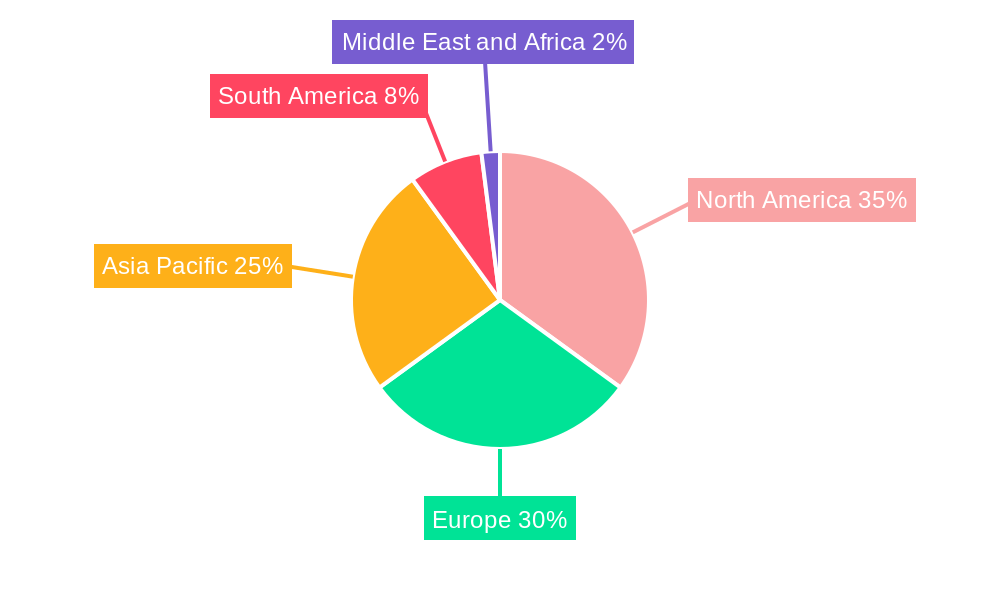
The North American region currently dominates the global fortified coffee market, accounting for approximately XX% of the total market value in 2024. Key growth drivers include:
- Developed Infrastructure: Robust retail infrastructure, including supermarkets, convenience stores, and online platforms facilitates easy product distribution.
- High Disposable Incomes: Higher disposable incomes enable consumers to purchase premium and functional products.
- Health-conscious Population: A large and growing segment of health-conscious consumers drives the demand for functional foods and beverages.
Leading Product Types:
- RTD Coffee: This segment shows the highest growth due to its convenience and rising consumer demand for ready-to-consume options.
- Ground Coffee: This segment maintains a significant market share due to its traditional appeal and wider availability.
- Whole Bean Coffee: This segment caters to a niche consumer group valuing freshness and customization.
Leading Distribution Channels:
- Supermarket/Hypermarket: This channel remains dominant due to wide reach and established consumer purchasing habits.
- Cafes and Foodservice: This segment is growing, with fortified coffee increasingly featured in menus.
- Convenience Stores: This channel captures on-the-go consumers.
- Online Stores: The online channel is rapidly growing due to its accessibility and convenience.
Fortified Coffee Industry Product Developments
Recent innovations include functional coffee blends with added vitamins, minerals, adaptogens, and even mushrooms. These products cater to specific consumer needs, including increased energy, improved cognitive function, and stress relief. The emphasis is on clean label formulations and sustainable sourcing practices, aligning with growing consumer preferences. This focus on targeted functional benefits represents a core driver of market expansion.
Key Drivers of Fortified Coffee Industry Growth
Key growth drivers include:
- Rising health consciousness and demand for functional beverages.
- Technological advancements leading to improved product quality and shelf life.
- Increasing disposable incomes, especially in developing economies.
- Favorable regulatory frameworks promoting innovation and product launches.
Challenges in the Fortified Coffee Industry Market
Significant challenges faced by the industry include:
- Stringent regulatory hurdles impacting product launches and marketing claims. Compliance costs represent a notable hurdle for smaller companies.
- Supply chain disruptions and price volatility of raw materials. These factors influence overall product costs and profitability.
- Intense competition from established coffee brands and emerging players. Competition forces innovation and price optimization.
Emerging Opportunities in Fortified Coffee Industry
Significant opportunities lie in the expansion into emerging markets, development of personalized fortified coffee options, and strategic partnerships to enhance distribution and brand awareness. Advances in formulation technology will lead to the development of products offering even more targeted health benefits. Furthermore, exploring sustainable sourcing and eco-friendly packaging is critical for long-term growth.
Leading Players in the Fortified Coffee Industry Sector
- Nestle SA
- Kruger GmbH & Co KG
- Gloria Jean's Coffees
- Strauss Group Limited
- Dutch Bros Coffee
- Ingenuity Beverages
- Starbucks Corporation
- Eight O' Clock Coffee Company
- Tata Coffee
- Luigi Lavazza SpA
- Bulletproof 360 Inc
Key Milestones in Fortified Coffee Industry Industry
- June 2021: Laird Superfood expands its functional coffee range with Soothe Coffee and Boost Coffee, showcasing a trend towards functional blends with added health benefits.
- June 2022: Cecors, Inc. (PsyKey) introduces a premium functional mushroom-infused coffee line in the US market, highlighting the emerging trend of incorporating adaptogens and functional ingredients.
- August 2022: Herbalife Nutrition launches High Protein Premix Coffee in Malaysia, targeting consumers seeking calorie-conscious and high-protein options. These launches reflect the industry's focus on functional benefits and diverse consumer needs.
Strategic Outlook for Fortified Coffee Industry Market
The fortified coffee market presents a significant opportunity for growth driven by increasing consumer demand for healthier and functional beverages. Strategic partnerships, technological innovation, and expansion into new markets are key success factors. The focus on sustainable practices and clean labeling will also influence future market success. The continued growth trajectory is promising, with considerable potential for market expansion throughout the forecast period.
Fortified Coffee Industry Segmentation
-
1. Product Type
- 1.1. Whole Bean
- 1.2. Ground Coffee
- 1.3. RTD Coffee
-
2. Distribution Channel
- 2.1. Supermarket/Hypermarket
- 2.2. Cafes and Foodservice
- 2.3. Convenience Stores
- 2.4. Online Stores
- 2.5. Other Distribution Channels
Fortified Coffee Industry Segmentation By Geography
-
1. North America
- 1.1. United States
- 1.2. Canada
- 1.3. Mexico
- 1.4. Rest of North America
-
2. Europe
- 2.1. United Kingdom
- 2.2. Germany
- 2.3. France
- 2.4. Russia
- 2.5. Italy
- 2.6. Spain
- 2.7. Rest of Europe
-
3. Asia Pacific
- 3.1. India
- 3.2. China
- 3.3. Japan
- 3.4. Australia
- 3.5. Rest of Asia Pacific
-
4. South America
- 4.1. Brazil
- 4.2. Argentina
- 4.3. Rest of South America
-
5. Middle East and Africa
- 5.1. South Africa
- 5.2. Saudi Arabia
- 5.3. Rest of Middle East and Africa
Fortified Coffee Industry REPORT HIGHLIGHTS
| Aspects | Details |
|---|---|
| Study Period | 2019-2033 |
| Base Year | 2024 |
| Estimated Year | 2025 |
| Forecast Period | 2025-2033 |
| Historical Period | 2019-2024 |
| Growth Rate | CAGR of 2.03% from 2019-2033 |
| Segmentation |
|
Table of Contents
- 1. Introduction
- 1.1. Research Scope
- 1.2. Market Segmentation
- 1.3. Research Methodology
- 1.4. Definitions and Assumptions
- 2. Executive Summary
- 2.1. Introduction
- 3. Market Dynamics
- 3.1. Introduction
- 3.2. Market Drivers
- 3.2.1. Escalating Concern for Quality Drinking Water; Strategic Investment by the Key Players
- 3.3. Market Restrains
- 3.3.1. Need for Stringent Regulatory Landscape
- 3.4. Market Trends
- 3.4.1. Growing Demand for Healthy Hydration
- 4. Market Factor Analysis
- 4.1. Porters Five Forces
- 4.2. Supply/Value Chain
- 4.3. PESTEL analysis
- 4.4. Market Entropy
- 4.5. Patent/Trademark Analysis
- 5. Global Fortified Coffee Industry Analysis, Insights and Forecast, 2019-2031
- 5.1. Market Analysis, Insights and Forecast - by Product Type
- 5.1.1. Whole Bean
- 5.1.2. Ground Coffee
- 5.1.3. RTD Coffee
- 5.2. Market Analysis, Insights and Forecast - by Distribution Channel
- 5.2.1. Supermarket/Hypermarket
- 5.2.2. Cafes and Foodservice
- 5.2.3. Convenience Stores
- 5.2.4. Online Stores
- 5.2.5. Other Distribution Channels
- 5.3. Market Analysis, Insights and Forecast - by Region
- 5.3.1. North America
- 5.3.2. Europe
- 5.3.3. Asia Pacific
- 5.3.4. South America
- 5.3.5. Middle East and Africa
- 5.1. Market Analysis, Insights and Forecast - by Product Type
- 6. North America Fortified Coffee Industry Analysis, Insights and Forecast, 2019-2031
- 6.1. Market Analysis, Insights and Forecast - by Product Type
- 6.1.1. Whole Bean
- 6.1.2. Ground Coffee
- 6.1.3. RTD Coffee
- 6.2. Market Analysis, Insights and Forecast - by Distribution Channel
- 6.2.1. Supermarket/Hypermarket
- 6.2.2. Cafes and Foodservice
- 6.2.3. Convenience Stores
- 6.2.4. Online Stores
- 6.2.5. Other Distribution Channels
- 6.1. Market Analysis, Insights and Forecast - by Product Type
- 7. Europe Fortified Coffee Industry Analysis, Insights and Forecast, 2019-2031
- 7.1. Market Analysis, Insights and Forecast - by Product Type
- 7.1.1. Whole Bean
- 7.1.2. Ground Coffee
- 7.1.3. RTD Coffee
- 7.2. Market Analysis, Insights and Forecast - by Distribution Channel
- 7.2.1. Supermarket/Hypermarket
- 7.2.2. Cafes and Foodservice
- 7.2.3. Convenience Stores
- 7.2.4. Online Stores
- 7.2.5. Other Distribution Channels
- 7.1. Market Analysis, Insights and Forecast - by Product Type
- 8. Asia Pacific Fortified Coffee Industry Analysis, Insights and Forecast, 2019-2031
- 8.1. Market Analysis, Insights and Forecast - by Product Type
- 8.1.1. Whole Bean
- 8.1.2. Ground Coffee
- 8.1.3. RTD Coffee
- 8.2. Market Analysis, Insights and Forecast - by Distribution Channel
- 8.2.1. Supermarket/Hypermarket
- 8.2.2. Cafes and Foodservice
- 8.2.3. Convenience Stores
- 8.2.4. Online Stores
- 8.2.5. Other Distribution Channels
- 8.1. Market Analysis, Insights and Forecast - by Product Type
- 9. South America Fortified Coffee Industry Analysis, Insights and Forecast, 2019-2031
- 9.1. Market Analysis, Insights and Forecast - by Product Type
- 9.1.1. Whole Bean
- 9.1.2. Ground Coffee
- 9.1.3. RTD Coffee
- 9.2. Market Analysis, Insights and Forecast - by Distribution Channel
- 9.2.1. Supermarket/Hypermarket
- 9.2.2. Cafes and Foodservice
- 9.2.3. Convenience Stores
- 9.2.4. Online Stores
- 9.2.5. Other Distribution Channels
- 9.1. Market Analysis, Insights and Forecast - by Product Type
- 10. Middle East and Africa Fortified Coffee Industry Analysis, Insights and Forecast, 2019-2031
- 10.1. Market Analysis, Insights and Forecast - by Product Type
- 10.1.1. Whole Bean
- 10.1.2. Ground Coffee
- 10.1.3. RTD Coffee
- 10.2. Market Analysis, Insights and Forecast - by Distribution Channel
- 10.2.1. Supermarket/Hypermarket
- 10.2.2. Cafes and Foodservice
- 10.2.3. Convenience Stores
- 10.2.4. Online Stores
- 10.2.5. Other Distribution Channels
- 10.1. Market Analysis, Insights and Forecast - by Product Type
- 11. North America Fortified Coffee Industry Analysis, Insights and Forecast, 2019-2031
- 11.1. Market Analysis, Insights and Forecast - By Country/Sub-region
- 11.1.1 United States
- 11.1.2 Canada
- 11.1.3 Mexico
- 11.1.4 Rest of North America
- 12. Europe Fortified Coffee Industry Analysis, Insights and Forecast, 2019-2031
- 12.1. Market Analysis, Insights and Forecast - By Country/Sub-region
- 12.1.1 United Kingdom
- 12.1.2 Germany
- 12.1.3 France
- 12.1.4 Russia
- 12.1.5 Italy
- 12.1.6 Spain
- 12.1.7 Rest of Europe
- 13. Asia Pacific Fortified Coffee Industry Analysis, Insights and Forecast, 2019-2031
- 13.1. Market Analysis, Insights and Forecast - By Country/Sub-region
- 13.1.1 India
- 13.1.2 China
- 13.1.3 Japan
- 13.1.4 Australia
- 13.1.5 Rest of Asia Pacific
- 14. South America Fortified Coffee Industry Analysis, Insights and Forecast, 2019-2031
- 14.1. Market Analysis, Insights and Forecast - By Country/Sub-region
- 14.1.1 Brazil
- 14.1.2 Argentina
- 14.1.3 Rest of South America
- 15. Middle East and Africa Fortified Coffee Industry Analysis, Insights and Forecast, 2019-2031
- 15.1. Market Analysis, Insights and Forecast - By Country/Sub-region
- 15.1.1 South Africa
- 15.1.2 Saudi Arabia
- 15.1.3 Rest of Middle East and Africa
- 16. Competitive Analysis
- 16.1. Global Market Share Analysis 2024
- 16.2. Company Profiles
- 16.2.1 Nestle SA
- 16.2.1.1. Overview
- 16.2.1.2. Products
- 16.2.1.3. SWOT Analysis
- 16.2.1.4. Recent Developments
- 16.2.1.5. Financials (Based on Availability)
- 16.2.2 Kruger GmbH & Co KG*List Not Exhaustive
- 16.2.2.1. Overview
- 16.2.2.2. Products
- 16.2.2.3. SWOT Analysis
- 16.2.2.4. Recent Developments
- 16.2.2.5. Financials (Based on Availability)
- 16.2.3 Gloria Jean's Coffees
- 16.2.3.1. Overview
- 16.2.3.2. Products
- 16.2.3.3. SWOT Analysis
- 16.2.3.4. Recent Developments
- 16.2.3.5. Financials (Based on Availability)
- 16.2.4 Strauss Group Limited
- 16.2.4.1. Overview
- 16.2.4.2. Products
- 16.2.4.3. SWOT Analysis
- 16.2.4.4. Recent Developments
- 16.2.4.5. Financials (Based on Availability)
- 16.2.5 Dutch Bros Coffee
- 16.2.5.1. Overview
- 16.2.5.2. Products
- 16.2.5.3. SWOT Analysis
- 16.2.5.4. Recent Developments
- 16.2.5.5. Financials (Based on Availability)
- 16.2.6 Ingenuity Beverages
- 16.2.6.1. Overview
- 16.2.6.2. Products
- 16.2.6.3. SWOT Analysis
- 16.2.6.4. Recent Developments
- 16.2.6.5. Financials (Based on Availability)
- 16.2.7 Starbucks Corporation
- 16.2.7.1. Overview
- 16.2.7.2. Products
- 16.2.7.3. SWOT Analysis
- 16.2.7.4. Recent Developments
- 16.2.7.5. Financials (Based on Availability)
- 16.2.8 Eight O' Clock Coffee Company
- 16.2.8.1. Overview
- 16.2.8.2. Products
- 16.2.8.3. SWOT Analysis
- 16.2.8.4. Recent Developments
- 16.2.8.5. Financials (Based on Availability)
- 16.2.9 Tata Coffee
- 16.2.9.1. Overview
- 16.2.9.2. Products
- 16.2.9.3. SWOT Analysis
- 16.2.9.4. Recent Developments
- 16.2.9.5. Financials (Based on Availability)
- 16.2.10 Luigi Lavazza SpA
- 16.2.10.1. Overview
- 16.2.10.2. Products
- 16.2.10.3. SWOT Analysis
- 16.2.10.4. Recent Developments
- 16.2.10.5. Financials (Based on Availability)
- 16.2.11 Bulletproof 360 Inc
- 16.2.11.1. Overview
- 16.2.11.2. Products
- 16.2.11.3. SWOT Analysis
- 16.2.11.4. Recent Developments
- 16.2.11.5. Financials (Based on Availability)
- 16.2.1 Nestle SA
List of Figures
- Figure 1: Global Fortified Coffee Industry Revenue Breakdown (Million, %) by Region 2024 & 2032
- Figure 2: North America Fortified Coffee Industry Revenue (Million), by Country 2024 & 2032
- Figure 3: North America Fortified Coffee Industry Revenue Share (%), by Country 2024 & 2032
- Figure 4: Europe Fortified Coffee Industry Revenue (Million), by Country 2024 & 2032
- Figure 5: Europe Fortified Coffee Industry Revenue Share (%), by Country 2024 & 2032
- Figure 6: Asia Pacific Fortified Coffee Industry Revenue (Million), by Country 2024 & 2032
- Figure 7: Asia Pacific Fortified Coffee Industry Revenue Share (%), by Country 2024 & 2032
- Figure 8: South America Fortified Coffee Industry Revenue (Million), by Country 2024 & 2032
- Figure 9: South America Fortified Coffee Industry Revenue Share (%), by Country 2024 & 2032
- Figure 10: Middle East and Africa Fortified Coffee Industry Revenue (Million), by Country 2024 & 2032
- Figure 11: Middle East and Africa Fortified Coffee Industry Revenue Share (%), by Country 2024 & 2032
- Figure 12: North America Fortified Coffee Industry Revenue (Million), by Product Type 2024 & 2032
- Figure 13: North America Fortified Coffee Industry Revenue Share (%), by Product Type 2024 & 2032
- Figure 14: North America Fortified Coffee Industry Revenue (Million), by Distribution Channel 2024 & 2032
- Figure 15: North America Fortified Coffee Industry Revenue Share (%), by Distribution Channel 2024 & 2032
- Figure 16: North America Fortified Coffee Industry Revenue (Million), by Country 2024 & 2032
- Figure 17: North America Fortified Coffee Industry Revenue Share (%), by Country 2024 & 2032
- Figure 18: Europe Fortified Coffee Industry Revenue (Million), by Product Type 2024 & 2032
- Figure 19: Europe Fortified Coffee Industry Revenue Share (%), by Product Type 2024 & 2032
- Figure 20: Europe Fortified Coffee Industry Revenue (Million), by Distribution Channel 2024 & 2032
- Figure 21: Europe Fortified Coffee Industry Revenue Share (%), by Distribution Channel 2024 & 2032
- Figure 22: Europe Fortified Coffee Industry Revenue (Million), by Country 2024 & 2032
- Figure 23: Europe Fortified Coffee Industry Revenue Share (%), by Country 2024 & 2032
- Figure 24: Asia Pacific Fortified Coffee Industry Revenue (Million), by Product Type 2024 & 2032
- Figure 25: Asia Pacific Fortified Coffee Industry Revenue Share (%), by Product Type 2024 & 2032
- Figure 26: Asia Pacific Fortified Coffee Industry Revenue (Million), by Distribution Channel 2024 & 2032
- Figure 27: Asia Pacific Fortified Coffee Industry Revenue Share (%), by Distribution Channel 2024 & 2032
- Figure 28: Asia Pacific Fortified Coffee Industry Revenue (Million), by Country 2024 & 2032
- Figure 29: Asia Pacific Fortified Coffee Industry Revenue Share (%), by Country 2024 & 2032
- Figure 30: South America Fortified Coffee Industry Revenue (Million), by Product Type 2024 & 2032
- Figure 31: South America Fortified Coffee Industry Revenue Share (%), by Product Type 2024 & 2032
- Figure 32: South America Fortified Coffee Industry Revenue (Million), by Distribution Channel 2024 & 2032
- Figure 33: South America Fortified Coffee Industry Revenue Share (%), by Distribution Channel 2024 & 2032
- Figure 34: South America Fortified Coffee Industry Revenue (Million), by Country 2024 & 2032
- Figure 35: South America Fortified Coffee Industry Revenue Share (%), by Country 2024 & 2032
- Figure 36: Middle East and Africa Fortified Coffee Industry Revenue (Million), by Product Type 2024 & 2032
- Figure 37: Middle East and Africa Fortified Coffee Industry Revenue Share (%), by Product Type 2024 & 2032
- Figure 38: Middle East and Africa Fortified Coffee Industry Revenue (Million), by Distribution Channel 2024 & 2032
- Figure 39: Middle East and Africa Fortified Coffee Industry Revenue Share (%), by Distribution Channel 2024 & 2032
- Figure 40: Middle East and Africa Fortified Coffee Industry Revenue (Million), by Country 2024 & 2032
- Figure 41: Middle East and Africa Fortified Coffee Industry Revenue Share (%), by Country 2024 & 2032
List of Tables
- Table 1: Global Fortified Coffee Industry Revenue Million Forecast, by Region 2019 & 2032
- Table 2: Global Fortified Coffee Industry Revenue Million Forecast, by Product Type 2019 & 2032
- Table 3: Global Fortified Coffee Industry Revenue Million Forecast, by Distribution Channel 2019 & 2032
- Table 4: Global Fortified Coffee Industry Revenue Million Forecast, by Region 2019 & 2032
- Table 5: Global Fortified Coffee Industry Revenue Million Forecast, by Country 2019 & 2032
- Table 6: United States Fortified Coffee Industry Revenue (Million) Forecast, by Application 2019 & 2032
- Table 7: Canada Fortified Coffee Industry Revenue (Million) Forecast, by Application 2019 & 2032
- Table 8: Mexico Fortified Coffee Industry Revenue (Million) Forecast, by Application 2019 & 2032
- Table 9: Rest of North America Fortified Coffee Industry Revenue (Million) Forecast, by Application 2019 & 2032
- Table 10: Global Fortified Coffee Industry Revenue Million Forecast, by Country 2019 & 2032
- Table 11: United Kingdom Fortified Coffee Industry Revenue (Million) Forecast, by Application 2019 & 2032
- Table 12: Germany Fortified Coffee Industry Revenue (Million) Forecast, by Application 2019 & 2032
- Table 13: France Fortified Coffee Industry Revenue (Million) Forecast, by Application 2019 & 2032
- Table 14: Russia Fortified Coffee Industry Revenue (Million) Forecast, by Application 2019 & 2032
- Table 15: Italy Fortified Coffee Industry Revenue (Million) Forecast, by Application 2019 & 2032
- Table 16: Spain Fortified Coffee Industry Revenue (Million) Forecast, by Application 2019 & 2032
- Table 17: Rest of Europe Fortified Coffee Industry Revenue (Million) Forecast, by Application 2019 & 2032
- Table 18: Global Fortified Coffee Industry Revenue Million Forecast, by Country 2019 & 2032
- Table 19: India Fortified Coffee Industry Revenue (Million) Forecast, by Application 2019 & 2032
- Table 20: China Fortified Coffee Industry Revenue (Million) Forecast, by Application 2019 & 2032
- Table 21: Japan Fortified Coffee Industry Revenue (Million) Forecast, by Application 2019 & 2032
- Table 22: Australia Fortified Coffee Industry Revenue (Million) Forecast, by Application 2019 & 2032
- Table 23: Rest of Asia Pacific Fortified Coffee Industry Revenue (Million) Forecast, by Application 2019 & 2032
- Table 24: Global Fortified Coffee Industry Revenue Million Forecast, by Country 2019 & 2032
- Table 25: Brazil Fortified Coffee Industry Revenue (Million) Forecast, by Application 2019 & 2032
- Table 26: Argentina Fortified Coffee Industry Revenue (Million) Forecast, by Application 2019 & 2032
- Table 27: Rest of South America Fortified Coffee Industry Revenue (Million) Forecast, by Application 2019 & 2032
- Table 28: Global Fortified Coffee Industry Revenue Million Forecast, by Country 2019 & 2032
- Table 29: South Africa Fortified Coffee Industry Revenue (Million) Forecast, by Application 2019 & 2032
- Table 30: Saudi Arabia Fortified Coffee Industry Revenue (Million) Forecast, by Application 2019 & 2032
- Table 31: Rest of Middle East and Africa Fortified Coffee Industry Revenue (Million) Forecast, by Application 2019 & 2032
- Table 32: Global Fortified Coffee Industry Revenue Million Forecast, by Product Type 2019 & 2032
- Table 33: Global Fortified Coffee Industry Revenue Million Forecast, by Distribution Channel 2019 & 2032
- Table 34: Global Fortified Coffee Industry Revenue Million Forecast, by Country 2019 & 2032
- Table 35: United States Fortified Coffee Industry Revenue (Million) Forecast, by Application 2019 & 2032
- Table 36: Canada Fortified Coffee Industry Revenue (Million) Forecast, by Application 2019 & 2032
- Table 37: Mexico Fortified Coffee Industry Revenue (Million) Forecast, by Application 2019 & 2032
- Table 38: Rest of North America Fortified Coffee Industry Revenue (Million) Forecast, by Application 2019 & 2032
- Table 39: Global Fortified Coffee Industry Revenue Million Forecast, by Product Type 2019 & 2032
- Table 40: Global Fortified Coffee Industry Revenue Million Forecast, by Distribution Channel 2019 & 2032
- Table 41: Global Fortified Coffee Industry Revenue Million Forecast, by Country 2019 & 2032
- Table 42: United Kingdom Fortified Coffee Industry Revenue (Million) Forecast, by Application 2019 & 2032
- Table 43: Germany Fortified Coffee Industry Revenue (Million) Forecast, by Application 2019 & 2032
- Table 44: France Fortified Coffee Industry Revenue (Million) Forecast, by Application 2019 & 2032
- Table 45: Russia Fortified Coffee Industry Revenue (Million) Forecast, by Application 2019 & 2032
- Table 46: Italy Fortified Coffee Industry Revenue (Million) Forecast, by Application 2019 & 2032
- Table 47: Spain Fortified Coffee Industry Revenue (Million) Forecast, by Application 2019 & 2032
- Table 48: Rest of Europe Fortified Coffee Industry Revenue (Million) Forecast, by Application 2019 & 2032
- Table 49: Global Fortified Coffee Industry Revenue Million Forecast, by Product Type 2019 & 2032
- Table 50: Global Fortified Coffee Industry Revenue Million Forecast, by Distribution Channel 2019 & 2032
- Table 51: Global Fortified Coffee Industry Revenue Million Forecast, by Country 2019 & 2032
- Table 52: India Fortified Coffee Industry Revenue (Million) Forecast, by Application 2019 & 2032
- Table 53: China Fortified Coffee Industry Revenue (Million) Forecast, by Application 2019 & 2032
- Table 54: Japan Fortified Coffee Industry Revenue (Million) Forecast, by Application 2019 & 2032
- Table 55: Australia Fortified Coffee Industry Revenue (Million) Forecast, by Application 2019 & 2032
- Table 56: Rest of Asia Pacific Fortified Coffee Industry Revenue (Million) Forecast, by Application 2019 & 2032
- Table 57: Global Fortified Coffee Industry Revenue Million Forecast, by Product Type 2019 & 2032
- Table 58: Global Fortified Coffee Industry Revenue Million Forecast, by Distribution Channel 2019 & 2032
- Table 59: Global Fortified Coffee Industry Revenue Million Forecast, by Country 2019 & 2032
- Table 60: Brazil Fortified Coffee Industry Revenue (Million) Forecast, by Application 2019 & 2032
- Table 61: Argentina Fortified Coffee Industry Revenue (Million) Forecast, by Application 2019 & 2032
- Table 62: Rest of South America Fortified Coffee Industry Revenue (Million) Forecast, by Application 2019 & 2032
- Table 63: Global Fortified Coffee Industry Revenue Million Forecast, by Product Type 2019 & 2032
- Table 64: Global Fortified Coffee Industry Revenue Million Forecast, by Distribution Channel 2019 & 2032
- Table 65: Global Fortified Coffee Industry Revenue Million Forecast, by Country 2019 & 2032
- Table 66: South Africa Fortified Coffee Industry Revenue (Million) Forecast, by Application 2019 & 2032
- Table 67: Saudi Arabia Fortified Coffee Industry Revenue (Million) Forecast, by Application 2019 & 2032
- Table 68: Rest of Middle East and Africa Fortified Coffee Industry Revenue (Million) Forecast, by Application 2019 & 2032
Frequently Asked Questions
1. What is the projected Compound Annual Growth Rate (CAGR) of the Fortified Coffee Industry?
The projected CAGR is approximately 2.03%.
2. Which companies are prominent players in the Fortified Coffee Industry?
Key companies in the market include Nestle SA, Kruger GmbH & Co KG*List Not Exhaustive, Gloria Jean's Coffees, Strauss Group Limited, Dutch Bros Coffee, Ingenuity Beverages, Starbucks Corporation, Eight O' Clock Coffee Company, Tata Coffee, Luigi Lavazza SpA, Bulletproof 360 Inc.
3. What are the main segments of the Fortified Coffee Industry?
The market segments include Product Type, Distribution Channel.
4. Can you provide details about the market size?
The market size is estimated to be USD 4.03 Million as of 2022.
5. What are some drivers contributing to market growth?
Escalating Concern for Quality Drinking Water; Strategic Investment by the Key Players.
6. What are the notable trends driving market growth?
Growing Demand for Healthy Hydration.
7. Are there any restraints impacting market growth?
Need for Stringent Regulatory Landscape.
8. Can you provide examples of recent developments in the market?
August 2022: Herbalife Nutrition launched its first functional coffee mix, High Protein Premix Coffee, in the Malaysian market. According to the company statement, the high-protein premix coffee was designed for consumers who want to reduce calories, fat, and sugar.
9. What pricing options are available for accessing the report?
Pricing options include single-user, multi-user, and enterprise licenses priced at USD 4750, USD 5250, and USD 8750 respectively.
10. Is the market size provided in terms of value or volume?
The market size is provided in terms of value, measured in Million.
11. Are there any specific market keywords associated with the report?
Yes, the market keyword associated with the report is "Fortified Coffee Industry," which aids in identifying and referencing the specific market segment covered.
12. How do I determine which pricing option suits my needs best?
The pricing options vary based on user requirements and access needs. Individual users may opt for single-user licenses, while businesses requiring broader access may choose multi-user or enterprise licenses for cost-effective access to the report.
13. Are there any additional resources or data provided in the Fortified Coffee Industry report?
While the report offers comprehensive insights, it's advisable to review the specific contents or supplementary materials provided to ascertain if additional resources or data are available.
14. How can I stay updated on further developments or reports in the Fortified Coffee Industry?
To stay informed about further developments, trends, and reports in the Fortified Coffee Industry, consider subscribing to industry newsletters, following relevant companies and organizations, or regularly checking reputable industry news sources and publications.
Methodology
Step 1 - Identification of Relevant Samples Size from Population Database


Step 2 - Approaches for Defining Global Market Size (Value, Volume* & Price*)

Note*: In applicable scenarios
Step 3 - Data Sources
Primary Research
- Web Analytics
- Survey Reports
- Research Institute
- Latest Research Reports
- Opinion Leaders
Secondary Research
- Annual Reports
- White Paper
- Latest Press Release
- Industry Association
- Paid Database
- Investor Presentations

Step 4 - Data Triangulation
Involves using different sources of information in order to increase the validity of a study
These sources are likely to be stakeholders in a program - participants, other researchers, program staff, other community members, and so on.
Then we put all data in single framework & apply various statistical tools to find out the dynamic on the market.
During the analysis stage, feedback from the stakeholder groups would be compared to determine areas of agreement as well as areas of divergence
