

Key Insights
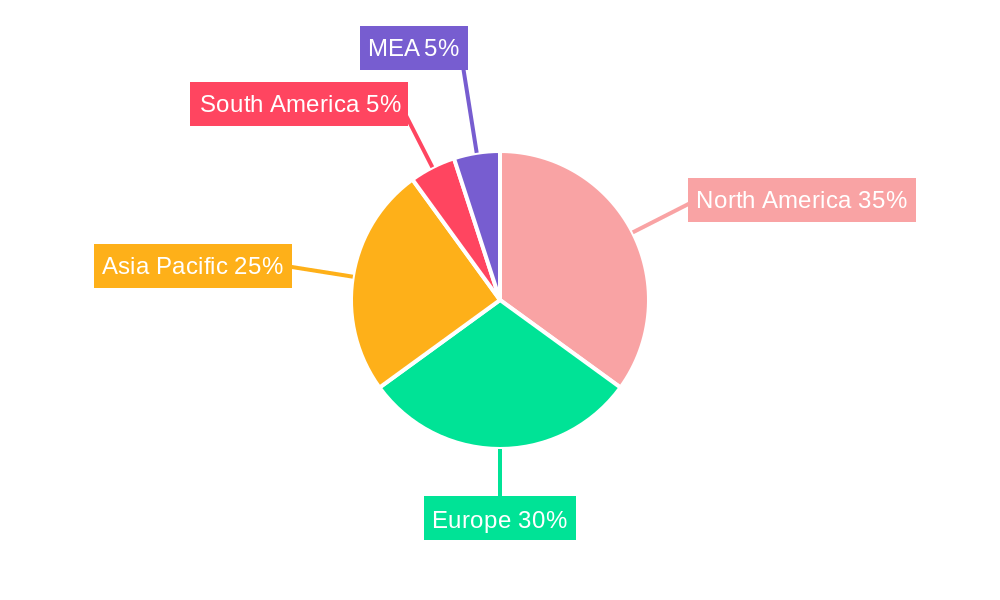
The global food certification market is experiencing robust growth, driven by increasing consumer demand for safe, high-quality, and ethically sourced food products. The market's expansion is fueled by stringent government regulations regarding food safety and traceability, coupled with the rising awareness among consumers about food-borne illnesses and the importance of certifications like ISO 22000, BRCGS, Halal, and GMP+. The expanding food processing and manufacturing sectors, particularly within the meat, poultry, seafood, dairy, and infant food industries, are key contributors to market growth. Furthermore, the increasing adoption of sustainable and ethical sourcing practices by food companies is pushing the demand for certifications that verify compliance with these standards. The market is segmented by certification type (ISO 22000, BRCGS, Halal, GMP+/FSA, and others) and end-user industry (meat, poultry, seafood, dairy, infant food, beverages, bakery, confectionery, and others), offering diverse growth opportunities for certification bodies. North America and Europe currently hold significant market shares, but the Asia-Pacific region is expected to witness the fastest growth due to rapid economic development and increasing food safety concerns in developing economies.
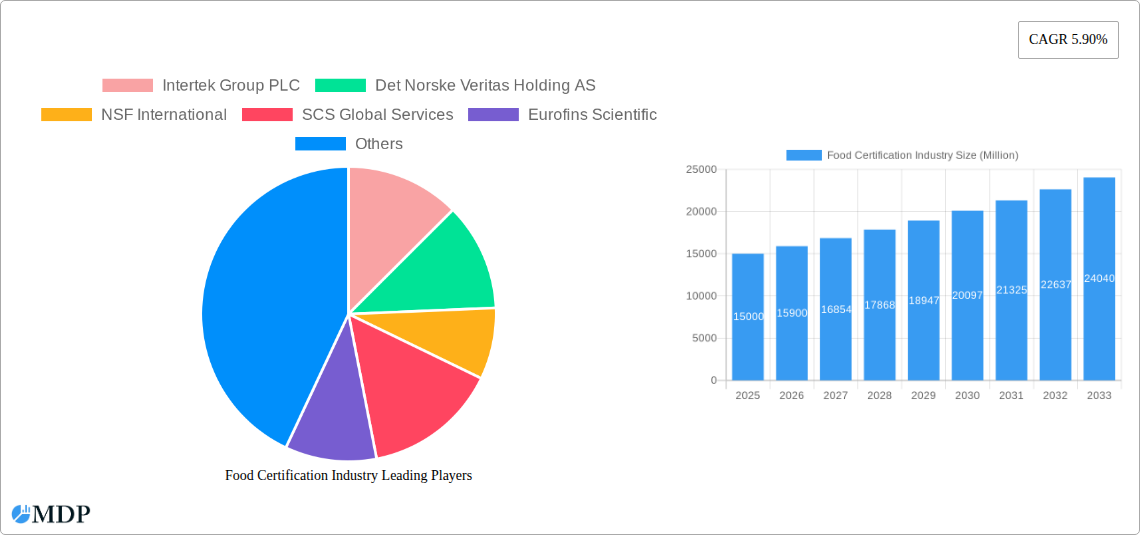
Competition in the food certification market is intense, with major players including Intertek, DNV, NSF International, SGS, and Bureau Veritas vying for market share. These companies are constantly innovating to offer comprehensive certification services and expanding their geographic reach. However, challenges remain, such as the high cost of certification, which can be a barrier for small and medium-sized enterprises (SMEs), and the need for standardization across different certification schemes to reduce confusion and duplication of effort. The market's future growth will depend on factors such as evolving consumer preferences, technological advancements in food safety testing and traceability, and the effectiveness of regulatory frameworks. The continued emphasis on food safety and sustainability will be vital in shaping the trajectory of the food certification market over the forecast period, potentially leading to a slightly higher CAGR than the initial 5.90%.
Food Certification Industry Market Report: 2019-2033
This comprehensive report provides an in-depth analysis of the global Food Certification Industry, projecting a market value exceeding $XX Million by 2033. This detailed analysis covers market dynamics, leading players, key trends, and future growth opportunities, offering invaluable insights for industry stakeholders, investors, and businesses seeking to navigate this rapidly evolving sector. The report utilizes data from 2019-2024 (historical period), with 2025 as the base and estimated year, and forecasts extending to 2033.
Food Certification Industry Market Dynamics & Concentration
The global food certification market, valued at $XX Million in 2025, is characterized by moderate concentration, with several major players holding significant market share. Innovation is a key driver, fueled by evolving consumer demand for transparency, traceability, and sustainability. Stringent regulatory frameworks, varying across regions, significantly impact market growth and adoption of specific certifications. Product substitutes, while limited, include internal quality control measures, but the growing emphasis on third-party validation makes certified products increasingly preferred. Consumer trends towards healthier, ethically sourced, and sustainable food drive demand across all segments. M&A activity is significant, with xx deals recorded in the past five years, shaping market consolidation and service expansion.
- Market Share: Top 5 players hold approximately 60% of the market share in 2025.
- M&A Activity: An average of xx M&A deals per year were observed during 2019-2024.
- Key Drivers: Consumer demand for transparency, stringent regulatory frameworks, and increasing focus on ethical sourcing.
- Challenges: Maintaining certification standards across diverse supply chains, and managing the competitive landscape.
Food Certification Industry Industry Trends & Analysis
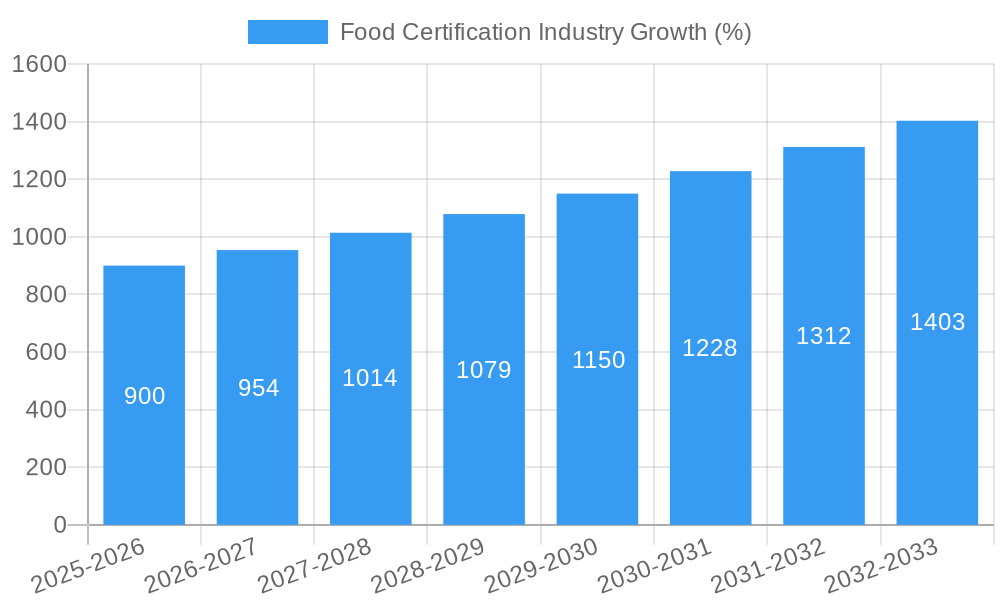
The food certification market demonstrates a robust CAGR of xx% during the forecast period (2025-2033). Market growth is predominantly driven by rising consumer awareness of food safety and ethical sourcing, along with the increasing stringency of food safety regulations globally. Technological advancements, including blockchain technology for enhanced traceability and AI for efficient auditing, are disrupting traditional processes, improving efficiency and transparency. Consumer preferences are shifting toward plant-based, organic, and allergen-free products, boosting the demand for relevant certifications. Competitive dynamics are largely shaped by companies' ability to adapt to these changes, innovate their service offerings, and expand their global reach. Market penetration of certifications like ISO 22000 and BRCGS remains high, while newer certifications like plant-based and vegan certifications are gaining traction.
Leading Markets & Segments in Food Certification Industry
The meat, poultry, and seafood segment dominates the end-user industry, contributing xx% to the total market revenue in 2025. The ISO 22000 - Food Safety Management System holds the largest market share among certification types, driven by its broad applicability and international recognition. The European Union and North America represent the largest regional markets.
- Key Drivers (EU): Robust food safety regulations, strong consumer awareness, well-established infrastructure.
- Key Drivers (North America): Growing demand for organic and plant-based products, stringent regulations, expanding food processing sector.
- Dominant Segment: Meat, Poultry, and Seafood Products (End-user industry); ISO 22000 (Certification type).
- Dominant Regions: European Union and North America.
Food Certification Industry Product Developments
Recent product innovations focus on addressing emerging consumer demands. Certifications for vegan, plant-based, and sustainably sourced products are gaining significant traction, reflecting a clear market response to evolving consumer preferences. The integration of blockchain technology provides enhanced traceability and transparency, adding value to existing certification services. Furthermore, digital platforms streamline the certification process, improving efficiency and accessibility. These innovations leverage technological advancements to enhance service offerings and create competitive advantages.
Key Drivers of Food Certification Industry Growth
Several factors fuel market growth. Stringent government regulations mandating food safety and traceability are paramount. Increasing consumer awareness of food safety, ethical sourcing, and sustainability drives demand. Technological advancements, such as blockchain for supply chain transparency and AI for efficient auditing, also contribute to growth. Lastly, the rising adoption of plant-based and sustainable food products increases demand for corresponding certifications.
Challenges in the Food Certification Industry Market
The industry faces challenges including maintaining consistent certification standards across diverse and complex global supply chains. High certification costs pose a barrier for smaller businesses, limiting market penetration. The intense competition among numerous certification bodies necessitates continuous innovation and differentiation. Furthermore, regulatory inconsistencies across different jurisdictions create complexities for businesses operating internationally.
Emerging Opportunities in Food Certification Industry
Significant opportunities exist for expansion into emerging markets with growing consumer awareness and stricter regulations. Strategic partnerships between certification bodies and technology providers can lead to innovative solutions. The development of new certifications addressing niche consumer demands, such as allergen-free or functional foods, presents a growth avenue. Lastly, the increasing focus on sustainable practices provides opportunities for certifications addressing environmental impact.
Leading Players in the Food Certification Industry Sector
- Intertek Group PLC
- Det Norske Veritas Holding AS
- NSF International
- SCS Global Services
- Eurofins Scientific
- Compagnie Merieux Alliance SAS (Merieux Nutrisciences)
- SGS Group
- AsureQuality Limited
- Bureau Veritas
- TÜV SÜD AG
Key Milestones in Food Certification Industry Industry
- November 2022: SCS Global Services launched its plant-based certification program, expanding the market for plant-based product certifications.
- November 2022: SGS SA introduced the SGS Food Contact Product Certification Mark, enhancing product safety and compliance.
- September 2022: Intertek Group PLC introduced a new vegan food certification mark, targeting the growing vegan market. These launches showcase the industry's responsiveness to evolving consumer preferences and regulatory changes.
Strategic Outlook for Food Certification Industry Market
The food certification industry is poised for continued growth, driven by increasing consumer demand for transparency and sustainable practices, alongside stringent government regulations. Strategic partnerships with technology providers will enhance efficiency and market penetration. Expansion into emerging markets with growing middle classes and increasing food safety concerns presents significant opportunities. Companies focusing on innovation and adapting to evolving consumer preferences are best positioned to capture the future market potential.
Food Certification Industry Segmentation
-
1. End-user Industry
- 1.1. Meat, Poultry, and Seafood Products
- 1.2. Dairy Products
- 1.3. Infant Food
- 1.4. Beverages
- 1.5. Bakery and Confectionery Products
- 1.6. Other End-user Industries
-
2. Type
- 2.1. ISO 22000 - Food Safety Management System
- 2.2. BRCGS
- 2.3. Halal Certification
- 2.4. GMP+/FSA
- 2.5. Other Certifications
Food Certification Industry Segmentation By Geography
-
1. North America
- 1.1. United States
- 1.2. Canada
- 1.3. Mexico
- 1.4. Rest of North America
-
2. Europe
- 2.1. United Kingdom
- 2.2. Germany
- 2.3. France
- 2.4. Russia
- 2.5. Italy
- 2.6. Spain
- 2.7. Rest of Europe
-
3. Asia Pacific
- 3.1. India
- 3.2. China
- 3.3. Japan
- 3.4. Australia
- 3.5. Rest of Asia Pacific
-
4. South America
- 4.1. Brazil
- 4.2. Argentina
- 4.3. Rest of South America
- 5. Middle East
-
6. South Africa
- 6.1. Saudi Arabia
- 6.2. Rest of Middle East
Food Certification Industry REPORT HIGHLIGHTS
| Aspects | Details |
|---|---|
| Study Period | 2019-2033 |
| Base Year | 2024 |
| Estimated Year | 2025 |
| Forecast Period | 2025-2033 |
| Historical Period | 2019-2024 |
| Growth Rate | CAGR of 5.90% from 2019-2033 |
| Segmentation |
|
Table of Contents
- 1. Introduction
- 1.1. Research Scope
- 1.2. Market Segmentation
- 1.3. Research Methodology
- 1.4. Definitions and Assumptions
- 2. Executive Summary
- 2.1. Introduction
- 3. Market Dynamics
- 3.1. Introduction
- 3.2. Market Drivers
- 3.2.1. Growing consumer demand for transparency and quality assurance in food products drives the need for certification
- 3.3. Market Restrains
- 3.3.1. High Certification Costs
- 3.4. Market Trends
- 3.4.1. Increasing use of technology such as blockchain and digital platforms is enhancing transparency and traceability in the certification process
- 4. Market Factor Analysis
- 4.1. Porters Five Forces
- 4.2. Supply/Value Chain
- 4.3. PESTEL analysis
- 4.4. Market Entropy
- 4.5. Patent/Trademark Analysis
- 5. Global Food Certification Industry Analysis, Insights and Forecast, 2019-2031
- 5.1. Market Analysis, Insights and Forecast - by End-user Industry
- 5.1.1. Meat, Poultry, and Seafood Products
- 5.1.2. Dairy Products
- 5.1.3. Infant Food
- 5.1.4. Beverages
- 5.1.5. Bakery and Confectionery Products
- 5.1.6. Other End-user Industries
- 5.2. Market Analysis, Insights and Forecast - by Type
- 5.2.1. ISO 22000 - Food Safety Management System
- 5.2.2. BRCGS
- 5.2.3. Halal Certification
- 5.2.4. GMP+/FSA
- 5.2.5. Other Certifications
- 5.3. Market Analysis, Insights and Forecast - by Region
- 5.3.1. North America
- 5.3.2. Europe
- 5.3.3. Asia Pacific
- 5.3.4. South America
- 5.3.5. Middle East
- 5.3.6. South Africa
- 5.1. Market Analysis, Insights and Forecast - by End-user Industry
- 6. North America Food Certification Industry Analysis, Insights and Forecast, 2019-2031
- 6.1. Market Analysis, Insights and Forecast - by End-user Industry
- 6.1.1. Meat, Poultry, and Seafood Products
- 6.1.2. Dairy Products
- 6.1.3. Infant Food
- 6.1.4. Beverages
- 6.1.5. Bakery and Confectionery Products
- 6.1.6. Other End-user Industries
- 6.2. Market Analysis, Insights and Forecast - by Type
- 6.2.1. ISO 22000 - Food Safety Management System
- 6.2.2. BRCGS
- 6.2.3. Halal Certification
- 6.2.4. GMP+/FSA
- 6.2.5. Other Certifications
- 6.1. Market Analysis, Insights and Forecast - by End-user Industry
- 7. Europe Food Certification Industry Analysis, Insights and Forecast, 2019-2031
- 7.1. Market Analysis, Insights and Forecast - by End-user Industry
- 7.1.1. Meat, Poultry, and Seafood Products
- 7.1.2. Dairy Products
- 7.1.3. Infant Food
- 7.1.4. Beverages
- 7.1.5. Bakery and Confectionery Products
- 7.1.6. Other End-user Industries
- 7.2. Market Analysis, Insights and Forecast - by Type
- 7.2.1. ISO 22000 - Food Safety Management System
- 7.2.2. BRCGS
- 7.2.3. Halal Certification
- 7.2.4. GMP+/FSA
- 7.2.5. Other Certifications
- 7.1. Market Analysis, Insights and Forecast - by End-user Industry
- 8. Asia Pacific Food Certification Industry Analysis, Insights and Forecast, 2019-2031
- 8.1. Market Analysis, Insights and Forecast - by End-user Industry
- 8.1.1. Meat, Poultry, and Seafood Products
- 8.1.2. Dairy Products
- 8.1.3. Infant Food
- 8.1.4. Beverages
- 8.1.5. Bakery and Confectionery Products
- 8.1.6. Other End-user Industries
- 8.2. Market Analysis, Insights and Forecast - by Type
- 8.2.1. ISO 22000 - Food Safety Management System
- 8.2.2. BRCGS
- 8.2.3. Halal Certification
- 8.2.4. GMP+/FSA
- 8.2.5. Other Certifications
- 8.1. Market Analysis, Insights and Forecast - by End-user Industry
- 9. South America Food Certification Industry Analysis, Insights and Forecast, 2019-2031
- 9.1. Market Analysis, Insights and Forecast - by End-user Industry
- 9.1.1. Meat, Poultry, and Seafood Products
- 9.1.2. Dairy Products
- 9.1.3. Infant Food
- 9.1.4. Beverages
- 9.1.5. Bakery and Confectionery Products
- 9.1.6. Other End-user Industries
- 9.2. Market Analysis, Insights and Forecast - by Type
- 9.2.1. ISO 22000 - Food Safety Management System
- 9.2.2. BRCGS
- 9.2.3. Halal Certification
- 9.2.4. GMP+/FSA
- 9.2.5. Other Certifications
- 9.1. Market Analysis, Insights and Forecast - by End-user Industry
- 10. Middle East Food Certification Industry Analysis, Insights and Forecast, 2019-2031
- 10.1. Market Analysis, Insights and Forecast - by End-user Industry
- 10.1.1. Meat, Poultry, and Seafood Products
- 10.1.2. Dairy Products
- 10.1.3. Infant Food
- 10.1.4. Beverages
- 10.1.5. Bakery and Confectionery Products
- 10.1.6. Other End-user Industries
- 10.2. Market Analysis, Insights and Forecast - by Type
- 10.2.1. ISO 22000 - Food Safety Management System
- 10.2.2. BRCGS
- 10.2.3. Halal Certification
- 10.2.4. GMP+/FSA
- 10.2.5. Other Certifications
- 10.1. Market Analysis, Insights and Forecast - by End-user Industry
- 11. South Africa Food Certification Industry Analysis, Insights and Forecast, 2019-2031
- 11.1. Market Analysis, Insights and Forecast - by End-user Industry
- 11.1.1. Meat, Poultry, and Seafood Products
- 11.1.2. Dairy Products
- 11.1.3. Infant Food
- 11.1.4. Beverages
- 11.1.5. Bakery and Confectionery Products
- 11.1.6. Other End-user Industries
- 11.2. Market Analysis, Insights and Forecast - by Type
- 11.2.1. ISO 22000 - Food Safety Management System
- 11.2.2. BRCGS
- 11.2.3. Halal Certification
- 11.2.4. GMP+/FSA
- 11.2.5. Other Certifications
- 11.1. Market Analysis, Insights and Forecast - by End-user Industry
- 12. North America Food Certification Industry Analysis, Insights and Forecast, 2019-2031
- 12.1. Market Analysis, Insights and Forecast - By Country/Sub-region
- 12.1.1 United States
- 12.1.2 Canada
- 12.1.3 Mexico
- 12.1.4 Rest of North America
- 13. Europe Food Certification Industry Analysis, Insights and Forecast, 2019-2031
- 13.1. Market Analysis, Insights and Forecast - By Country/Sub-region
- 13.1.1 United Kingdom
- 13.1.2 Germany
- 13.1.3 France
- 13.1.4 Russia
- 13.1.5 Italy
- 13.1.6 Spain
- 13.1.7 Rest of Europe
- 14. Asia Pacific Food Certification Industry Analysis, Insights and Forecast, 2019-2031
- 14.1. Market Analysis, Insights and Forecast - By Country/Sub-region
- 14.1.1 India
- 14.1.2 China
- 14.1.3 Japan
- 14.1.4 Australia
- 14.1.5 Rest of Asia Pacific
- 15. South America Food Certification Industry Analysis, Insights and Forecast, 2019-2031
- 15.1. Market Analysis, Insights and Forecast - By Country/Sub-region
- 15.1.1 Brazil
- 15.1.2 Argentina
- 15.1.3 Rest of South America
- 16. MEA Food Certification Industry Analysis, Insights and Forecast, 2019-2031
- 16.1. Market Analysis, Insights and Forecast - By Country/Sub-region
- 16.1.1 Middle East
- 16.1.2 Africa
- 17. Competitive Analysis
- 17.1. Global Market Share Analysis 2024
- 17.2. Company Profiles
- 17.2.1 Intertek Group PLC
- 17.2.1.1. Overview
- 17.2.1.2. Products
- 17.2.1.3. SWOT Analysis
- 17.2.1.4. Recent Developments
- 17.2.1.5. Financials (Based on Availability)
- 17.2.2 Det Norske Veritas Holding AS
- 17.2.2.1. Overview
- 17.2.2.2. Products
- 17.2.2.3. SWOT Analysis
- 17.2.2.4. Recent Developments
- 17.2.2.5. Financials (Based on Availability)
- 17.2.3 NSF International
- 17.2.3.1. Overview
- 17.2.3.2. Products
- 17.2.3.3. SWOT Analysis
- 17.2.3.4. Recent Developments
- 17.2.3.5. Financials (Based on Availability)
- 17.2.4 SCS Global Services
- 17.2.4.1. Overview
- 17.2.4.2. Products
- 17.2.4.3. SWOT Analysis
- 17.2.4.4. Recent Developments
- 17.2.4.5. Financials (Based on Availability)
- 17.2.5 Eurofins Scientific
- 17.2.5.1. Overview
- 17.2.5.2. Products
- 17.2.5.3. SWOT Analysis
- 17.2.5.4. Recent Developments
- 17.2.5.5. Financials (Based on Availability)
- 17.2.6 Compagnie Merieux Alliance SAS (Merieux Nutrisciences)
- 17.2.6.1. Overview
- 17.2.6.2. Products
- 17.2.6.3. SWOT Analysis
- 17.2.6.4. Recent Developments
- 17.2.6.5. Financials (Based on Availability)
- 17.2.7 SGS Group
- 17.2.7.1. Overview
- 17.2.7.2. Products
- 17.2.7.3. SWOT Analysis
- 17.2.7.4. Recent Developments
- 17.2.7.5. Financials (Based on Availability)
- 17.2.8 AsureQuality Limited
- 17.2.8.1. Overview
- 17.2.8.2. Products
- 17.2.8.3. SWOT Analysis
- 17.2.8.4. Recent Developments
- 17.2.8.5. Financials (Based on Availability)
- 17.2.9 Bureau Veritas
- 17.2.9.1. Overview
- 17.2.9.2. Products
- 17.2.9.3. SWOT Analysis
- 17.2.9.4. Recent Developments
- 17.2.9.5. Financials (Based on Availability)
- 17.2.10 TÜV SÜD AG
- 17.2.10.1. Overview
- 17.2.10.2. Products
- 17.2.10.3. SWOT Analysis
- 17.2.10.4. Recent Developments
- 17.2.10.5. Financials (Based on Availability)
- 17.2.1 Intertek Group PLC
List of Figures
- Figure 1: Global Food Certification Industry Revenue Breakdown (Million, %) by Region 2024 & 2032
- Figure 2: North America Food Certification Industry Revenue (Million), by Country 2024 & 2032
- Figure 3: North America Food Certification Industry Revenue Share (%), by Country 2024 & 2032
- Figure 4: Europe Food Certification Industry Revenue (Million), by Country 2024 & 2032
- Figure 5: Europe Food Certification Industry Revenue Share (%), by Country 2024 & 2032
- Figure 6: Asia Pacific Food Certification Industry Revenue (Million), by Country 2024 & 2032
- Figure 7: Asia Pacific Food Certification Industry Revenue Share (%), by Country 2024 & 2032
- Figure 8: South America Food Certification Industry Revenue (Million), by Country 2024 & 2032
- Figure 9: South America Food Certification Industry Revenue Share (%), by Country 2024 & 2032
- Figure 10: MEA Food Certification Industry Revenue (Million), by Country 2024 & 2032
- Figure 11: MEA Food Certification Industry Revenue Share (%), by Country 2024 & 2032
- Figure 12: North America Food Certification Industry Revenue (Million), by End-user Industry 2024 & 2032
- Figure 13: North America Food Certification Industry Revenue Share (%), by End-user Industry 2024 & 2032
- Figure 14: North America Food Certification Industry Revenue (Million), by Type 2024 & 2032
- Figure 15: North America Food Certification Industry Revenue Share (%), by Type 2024 & 2032
- Figure 16: North America Food Certification Industry Revenue (Million), by Country 2024 & 2032
- Figure 17: North America Food Certification Industry Revenue Share (%), by Country 2024 & 2032
- Figure 18: Europe Food Certification Industry Revenue (Million), by End-user Industry 2024 & 2032
- Figure 19: Europe Food Certification Industry Revenue Share (%), by End-user Industry 2024 & 2032
- Figure 20: Europe Food Certification Industry Revenue (Million), by Type 2024 & 2032
- Figure 21: Europe Food Certification Industry Revenue Share (%), by Type 2024 & 2032
- Figure 22: Europe Food Certification Industry Revenue (Million), by Country 2024 & 2032
- Figure 23: Europe Food Certification Industry Revenue Share (%), by Country 2024 & 2032
- Figure 24: Asia Pacific Food Certification Industry Revenue (Million), by End-user Industry 2024 & 2032
- Figure 25: Asia Pacific Food Certification Industry Revenue Share (%), by End-user Industry 2024 & 2032
- Figure 26: Asia Pacific Food Certification Industry Revenue (Million), by Type 2024 & 2032
- Figure 27: Asia Pacific Food Certification Industry Revenue Share (%), by Type 2024 & 2032
- Figure 28: Asia Pacific Food Certification Industry Revenue (Million), by Country 2024 & 2032
- Figure 29: Asia Pacific Food Certification Industry Revenue Share (%), by Country 2024 & 2032
- Figure 30: South America Food Certification Industry Revenue (Million), by End-user Industry 2024 & 2032
- Figure 31: South America Food Certification Industry Revenue Share (%), by End-user Industry 2024 & 2032
- Figure 32: South America Food Certification Industry Revenue (Million), by Type 2024 & 2032
- Figure 33: South America Food Certification Industry Revenue Share (%), by Type 2024 & 2032
- Figure 34: South America Food Certification Industry Revenue (Million), by Country 2024 & 2032
- Figure 35: South America Food Certification Industry Revenue Share (%), by Country 2024 & 2032
- Figure 36: Middle East Food Certification Industry Revenue (Million), by End-user Industry 2024 & 2032
- Figure 37: Middle East Food Certification Industry Revenue Share (%), by End-user Industry 2024 & 2032
- Figure 38: Middle East Food Certification Industry Revenue (Million), by Type 2024 & 2032
- Figure 39: Middle East Food Certification Industry Revenue Share (%), by Type 2024 & 2032
- Figure 40: Middle East Food Certification Industry Revenue (Million), by Country 2024 & 2032
- Figure 41: Middle East Food Certification Industry Revenue Share (%), by Country 2024 & 2032
- Figure 42: South Africa Food Certification Industry Revenue (Million), by End-user Industry 2024 & 2032
- Figure 43: South Africa Food Certification Industry Revenue Share (%), by End-user Industry 2024 & 2032
- Figure 44: South Africa Food Certification Industry Revenue (Million), by Type 2024 & 2032
- Figure 45: South Africa Food Certification Industry Revenue Share (%), by Type 2024 & 2032
- Figure 46: South Africa Food Certification Industry Revenue (Million), by Country 2024 & 2032
- Figure 47: South Africa Food Certification Industry Revenue Share (%), by Country 2024 & 2032
List of Tables
- Table 1: Global Food Certification Industry Revenue Million Forecast, by Region 2019 & 2032
- Table 2: Global Food Certification Industry Revenue Million Forecast, by End-user Industry 2019 & 2032
- Table 3: Global Food Certification Industry Revenue Million Forecast, by Type 2019 & 2032
- Table 4: Global Food Certification Industry Revenue Million Forecast, by Region 2019 & 2032
- Table 5: Global Food Certification Industry Revenue Million Forecast, by Country 2019 & 2032
- Table 6: United States Food Certification Industry Revenue (Million) Forecast, by Application 2019 & 2032
- Table 7: Canada Food Certification Industry Revenue (Million) Forecast, by Application 2019 & 2032
- Table 8: Mexico Food Certification Industry Revenue (Million) Forecast, by Application 2019 & 2032
- Table 9: Rest of North America Food Certification Industry Revenue (Million) Forecast, by Application 2019 & 2032
- Table 10: Global Food Certification Industry Revenue Million Forecast, by Country 2019 & 2032
- Table 11: United Kingdom Food Certification Industry Revenue (Million) Forecast, by Application 2019 & 2032
- Table 12: Germany Food Certification Industry Revenue (Million) Forecast, by Application 2019 & 2032
- Table 13: France Food Certification Industry Revenue (Million) Forecast, by Application 2019 & 2032
- Table 14: Russia Food Certification Industry Revenue (Million) Forecast, by Application 2019 & 2032
- Table 15: Italy Food Certification Industry Revenue (Million) Forecast, by Application 2019 & 2032
- Table 16: Spain Food Certification Industry Revenue (Million) Forecast, by Application 2019 & 2032
- Table 17: Rest of Europe Food Certification Industry Revenue (Million) Forecast, by Application 2019 & 2032
- Table 18: Global Food Certification Industry Revenue Million Forecast, by Country 2019 & 2032
- Table 19: India Food Certification Industry Revenue (Million) Forecast, by Application 2019 & 2032
- Table 20: China Food Certification Industry Revenue (Million) Forecast, by Application 2019 & 2032
- Table 21: Japan Food Certification Industry Revenue (Million) Forecast, by Application 2019 & 2032
- Table 22: Australia Food Certification Industry Revenue (Million) Forecast, by Application 2019 & 2032
- Table 23: Rest of Asia Pacific Food Certification Industry Revenue (Million) Forecast, by Application 2019 & 2032
- Table 24: Global Food Certification Industry Revenue Million Forecast, by Country 2019 & 2032
- Table 25: Brazil Food Certification Industry Revenue (Million) Forecast, by Application 2019 & 2032
- Table 26: Argentina Food Certification Industry Revenue (Million) Forecast, by Application 2019 & 2032
- Table 27: Rest of South America Food Certification Industry Revenue (Million) Forecast, by Application 2019 & 2032
- Table 28: Global Food Certification Industry Revenue Million Forecast, by Country 2019 & 2032
- Table 29: Middle East Food Certification Industry Revenue (Million) Forecast, by Application 2019 & 2032
- Table 30: Africa Food Certification Industry Revenue (Million) Forecast, by Application 2019 & 2032
- Table 31: Global Food Certification Industry Revenue Million Forecast, by End-user Industry 2019 & 2032
- Table 32: Global Food Certification Industry Revenue Million Forecast, by Type 2019 & 2032
- Table 33: Global Food Certification Industry Revenue Million Forecast, by Country 2019 & 2032
- Table 34: United States Food Certification Industry Revenue (Million) Forecast, by Application 2019 & 2032
- Table 35: Canada Food Certification Industry Revenue (Million) Forecast, by Application 2019 & 2032
- Table 36: Mexico Food Certification Industry Revenue (Million) Forecast, by Application 2019 & 2032
- Table 37: Rest of North America Food Certification Industry Revenue (Million) Forecast, by Application 2019 & 2032
- Table 38: Global Food Certification Industry Revenue Million Forecast, by End-user Industry 2019 & 2032
- Table 39: Global Food Certification Industry Revenue Million Forecast, by Type 2019 & 2032
- Table 40: Global Food Certification Industry Revenue Million Forecast, by Country 2019 & 2032
- Table 41: United Kingdom Food Certification Industry Revenue (Million) Forecast, by Application 2019 & 2032
- Table 42: Germany Food Certification Industry Revenue (Million) Forecast, by Application 2019 & 2032
- Table 43: France Food Certification Industry Revenue (Million) Forecast, by Application 2019 & 2032
- Table 44: Russia Food Certification Industry Revenue (Million) Forecast, by Application 2019 & 2032
- Table 45: Italy Food Certification Industry Revenue (Million) Forecast, by Application 2019 & 2032
- Table 46: Spain Food Certification Industry Revenue (Million) Forecast, by Application 2019 & 2032
- Table 47: Rest of Europe Food Certification Industry Revenue (Million) Forecast, by Application 2019 & 2032
- Table 48: Global Food Certification Industry Revenue Million Forecast, by End-user Industry 2019 & 2032
- Table 49: Global Food Certification Industry Revenue Million Forecast, by Type 2019 & 2032
- Table 50: Global Food Certification Industry Revenue Million Forecast, by Country 2019 & 2032
- Table 51: India Food Certification Industry Revenue (Million) Forecast, by Application 2019 & 2032
- Table 52: China Food Certification Industry Revenue (Million) Forecast, by Application 2019 & 2032
- Table 53: Japan Food Certification Industry Revenue (Million) Forecast, by Application 2019 & 2032
- Table 54: Australia Food Certification Industry Revenue (Million) Forecast, by Application 2019 & 2032
- Table 55: Rest of Asia Pacific Food Certification Industry Revenue (Million) Forecast, by Application 2019 & 2032
- Table 56: Global Food Certification Industry Revenue Million Forecast, by End-user Industry 2019 & 2032
- Table 57: Global Food Certification Industry Revenue Million Forecast, by Type 2019 & 2032
- Table 58: Global Food Certification Industry Revenue Million Forecast, by Country 2019 & 2032
- Table 59: Brazil Food Certification Industry Revenue (Million) Forecast, by Application 2019 & 2032
- Table 60: Argentina Food Certification Industry Revenue (Million) Forecast, by Application 2019 & 2032
- Table 61: Rest of South America Food Certification Industry Revenue (Million) Forecast, by Application 2019 & 2032
- Table 62: Global Food Certification Industry Revenue Million Forecast, by End-user Industry 2019 & 2032
- Table 63: Global Food Certification Industry Revenue Million Forecast, by Type 2019 & 2032
- Table 64: Global Food Certification Industry Revenue Million Forecast, by Country 2019 & 2032
- Table 65: Global Food Certification Industry Revenue Million Forecast, by End-user Industry 2019 & 2032
- Table 66: Global Food Certification Industry Revenue Million Forecast, by Type 2019 & 2032
- Table 67: Global Food Certification Industry Revenue Million Forecast, by Country 2019 & 2032
- Table 68: Saudi Arabia Food Certification Industry Revenue (Million) Forecast, by Application 2019 & 2032
- Table 69: Rest of Middle East Food Certification Industry Revenue (Million) Forecast, by Application 2019 & 2032
Frequently Asked Questions
1. What is the projected Compound Annual Growth Rate (CAGR) of the Food Certification Industry?
The projected CAGR is approximately 5.90%.
2. Which companies are prominent players in the Food Certification Industry?
Key companies in the market include Intertek Group PLC, Det Norske Veritas Holding AS, NSF International, SCS Global Services, Eurofins Scientific, Compagnie Merieux Alliance SAS (Merieux Nutrisciences), SGS Group, AsureQuality Limited, Bureau Veritas, TÜV SÜD AG.
3. What are the main segments of the Food Certification Industry?
The market segments include End-user Industry, Type.
4. Can you provide details about the market size?
The market size is estimated to be USD XX Million as of 2022.
5. What are some drivers contributing to market growth?
Growing consumer demand for transparency and quality assurance in food products drives the need for certification.
6. What are the notable trends driving market growth?
Increasing use of technology such as blockchain and digital platforms is enhancing transparency and traceability in the certification process.
7. Are there any restraints impacting market growth?
High Certification Costs.
8. Can you provide examples of recent developments in the market?
In November 2022, SCS Global Services launched its plant-based certification program. The program promotes plant-based alternatives and recognizes innovation in a wide range of consumer products. Food, beverages, CBD, and body care products are all eligible for certification under the SCS-109 Standard. Certification ensures that no animal-derived ingredients are used in the production of the product. Furthermore, products for human and animal consumption must contain at least 95% plant-based ingredients, while other products, such as body care products, must contain at least 50% plant-based ingredients.
9. What pricing options are available for accessing the report?
Pricing options include single-user, multi-user, and enterprise licenses priced at USD 4750, USD 5250, and USD 8750 respectively.
10. Is the market size provided in terms of value or volume?
The market size is provided in terms of value, measured in Million.
11. Are there any specific market keywords associated with the report?
Yes, the market keyword associated with the report is "Food Certification Industry," which aids in identifying and referencing the specific market segment covered.
12. How do I determine which pricing option suits my needs best?
The pricing options vary based on user requirements and access needs. Individual users may opt for single-user licenses, while businesses requiring broader access may choose multi-user or enterprise licenses for cost-effective access to the report.
13. Are there any additional resources or data provided in the Food Certification Industry report?
While the report offers comprehensive insights, it's advisable to review the specific contents or supplementary materials provided to ascertain if additional resources or data are available.
14. How can I stay updated on further developments or reports in the Food Certification Industry?
To stay informed about further developments, trends, and reports in the Food Certification Industry, consider subscribing to industry newsletters, following relevant companies and organizations, or regularly checking reputable industry news sources and publications.
Methodology
Step 1 - Identification of Relevant Samples Size from Population Database


Step 2 - Approaches for Defining Global Market Size (Value, Volume* & Price*)

Note*: In applicable scenarios
Step 3 - Data Sources
Primary Research
- Web Analytics
- Survey Reports
- Research Institute
- Latest Research Reports
- Opinion Leaders
Secondary Research
- Annual Reports
- White Paper
- Latest Press Release
- Industry Association
- Paid Database
- Investor Presentations

Step 4 - Data Triangulation
Involves using different sources of information in order to increase the validity of a study
These sources are likely to be stakeholders in a program - participants, other researchers, program staff, other community members, and so on.
Then we put all data in single framework & apply various statistical tools to find out the dynamic on the market.
During the analysis stage, feedback from the stakeholder groups would be compared to determine areas of agreement as well as areas of divergence
