

Key Insights
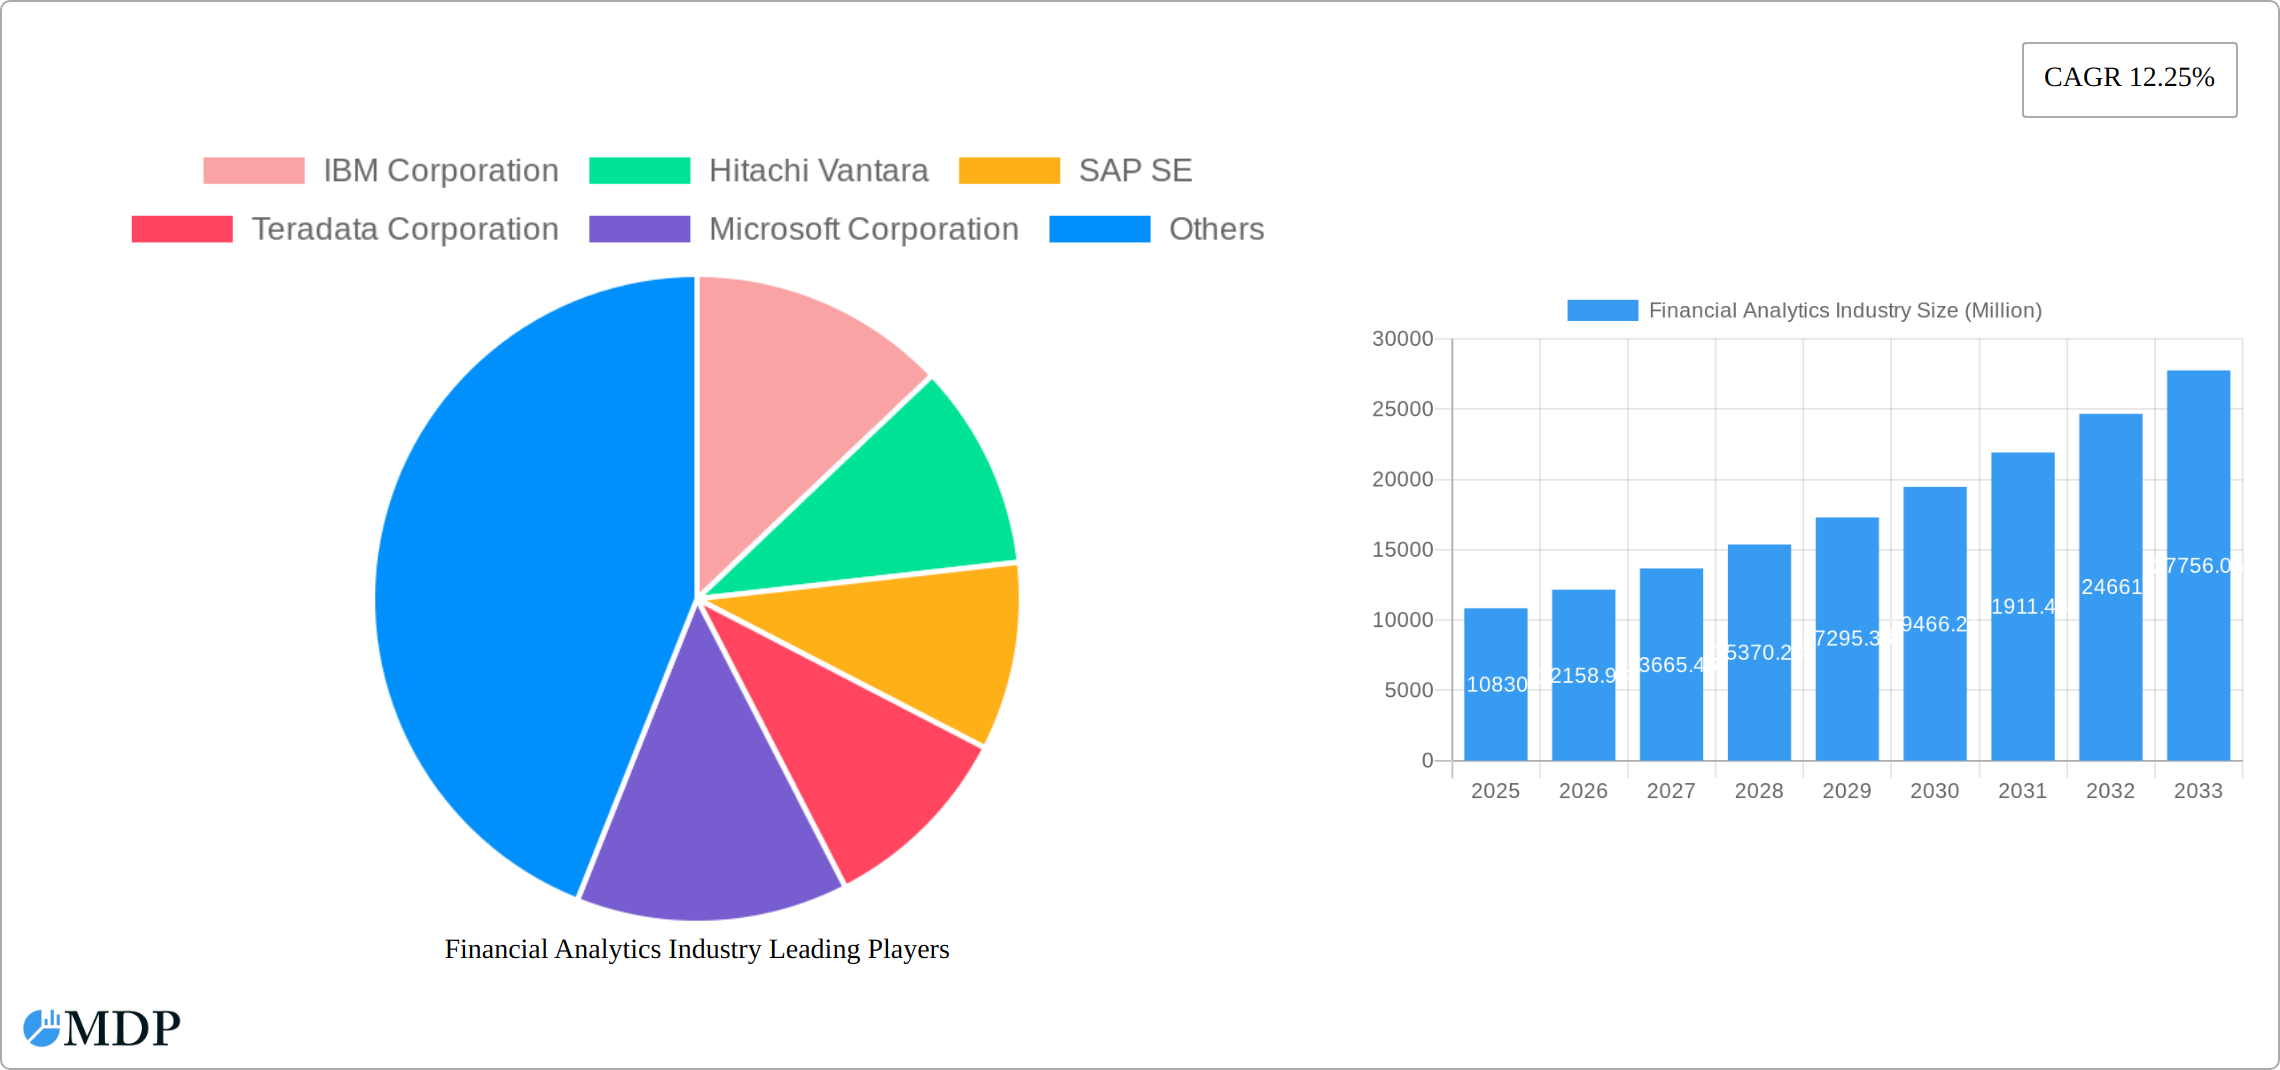
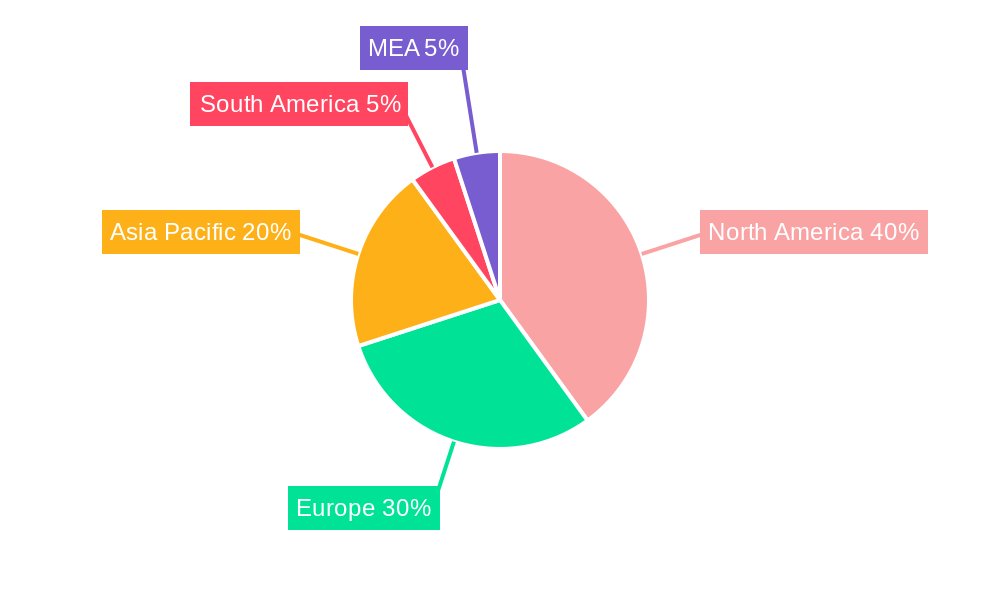
The global financial analytics market, valued at $10.83 billion in 2025, is projected to experience robust growth, driven by a Compound Annual Growth Rate (CAGR) of 12.25% from 2025 to 2033. This expansion is fueled by several key factors. The increasing complexity of financial regulations necessitates sophisticated analytics for compliance and risk management. Furthermore, the burgeoning adoption of cloud-based solutions offers scalability, cost-effectiveness, and enhanced accessibility to powerful analytical tools for financial institutions of all sizes. The rise of big data and advanced analytical techniques like machine learning and artificial intelligence are further propelling market growth, enabling more accurate predictive modeling, fraud detection, and personalized customer experiences. Specific segments exhibiting strong growth include cloud-based deployments, which offer flexibility and agility, and solutions focusing on database management and planning, along with analysis and reporting, which are crucial for strategic decision-making. The BFSI (Banking, Financial Services, and Insurance) sector remains the dominant end-user vertical, followed by healthcare and manufacturing, both increasingly leveraging financial analytics for operational efficiency and strategic planning. Geographic expansion is also noteworthy, with North America currently holding a significant market share but robust growth expected in the Asia-Pacific region driven by increasing digitization and economic development.
The competitive landscape is characterized by established players like IBM, Hitachi Vantara, SAP, Teradata, Microsoft, SAS, Oracle, and FICO, each offering a unique suite of solutions catering to diverse client needs. However, the market also presents opportunities for smaller, specialized firms that can offer innovative solutions and cater to niche market segments. Continued technological advancements, such as the integration of AI and blockchain technologies into financial analytics platforms, will shape the market's trajectory in the coming years. The increasing demand for real-time analytics and improved data security will also influence vendor strategies and product development. Regulatory changes and evolving customer expectations will continue to be key drivers, necessitating adaptable and robust financial analytics solutions.
Financial Analytics Industry: Market Report 2019-2033
This comprehensive report provides a detailed analysis of the Financial Analytics industry, projecting robust growth from 2019-2033. Leveraging extensive research and data, this report offers actionable insights for stakeholders, investors, and industry professionals. The report covers market dynamics, leading players, emerging trends, and future growth opportunities, providing a complete picture of this rapidly evolving sector. The market is expected to reach $XX Million by 2033, exhibiting a CAGR of XX% during the forecast period (2025-2033).
Financial Analytics Industry Market Dynamics & Concentration
The Financial Analytics market is characterized by a moderately concentrated landscape, with key players like IBM, Hitachi Vantara, SAP, Teradata, Microsoft, SAS Institute, Oracle, and FICO holding significant market share. The market share of these top players is estimated to be around XX% in 2025. Innovation is a key driver, with continuous advancements in AI, machine learning, and big data technologies fueling growth. Stringent regulatory frameworks, particularly concerning data privacy (e.g., GDPR, CCPA), significantly impact market operations. Product substitutes, such as simpler spreadsheet-based analysis, exist but are generally less effective for complex financial modeling. End-user trends show a strong preference for cloud-based solutions due to scalability and cost-effectiveness. M&A activity has been steady, with an estimated XX M&A deals in the historical period (2019-2024), indicating consolidation within the industry.
- Market Share Concentration: Top 8 players hold approximately XX% of the market in 2025.
- M&A Activity: Approximately XX deals occurred between 2019 and 2024.
- Regulatory Impact: GDPR and CCPA significantly impact data handling practices.
- Innovation Drivers: AI, machine learning, and big data analytics are driving innovation.
Financial Analytics Industry Industry Trends & Analysis
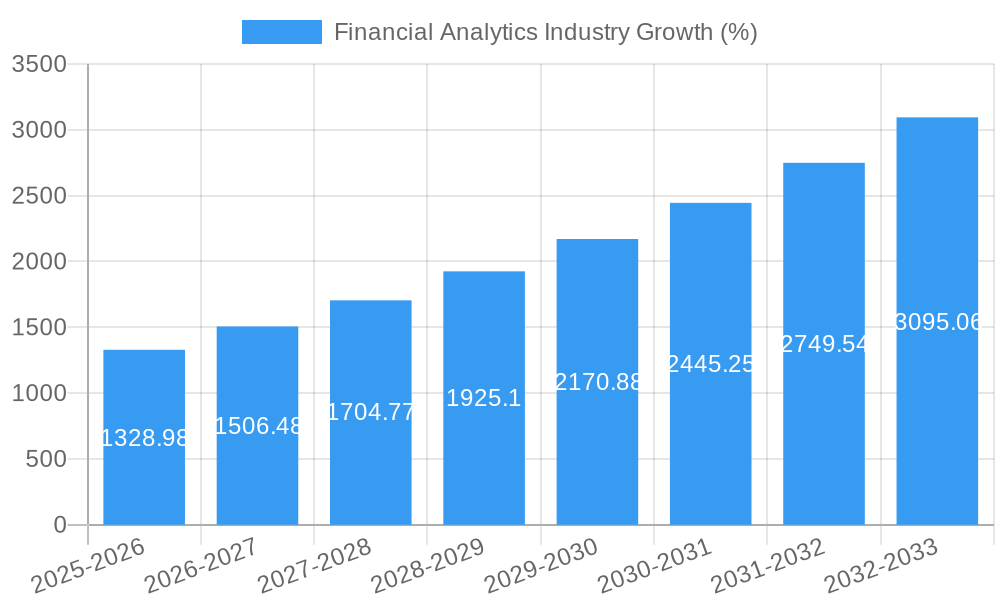
The Financial Analytics market is experiencing significant growth driven by increasing data volumes, the need for improved risk management, and the rising adoption of advanced analytics techniques across various industries. The CAGR for the period 2019-2024 was XX%, and the projected CAGR for 2025-2033 is XX%. Market penetration is high in the BFSI sector but is steadily growing in other verticals such as healthcare and manufacturing. Technological disruptions, such as the rise of cloud computing and AI-powered solutions, are reshaping the competitive landscape. Consumer preferences are shifting towards user-friendly, intuitive platforms with strong data visualization capabilities. Competitive dynamics are characterized by both organic growth through innovation and inorganic growth through mergers and acquisitions. The global market size is estimated to be $XX Million in 2025 and is projected to reach $XX Million by 2033.
Leading Markets & Segments in Financial Analytics Industry
The North American region currently dominates the Financial Analytics market, driven by strong technological advancements, a high concentration of financial institutions, and a favorable regulatory environment. Within segments:
- By Deployment Type: The cloud segment is experiencing the fastest growth due to its scalability and cost-effectiveness. On-premise deployments remain significant, particularly in regulated industries.
- By Solution Type: Analysis and Reporting solutions currently hold the largest market share, reflecting the strong demand for insightful data visualization and business intelligence. Database Management and Planning tools are essential infrastructure components.
- By End-user Vertical: The BFSI (Banking, Financial Services, and Insurance) sector is the largest end-user segment, followed by Healthcare and Government.
Key Drivers:
- North America: Strong technological infrastructure, high adoption rates, and presence of major players.
- BFSI: Stringent regulatory compliance needs, increasing data volume and complexity, and demand for risk mitigation.
- Cloud Deployment: Scalability, cost-efficiency, and accessibility.
- Analysis and Reporting: Growing need for actionable insights and data-driven decision-making.
Financial Analytics Industry Product Developments
Recent product developments focus on integrating AI and machine learning into existing platforms to enhance automation, predictive capabilities, and data interpretation. This includes advanced fraud detection tools, personalized financial planning applications, and real-time risk assessment models. Companies are also emphasizing user experience improvements, with more intuitive interfaces and enhanced data visualization tools. These developments aim to address growing market demands for efficiency, accuracy, and actionable insights.
Key Drivers of Financial Analytics Industry Growth
Several factors drive market growth. Technological advancements, particularly in AI and big data analytics, enable more sophisticated data processing and analysis. Economic growth increases investment in financial technology and data-driven decision-making. Furthermore, stringent regulatory requirements for risk management and compliance encourage the adoption of robust financial analytics solutions. The need for improved operational efficiency and the demand for predictive insights fuel ongoing market expansion.
Challenges in the Financial Analytics Industry Market
The industry faces challenges, including the high cost of implementation and maintenance of advanced analytics platforms, the complexity of integrating disparate data sources, the need for skilled professionals to manage these systems and interpret results, and the growing concern over data privacy and security. These factors can significantly impact the affordability and adoption of financial analytics solutions.
Emerging Opportunities in Financial Analytics Industry
The convergence of financial technology (FinTech) and financial analytics presents significant opportunities. The emergence of open finance initiatives is creating new avenues for data-driven innovation. Strategic partnerships between technology providers and financial institutions are facilitating the development of innovative solutions. Expanding into underserved markets and integrating new data sources such as social media and IoT data can lead to further growth.
Leading Players in the Financial Analytics Industry Sector
- IBM Corporation
- Hitachi Vantara
- SAP SE
- Teradata Corporation
- Microsoft Corporation
- SAS Institute
- Oracle Corporation
- FICO
Key Milestones in Financial Analytics Industry Industry
- July 2023: Dobin, an AI-powered FinTech solution, launched in Southeast Asia, leveraging open finance and advanced data analytics. This highlights the growing adoption of AI in the financial sector and the potential of open finance data.
Strategic Outlook for Financial Analytics Industry Market
The Financial Analytics market is poised for continued growth, driven by technological advancements, increasing data volumes, and evolving regulatory landscapes. Strategic opportunities lie in developing innovative solutions that address specific industry needs, focusing on AI-powered insights, enhanced data security, and user-friendly interfaces. Companies that effectively leverage these opportunities will be well-positioned for success in this dynamic market.
Financial Analytics Industry Segmentation
-
1. Deployment Type
- 1.1. On-premise
- 1.2. Cloud
-
2. Solution Type
- 2.1. Database Management and Planning
- 2.2. Analysis and Reporting
- 2.3. Other Type
-
3. End-user Vertical
- 3.1. BFSI
- 3.2. Healthcare
- 3.3. Manufacturing
- 3.4. Government
- 3.5. IT and Telecom
- 3.6. Other End-user Verticals
Financial Analytics Industry Segmentation By Geography
-
1. North America
- 1.1. United States
- 1.2. Canada
-
2. Europe
- 2.1. United Kingdom
- 2.2. Germany
- 2.3. France
- 2.4. Rest of Europe
-
3. Asia Pacific
- 3.1. China
- 3.2. Japan
- 3.3. Singapore
- 3.4. India
- 3.5. South Korea
- 3.6. Rest of Asia Pacific
-
4. Latin America
- 4.1. Mexico
- 4.2. Brazil
- 4.3. Rest of Latin America
-
5. Middle East and Africa
- 5.1. United Arab Emirates
- 5.2. South Africa
- 5.3. Rest of Middle East and Africa
Financial Analytics Industry REPORT HIGHLIGHTS
| Aspects | Details |
|---|---|
| Study Period | 2019-2033 |
| Base Year | 2024 |
| Estimated Year | 2025 |
| Forecast Period | 2025-2033 |
| Historical Period | 2019-2024 |
| Growth Rate | CAGR of 12.25% from 2019-2033 |
| Segmentation |
|
Table of Contents
- 1. Introduction
- 1.1. Research Scope
- 1.2. Market Segmentation
- 1.3. Research Methodology
- 1.4. Definitions and Assumptions
- 2. Executive Summary
- 2.1. Introduction
- 3. Market Dynamics
- 3.1. Introduction
- 3.2. Market Drivers
- 3.2.1. Advancement in BI and Business Analytics Tools; Growing Focus on Data Driven Financial Decisions in End Users
- 3.3. Market Restrains
- 3.3.1. Lack of Awareness Regarding Fraud Detection Solutions
- 3.4. Market Trends
- 3.4.1. Cloud Based Solutions are Expected to Gain Significant Traction
- 4. Market Factor Analysis
- 4.1. Porters Five Forces
- 4.2. Supply/Value Chain
- 4.3. PESTEL analysis
- 4.4. Market Entropy
- 4.5. Patent/Trademark Analysis
- 5. Global Financial Analytics Industry Analysis, Insights and Forecast, 2019-2031
- 5.1. Market Analysis, Insights and Forecast - by Deployment Type
- 5.1.1. On-premise
- 5.1.2. Cloud
- 5.2. Market Analysis, Insights and Forecast - by Solution Type
- 5.2.1. Database Management and Planning
- 5.2.2. Analysis and Reporting
- 5.2.3. Other Type
- 5.3. Market Analysis, Insights and Forecast - by End-user Vertical
- 5.3.1. BFSI
- 5.3.2. Healthcare
- 5.3.3. Manufacturing
- 5.3.4. Government
- 5.3.5. IT and Telecom
- 5.3.6. Other End-user Verticals
- 5.4. Market Analysis, Insights and Forecast - by Region
- 5.4.1. North America
- 5.4.2. Europe
- 5.4.3. Asia Pacific
- 5.4.4. Latin America
- 5.4.5. Middle East and Africa
- 5.1. Market Analysis, Insights and Forecast - by Deployment Type
- 6. North America Financial Analytics Industry Analysis, Insights and Forecast, 2019-2031
- 6.1. Market Analysis, Insights and Forecast - by Deployment Type
- 6.1.1. On-premise
- 6.1.2. Cloud
- 6.2. Market Analysis, Insights and Forecast - by Solution Type
- 6.2.1. Database Management and Planning
- 6.2.2. Analysis and Reporting
- 6.2.3. Other Type
- 6.3. Market Analysis, Insights and Forecast - by End-user Vertical
- 6.3.1. BFSI
- 6.3.2. Healthcare
- 6.3.3. Manufacturing
- 6.3.4. Government
- 6.3.5. IT and Telecom
- 6.3.6. Other End-user Verticals
- 6.1. Market Analysis, Insights and Forecast - by Deployment Type
- 7. Europe Financial Analytics Industry Analysis, Insights and Forecast, 2019-2031
- 7.1. Market Analysis, Insights and Forecast - by Deployment Type
- 7.1.1. On-premise
- 7.1.2. Cloud
- 7.2. Market Analysis, Insights and Forecast - by Solution Type
- 7.2.1. Database Management and Planning
- 7.2.2. Analysis and Reporting
- 7.2.3. Other Type
- 7.3. Market Analysis, Insights and Forecast - by End-user Vertical
- 7.3.1. BFSI
- 7.3.2. Healthcare
- 7.3.3. Manufacturing
- 7.3.4. Government
- 7.3.5. IT and Telecom
- 7.3.6. Other End-user Verticals
- 7.1. Market Analysis, Insights and Forecast - by Deployment Type
- 8. Asia Pacific Financial Analytics Industry Analysis, Insights and Forecast, 2019-2031
- 8.1. Market Analysis, Insights and Forecast - by Deployment Type
- 8.1.1. On-premise
- 8.1.2. Cloud
- 8.2. Market Analysis, Insights and Forecast - by Solution Type
- 8.2.1. Database Management and Planning
- 8.2.2. Analysis and Reporting
- 8.2.3. Other Type
- 8.3. Market Analysis, Insights and Forecast - by End-user Vertical
- 8.3.1. BFSI
- 8.3.2. Healthcare
- 8.3.3. Manufacturing
- 8.3.4. Government
- 8.3.5. IT and Telecom
- 8.3.6. Other End-user Verticals
- 8.1. Market Analysis, Insights and Forecast - by Deployment Type
- 9. Latin America Financial Analytics Industry Analysis, Insights and Forecast, 2019-2031
- 9.1. Market Analysis, Insights and Forecast - by Deployment Type
- 9.1.1. On-premise
- 9.1.2. Cloud
- 9.2. Market Analysis, Insights and Forecast - by Solution Type
- 9.2.1. Database Management and Planning
- 9.2.2. Analysis and Reporting
- 9.2.3. Other Type
- 9.3. Market Analysis, Insights and Forecast - by End-user Vertical
- 9.3.1. BFSI
- 9.3.2. Healthcare
- 9.3.3. Manufacturing
- 9.3.4. Government
- 9.3.5. IT and Telecom
- 9.3.6. Other End-user Verticals
- 9.1. Market Analysis, Insights and Forecast - by Deployment Type
- 10. Middle East and Africa Financial Analytics Industry Analysis, Insights and Forecast, 2019-2031
- 10.1. Market Analysis, Insights and Forecast - by Deployment Type
- 10.1.1. On-premise
- 10.1.2. Cloud
- 10.2. Market Analysis, Insights and Forecast - by Solution Type
- 10.2.1. Database Management and Planning
- 10.2.2. Analysis and Reporting
- 10.2.3. Other Type
- 10.3. Market Analysis, Insights and Forecast - by End-user Vertical
- 10.3.1. BFSI
- 10.3.2. Healthcare
- 10.3.3. Manufacturing
- 10.3.4. Government
- 10.3.5. IT and Telecom
- 10.3.6. Other End-user Verticals
- 10.1. Market Analysis, Insights and Forecast - by Deployment Type
- 11. North America Financial Analytics Industry Analysis, Insights and Forecast, 2019-2031
- 11.1. Market Analysis, Insights and Forecast - By Country/Sub-region
- 11.1.1 United States
- 11.1.2 Canada
- 11.1.3 Mexico
- 12. Europe Financial Analytics Industry Analysis, Insights and Forecast, 2019-2031
- 12.1. Market Analysis, Insights and Forecast - By Country/Sub-region
- 12.1.1 Germany
- 12.1.2 United Kingdom
- 12.1.3 France
- 12.1.4 Spain
- 12.1.5 Italy
- 12.1.6 Spain
- 12.1.7 Belgium
- 12.1.8 Netherland
- 12.1.9 Nordics
- 12.1.10 Rest of Europe
- 13. Asia Pacific Financial Analytics Industry Analysis, Insights and Forecast, 2019-2031
- 13.1. Market Analysis, Insights and Forecast - By Country/Sub-region
- 13.1.1 China
- 13.1.2 Japan
- 13.1.3 India
- 13.1.4 South Korea
- 13.1.5 Southeast Asia
- 13.1.6 Australia
- 13.1.7 Indonesia
- 13.1.8 Phillipes
- 13.1.9 Singapore
- 13.1.10 Thailandc
- 13.1.11 Rest of Asia Pacific
- 14. South America Financial Analytics Industry Analysis, Insights and Forecast, 2019-2031
- 14.1. Market Analysis, Insights and Forecast - By Country/Sub-region
- 14.1.1 Brazil
- 14.1.2 Argentina
- 14.1.3 Peru
- 14.1.4 Chile
- 14.1.5 Colombia
- 14.1.6 Ecuador
- 14.1.7 Venezuela
- 14.1.8 Rest of South America
- 15. North America Financial Analytics Industry Analysis, Insights and Forecast, 2019-2031
- 15.1. Market Analysis, Insights and Forecast - By Country/Sub-region
- 15.1.1 United States
- 15.1.2 Canada
- 15.1.3 Mexico
- 16. MEA Financial Analytics Industry Analysis, Insights and Forecast, 2019-2031
- 16.1. Market Analysis, Insights and Forecast - By Country/Sub-region
- 16.1.1 United Arab Emirates
- 16.1.2 Saudi Arabia
- 16.1.3 South Africa
- 16.1.4 Rest of Middle East and Africa
- 17. Competitive Analysis
- 17.1. Global Market Share Analysis 2024
- 17.2. Company Profiles
- 17.2.1 IBM Corporation
- 17.2.1.1. Overview
- 17.2.1.2. Products
- 17.2.1.3. SWOT Analysis
- 17.2.1.4. Recent Developments
- 17.2.1.5. Financials (Based on Availability)
- 17.2.2 Hitachi Vantara
- 17.2.2.1. Overview
- 17.2.2.2. Products
- 17.2.2.3. SWOT Analysis
- 17.2.2.4. Recent Developments
- 17.2.2.5. Financials (Based on Availability)
- 17.2.3 SAP SE
- 17.2.3.1. Overview
- 17.2.3.2. Products
- 17.2.3.3. SWOT Analysis
- 17.2.3.4. Recent Developments
- 17.2.3.5. Financials (Based on Availability)
- 17.2.4 Teradata Corporation
- 17.2.4.1. Overview
- 17.2.4.2. Products
- 17.2.4.3. SWOT Analysis
- 17.2.4.4. Recent Developments
- 17.2.4.5. Financials (Based on Availability)
- 17.2.5 Microsoft Corporation
- 17.2.5.1. Overview
- 17.2.5.2. Products
- 17.2.5.3. SWOT Analysis
- 17.2.5.4. Recent Developments
- 17.2.5.5. Financials (Based on Availability)
- 17.2.6 SAS Institute
- 17.2.6.1. Overview
- 17.2.6.2. Products
- 17.2.6.3. SWOT Analysis
- 17.2.6.4. Recent Developments
- 17.2.6.5. Financials (Based on Availability)
- 17.2.7 Oracle Corporation
- 17.2.7.1. Overview
- 17.2.7.2. Products
- 17.2.7.3. SWOT Analysis
- 17.2.7.4. Recent Developments
- 17.2.7.5. Financials (Based on Availability)
- 17.2.8 FICO
- 17.2.8.1. Overview
- 17.2.8.2. Products
- 17.2.8.3. SWOT Analysis
- 17.2.8.4. Recent Developments
- 17.2.8.5. Financials (Based on Availability)
- 17.2.1 IBM Corporation
List of Figures
- Figure 1: Global Financial Analytics Industry Revenue Breakdown (Million, %) by Region 2024 & 2032
- Figure 2: North America Financial Analytics Industry Revenue (Million), by Country 2024 & 2032
- Figure 3: North America Financial Analytics Industry Revenue Share (%), by Country 2024 & 2032
- Figure 4: Europe Financial Analytics Industry Revenue (Million), by Country 2024 & 2032
- Figure 5: Europe Financial Analytics Industry Revenue Share (%), by Country 2024 & 2032
- Figure 6: Asia Pacific Financial Analytics Industry Revenue (Million), by Country 2024 & 2032
- Figure 7: Asia Pacific Financial Analytics Industry Revenue Share (%), by Country 2024 & 2032
- Figure 8: South America Financial Analytics Industry Revenue (Million), by Country 2024 & 2032
- Figure 9: South America Financial Analytics Industry Revenue Share (%), by Country 2024 & 2032
- Figure 10: North America Financial Analytics Industry Revenue (Million), by Country 2024 & 2032
- Figure 11: North America Financial Analytics Industry Revenue Share (%), by Country 2024 & 2032
- Figure 12: MEA Financial Analytics Industry Revenue (Million), by Country 2024 & 2032
- Figure 13: MEA Financial Analytics Industry Revenue Share (%), by Country 2024 & 2032
- Figure 14: North America Financial Analytics Industry Revenue (Million), by Deployment Type 2024 & 2032
- Figure 15: North America Financial Analytics Industry Revenue Share (%), by Deployment Type 2024 & 2032
- Figure 16: North America Financial Analytics Industry Revenue (Million), by Solution Type 2024 & 2032
- Figure 17: North America Financial Analytics Industry Revenue Share (%), by Solution Type 2024 & 2032
- Figure 18: North America Financial Analytics Industry Revenue (Million), by End-user Vertical 2024 & 2032
- Figure 19: North America Financial Analytics Industry Revenue Share (%), by End-user Vertical 2024 & 2032
- Figure 20: North America Financial Analytics Industry Revenue (Million), by Country 2024 & 2032
- Figure 21: North America Financial Analytics Industry Revenue Share (%), by Country 2024 & 2032
- Figure 22: Europe Financial Analytics Industry Revenue (Million), by Deployment Type 2024 & 2032
- Figure 23: Europe Financial Analytics Industry Revenue Share (%), by Deployment Type 2024 & 2032
- Figure 24: Europe Financial Analytics Industry Revenue (Million), by Solution Type 2024 & 2032
- Figure 25: Europe Financial Analytics Industry Revenue Share (%), by Solution Type 2024 & 2032
- Figure 26: Europe Financial Analytics Industry Revenue (Million), by End-user Vertical 2024 & 2032
- Figure 27: Europe Financial Analytics Industry Revenue Share (%), by End-user Vertical 2024 & 2032
- Figure 28: Europe Financial Analytics Industry Revenue (Million), by Country 2024 & 2032
- Figure 29: Europe Financial Analytics Industry Revenue Share (%), by Country 2024 & 2032
- Figure 30: Asia Pacific Financial Analytics Industry Revenue (Million), by Deployment Type 2024 & 2032
- Figure 31: Asia Pacific Financial Analytics Industry Revenue Share (%), by Deployment Type 2024 & 2032
- Figure 32: Asia Pacific Financial Analytics Industry Revenue (Million), by Solution Type 2024 & 2032
- Figure 33: Asia Pacific Financial Analytics Industry Revenue Share (%), by Solution Type 2024 & 2032
- Figure 34: Asia Pacific Financial Analytics Industry Revenue (Million), by End-user Vertical 2024 & 2032
- Figure 35: Asia Pacific Financial Analytics Industry Revenue Share (%), by End-user Vertical 2024 & 2032
- Figure 36: Asia Pacific Financial Analytics Industry Revenue (Million), by Country 2024 & 2032
- Figure 37: Asia Pacific Financial Analytics Industry Revenue Share (%), by Country 2024 & 2032
- Figure 38: Latin America Financial Analytics Industry Revenue (Million), by Deployment Type 2024 & 2032
- Figure 39: Latin America Financial Analytics Industry Revenue Share (%), by Deployment Type 2024 & 2032
- Figure 40: Latin America Financial Analytics Industry Revenue (Million), by Solution Type 2024 & 2032
- Figure 41: Latin America Financial Analytics Industry Revenue Share (%), by Solution Type 2024 & 2032
- Figure 42: Latin America Financial Analytics Industry Revenue (Million), by End-user Vertical 2024 & 2032
- Figure 43: Latin America Financial Analytics Industry Revenue Share (%), by End-user Vertical 2024 & 2032
- Figure 44: Latin America Financial Analytics Industry Revenue (Million), by Country 2024 & 2032
- Figure 45: Latin America Financial Analytics Industry Revenue Share (%), by Country 2024 & 2032
- Figure 46: Middle East and Africa Financial Analytics Industry Revenue (Million), by Deployment Type 2024 & 2032
- Figure 47: Middle East and Africa Financial Analytics Industry Revenue Share (%), by Deployment Type 2024 & 2032
- Figure 48: Middle East and Africa Financial Analytics Industry Revenue (Million), by Solution Type 2024 & 2032
- Figure 49: Middle East and Africa Financial Analytics Industry Revenue Share (%), by Solution Type 2024 & 2032
- Figure 50: Middle East and Africa Financial Analytics Industry Revenue (Million), by End-user Vertical 2024 & 2032
- Figure 51: Middle East and Africa Financial Analytics Industry Revenue Share (%), by End-user Vertical 2024 & 2032
- Figure 52: Middle East and Africa Financial Analytics Industry Revenue (Million), by Country 2024 & 2032
- Figure 53: Middle East and Africa Financial Analytics Industry Revenue Share (%), by Country 2024 & 2032
List of Tables
- Table 1: Global Financial Analytics Industry Revenue Million Forecast, by Region 2019 & 2032
- Table 2: Global Financial Analytics Industry Revenue Million Forecast, by Deployment Type 2019 & 2032
- Table 3: Global Financial Analytics Industry Revenue Million Forecast, by Solution Type 2019 & 2032
- Table 4: Global Financial Analytics Industry Revenue Million Forecast, by End-user Vertical 2019 & 2032
- Table 5: Global Financial Analytics Industry Revenue Million Forecast, by Region 2019 & 2032
- Table 6: Global Financial Analytics Industry Revenue Million Forecast, by Country 2019 & 2032
- Table 7: United States Financial Analytics Industry Revenue (Million) Forecast, by Application 2019 & 2032
- Table 8: Canada Financial Analytics Industry Revenue (Million) Forecast, by Application 2019 & 2032
- Table 9: Mexico Financial Analytics Industry Revenue (Million) Forecast, by Application 2019 & 2032
- Table 10: Global Financial Analytics Industry Revenue Million Forecast, by Country 2019 & 2032
- Table 11: Germany Financial Analytics Industry Revenue (Million) Forecast, by Application 2019 & 2032
- Table 12: United Kingdom Financial Analytics Industry Revenue (Million) Forecast, by Application 2019 & 2032
- Table 13: France Financial Analytics Industry Revenue (Million) Forecast, by Application 2019 & 2032
- Table 14: Spain Financial Analytics Industry Revenue (Million) Forecast, by Application 2019 & 2032
- Table 15: Italy Financial Analytics Industry Revenue (Million) Forecast, by Application 2019 & 2032
- Table 16: Spain Financial Analytics Industry Revenue (Million) Forecast, by Application 2019 & 2032
- Table 17: Belgium Financial Analytics Industry Revenue (Million) Forecast, by Application 2019 & 2032
- Table 18: Netherland Financial Analytics Industry Revenue (Million) Forecast, by Application 2019 & 2032
- Table 19: Nordics Financial Analytics Industry Revenue (Million) Forecast, by Application 2019 & 2032
- Table 20: Rest of Europe Financial Analytics Industry Revenue (Million) Forecast, by Application 2019 & 2032
- Table 21: Global Financial Analytics Industry Revenue Million Forecast, by Country 2019 & 2032
- Table 22: China Financial Analytics Industry Revenue (Million) Forecast, by Application 2019 & 2032
- Table 23: Japan Financial Analytics Industry Revenue (Million) Forecast, by Application 2019 & 2032
- Table 24: India Financial Analytics Industry Revenue (Million) Forecast, by Application 2019 & 2032
- Table 25: South Korea Financial Analytics Industry Revenue (Million) Forecast, by Application 2019 & 2032
- Table 26: Southeast Asia Financial Analytics Industry Revenue (Million) Forecast, by Application 2019 & 2032
- Table 27: Australia Financial Analytics Industry Revenue (Million) Forecast, by Application 2019 & 2032
- Table 28: Indonesia Financial Analytics Industry Revenue (Million) Forecast, by Application 2019 & 2032
- Table 29: Phillipes Financial Analytics Industry Revenue (Million) Forecast, by Application 2019 & 2032
- Table 30: Singapore Financial Analytics Industry Revenue (Million) Forecast, by Application 2019 & 2032
- Table 31: Thailandc Financial Analytics Industry Revenue (Million) Forecast, by Application 2019 & 2032
- Table 32: Rest of Asia Pacific Financial Analytics Industry Revenue (Million) Forecast, by Application 2019 & 2032
- Table 33: Global Financial Analytics Industry Revenue Million Forecast, by Country 2019 & 2032
- Table 34: Brazil Financial Analytics Industry Revenue (Million) Forecast, by Application 2019 & 2032
- Table 35: Argentina Financial Analytics Industry Revenue (Million) Forecast, by Application 2019 & 2032
- Table 36: Peru Financial Analytics Industry Revenue (Million) Forecast, by Application 2019 & 2032
- Table 37: Chile Financial Analytics Industry Revenue (Million) Forecast, by Application 2019 & 2032
- Table 38: Colombia Financial Analytics Industry Revenue (Million) Forecast, by Application 2019 & 2032
- Table 39: Ecuador Financial Analytics Industry Revenue (Million) Forecast, by Application 2019 & 2032
- Table 40: Venezuela Financial Analytics Industry Revenue (Million) Forecast, by Application 2019 & 2032
- Table 41: Rest of South America Financial Analytics Industry Revenue (Million) Forecast, by Application 2019 & 2032
- Table 42: Global Financial Analytics Industry Revenue Million Forecast, by Country 2019 & 2032
- Table 43: United States Financial Analytics Industry Revenue (Million) Forecast, by Application 2019 & 2032
- Table 44: Canada Financial Analytics Industry Revenue (Million) Forecast, by Application 2019 & 2032
- Table 45: Mexico Financial Analytics Industry Revenue (Million) Forecast, by Application 2019 & 2032
- Table 46: Global Financial Analytics Industry Revenue Million Forecast, by Country 2019 & 2032
- Table 47: United Arab Emirates Financial Analytics Industry Revenue (Million) Forecast, by Application 2019 & 2032
- Table 48: Saudi Arabia Financial Analytics Industry Revenue (Million) Forecast, by Application 2019 & 2032
- Table 49: South Africa Financial Analytics Industry Revenue (Million) Forecast, by Application 2019 & 2032
- Table 50: Rest of Middle East and Africa Financial Analytics Industry Revenue (Million) Forecast, by Application 2019 & 2032
- Table 51: Global Financial Analytics Industry Revenue Million Forecast, by Deployment Type 2019 & 2032
- Table 52: Global Financial Analytics Industry Revenue Million Forecast, by Solution Type 2019 & 2032
- Table 53: Global Financial Analytics Industry Revenue Million Forecast, by End-user Vertical 2019 & 2032
- Table 54: Global Financial Analytics Industry Revenue Million Forecast, by Country 2019 & 2032
- Table 55: United States Financial Analytics Industry Revenue (Million) Forecast, by Application 2019 & 2032
- Table 56: Canada Financial Analytics Industry Revenue (Million) Forecast, by Application 2019 & 2032
- Table 57: Global Financial Analytics Industry Revenue Million Forecast, by Deployment Type 2019 & 2032
- Table 58: Global Financial Analytics Industry Revenue Million Forecast, by Solution Type 2019 & 2032
- Table 59: Global Financial Analytics Industry Revenue Million Forecast, by End-user Vertical 2019 & 2032
- Table 60: Global Financial Analytics Industry Revenue Million Forecast, by Country 2019 & 2032
- Table 61: United Kingdom Financial Analytics Industry Revenue (Million) Forecast, by Application 2019 & 2032
- Table 62: Germany Financial Analytics Industry Revenue (Million) Forecast, by Application 2019 & 2032
- Table 63: France Financial Analytics Industry Revenue (Million) Forecast, by Application 2019 & 2032
- Table 64: Rest of Europe Financial Analytics Industry Revenue (Million) Forecast, by Application 2019 & 2032
- Table 65: Global Financial Analytics Industry Revenue Million Forecast, by Deployment Type 2019 & 2032
- Table 66: Global Financial Analytics Industry Revenue Million Forecast, by Solution Type 2019 & 2032
- Table 67: Global Financial Analytics Industry Revenue Million Forecast, by End-user Vertical 2019 & 2032
- Table 68: Global Financial Analytics Industry Revenue Million Forecast, by Country 2019 & 2032
- Table 69: China Financial Analytics Industry Revenue (Million) Forecast, by Application 2019 & 2032
- Table 70: Japan Financial Analytics Industry Revenue (Million) Forecast, by Application 2019 & 2032
- Table 71: Singapore Financial Analytics Industry Revenue (Million) Forecast, by Application 2019 & 2032
- Table 72: India Financial Analytics Industry Revenue (Million) Forecast, by Application 2019 & 2032
- Table 73: South Korea Financial Analytics Industry Revenue (Million) Forecast, by Application 2019 & 2032
- Table 74: Rest of Asia Pacific Financial Analytics Industry Revenue (Million) Forecast, by Application 2019 & 2032
- Table 75: Global Financial Analytics Industry Revenue Million Forecast, by Deployment Type 2019 & 2032
- Table 76: Global Financial Analytics Industry Revenue Million Forecast, by Solution Type 2019 & 2032
- Table 77: Global Financial Analytics Industry Revenue Million Forecast, by End-user Vertical 2019 & 2032
- Table 78: Global Financial Analytics Industry Revenue Million Forecast, by Country 2019 & 2032
- Table 79: Mexico Financial Analytics Industry Revenue (Million) Forecast, by Application 2019 & 2032
- Table 80: Brazil Financial Analytics Industry Revenue (Million) Forecast, by Application 2019 & 2032
- Table 81: Rest of Latin America Financial Analytics Industry Revenue (Million) Forecast, by Application 2019 & 2032
- Table 82: Global Financial Analytics Industry Revenue Million Forecast, by Deployment Type 2019 & 2032
- Table 83: Global Financial Analytics Industry Revenue Million Forecast, by Solution Type 2019 & 2032
- Table 84: Global Financial Analytics Industry Revenue Million Forecast, by End-user Vertical 2019 & 2032
- Table 85: Global Financial Analytics Industry Revenue Million Forecast, by Country 2019 & 2032
- Table 86: United Arab Emirates Financial Analytics Industry Revenue (Million) Forecast, by Application 2019 & 2032
- Table 87: South Africa Financial Analytics Industry Revenue (Million) Forecast, by Application 2019 & 2032
- Table 88: Rest of Middle East and Africa Financial Analytics Industry Revenue (Million) Forecast, by Application 2019 & 2032
Frequently Asked Questions
1. What is the projected Compound Annual Growth Rate (CAGR) of the Financial Analytics Industry?
The projected CAGR is approximately 12.25%.
2. Which companies are prominent players in the Financial Analytics Industry?
Key companies in the market include IBM Corporation, Hitachi Vantara, SAP SE, Teradata Corporation, Microsoft Corporation, SAS Institute, Oracle Corporation, FICO.
3. What are the main segments of the Financial Analytics Industry?
The market segments include Deployment Type, Solution Type, End-user Vertical.
4. Can you provide details about the market size?
The market size is estimated to be USD 10.83 Million as of 2022.
5. What are some drivers contributing to market growth?
Advancement in BI and Business Analytics Tools; Growing Focus on Data Driven Financial Decisions in End Users.
6. What are the notable trends driving market growth?
Cloud Based Solutions are Expected to Gain Significant Traction.
7. Are there any restraints impacting market growth?
Lack of Awareness Regarding Fraud Detection Solutions.
8. Can you provide examples of recent developments in the market?
July 2023 - Dobin, an AI-powered FinTech solution, announced its launch. Dobin is the first Southeast Asian company to use open finance and advanced data analytics to give users a single view of their finances, create unique anonymized customer insights, and empower users to get value from their financial data.
9. What pricing options are available for accessing the report?
Pricing options include single-user, multi-user, and enterprise licenses priced at USD 4750, USD 5250, and USD 8750 respectively.
10. Is the market size provided in terms of value or volume?
The market size is provided in terms of value, measured in Million.
11. Are there any specific market keywords associated with the report?
Yes, the market keyword associated with the report is "Financial Analytics Industry," which aids in identifying and referencing the specific market segment covered.
12. How do I determine which pricing option suits my needs best?
The pricing options vary based on user requirements and access needs. Individual users may opt for single-user licenses, while businesses requiring broader access may choose multi-user or enterprise licenses for cost-effective access to the report.
13. Are there any additional resources or data provided in the Financial Analytics Industry report?
While the report offers comprehensive insights, it's advisable to review the specific contents or supplementary materials provided to ascertain if additional resources or data are available.
14. How can I stay updated on further developments or reports in the Financial Analytics Industry?
To stay informed about further developments, trends, and reports in the Financial Analytics Industry, consider subscribing to industry newsletters, following relevant companies and organizations, or regularly checking reputable industry news sources and publications.
Methodology
Step 1 - Identification of Relevant Samples Size from Population Database


Step 2 - Approaches for Defining Global Market Size (Value, Volume* & Price*)

Note*: In applicable scenarios
Step 3 - Data Sources
Primary Research
- Web Analytics
- Survey Reports
- Research Institute
- Latest Research Reports
- Opinion Leaders
Secondary Research
- Annual Reports
- White Paper
- Latest Press Release
- Industry Association
- Paid Database
- Investor Presentations

Step 4 - Data Triangulation
Involves using different sources of information in order to increase the validity of a study
These sources are likely to be stakeholders in a program - participants, other researchers, program staff, other community members, and so on.
Then we put all data in single framework & apply various statistical tools to find out the dynamic on the market.
During the analysis stage, feedback from the stakeholder groups would be compared to determine areas of agreement as well as areas of divergence
