

Key Insights
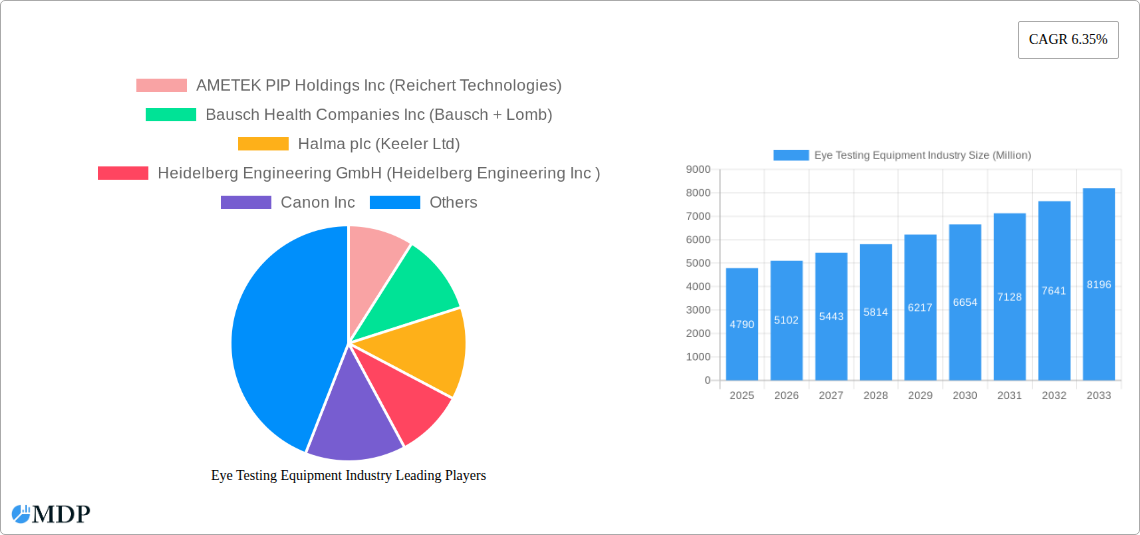
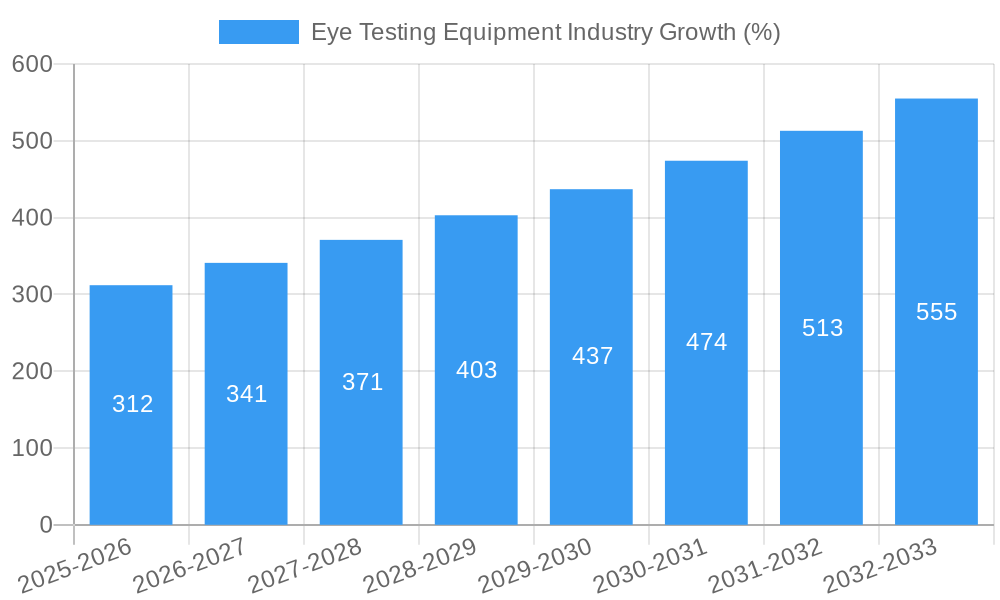
The global eye testing equipment market, valued at $4.79 billion in 2025, is projected to experience robust growth, driven by a rising prevalence of vision impairments globally, an aging population increasing demand for eye care, and technological advancements leading to more sophisticated and accurate diagnostic tools. The compound annual growth rate (CAGR) of 6.35% from 2025 to 2033 indicates a significant expansion of this market. Key market segments include retina examination equipment, which currently holds the largest market share due to the high prevalence of retinal diseases; followed by cornea examination equipment, encompassing retinoscopes and other general examination tools. Hospitals and eye clinics represent the largest end-user segments, reflecting the crucial role of these facilities in comprehensive eye care. Technological advancements such as AI-powered image analysis and improved portability of devices are expected to further drive market expansion. However, the high cost of advanced equipment, particularly in developing nations, coupled with the need for skilled professionals to operate these sophisticated instruments, may pose some constraints to market growth. The increasing integration of teleophthalmology is anticipated to expand access to eye care, particularly in remote areas, creating new market opportunities for portable and user-friendly devices.
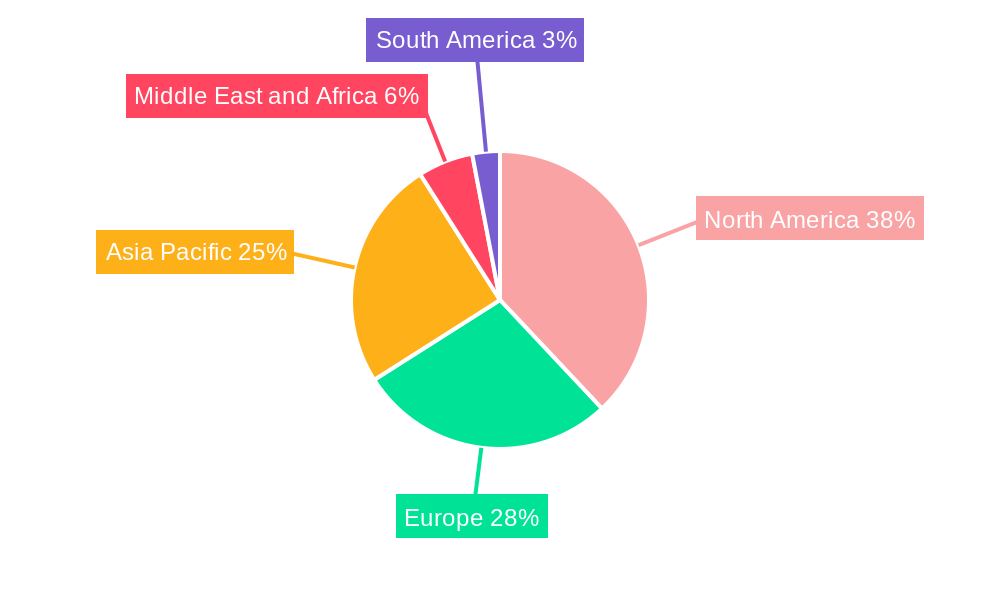
The competitive landscape is characterized by the presence of established players such as AMETEK, Bausch + Lomb, and Carl Zeiss Meditec, alongside other prominent companies like Canon, Heidelberg Engineering, and Nidek. These companies are constantly engaged in research and development, striving to introduce innovative products with enhanced functionalities and improved diagnostic capabilities. Regional analysis indicates that North America currently holds a significant market share due to higher healthcare expenditure and technological advancements. However, Asia Pacific is projected to witness substantial growth in the coming years due to a rapidly growing population, increasing awareness of eye health, and rising disposable incomes. Europe is anticipated to show steady growth due to its well-established healthcare infrastructure and a high incidence of vision problems within its aging population.
Eye Testing Equipment Industry Market Report: 2019-2033
This comprehensive report provides an in-depth analysis of the Eye Testing Equipment industry, offering invaluable insights for stakeholders seeking to navigate this dynamic market. With a study period spanning 2019-2033, a base year of 2025, and a forecast period of 2025-2033, this report is your essential guide to understanding current trends and future opportunities. The report covers key market segments, leading players, and emerging technologies, providing actionable intelligence to drive strategic decision-making. The global market size is estimated at xx Million in 2025 and is projected to reach xx Million by 2033, exhibiting a CAGR of xx%.
Eye Testing Equipment Industry Market Dynamics & Concentration
The Eye Testing Equipment market is characterized by a moderately concentrated landscape, with several major players holding significant market share. The market's dynamics are shaped by a complex interplay of factors including continuous innovation in imaging technologies, stringent regulatory frameworks governing medical device approvals, and the emergence of substitute technologies like AI-powered diagnostic tools. End-user trends, particularly the growing preference for minimally invasive procedures and technologically advanced equipment in hospitals and eye clinics, are driving market growth.
Market concentration is influenced by the ongoing mergers and acquisitions (M&A) activity within the industry. Over the historical period (2019-2024), approximately xx M&A deals were recorded, indicating significant consolidation efforts. Key players like AMETEK PIP Holdings Inc (Reichert Technologies), Bausch Health Companies Inc (Bausch + Lomb), and Halma plc (Keeler Ltd) hold a combined market share of approximately xx%, demonstrating the presence of significant players. Smaller players focus on niche segments and innovative technologies to compete effectively.
- Market Concentration: Moderately concentrated
- Innovation Drivers: Advancements in imaging technologies, AI integration, miniaturization
- Regulatory Frameworks: Stringent regulatory approvals (e.g., FDA, CE mark) impact market entry
- Product Substitutes: AI-powered diagnostic tools, telemedicine solutions
- End-User Trends: Increasing demand from hospitals, eye clinics, and rising adoption in emerging markets.
- M&A Activity: xx M&A deals in 2019-2024, leading to market consolidation.
Eye Testing Equipment Industry Industry Trends & Analysis
The Eye Testing Equipment market is witnessing robust growth driven by several factors. The rising prevalence of vision impairments globally, coupled with an aging population, fuels demand for advanced diagnostic tools. Technological advancements, such as the introduction of handheld fundus cameras (like Epipole's epiCam) and improved imaging resolution, enhance diagnostic capabilities and drive market penetration. Consumer preferences are shifting towards non-invasive, portable, and user-friendly equipment, prompting manufacturers to focus on developing such technologies. The competitive landscape is characterized by intense R&D efforts, strategic collaborations, and product diversification. This leads to continuous improvement in product quality, functionality, and affordability, further accelerating market growth. The market is expected to witness a CAGR of xx% during the forecast period (2025-2033), with market penetration increasing significantly in emerging economies.
Leading Markets & Segments in Eye Testing Equipment Industry
The North American region currently holds the largest market share due to advanced healthcare infrastructure, high healthcare expenditure, and a significant prevalence of vision impairments. Within the segments, Retina Examination equipment commands the highest share due to its crucial role in detecting and managing retinal diseases. However, the Cornea Examination segment is experiencing rapid growth driven by the increasing prevalence of corneal diseases and technological advancements in corneal imaging.
Key Drivers:
- North America: Advanced healthcare infrastructure, high healthcare expenditure, high prevalence of vision disorders.
- Europe: Growing awareness of eye health, rising geriatric population, increasing adoption of advanced technologies.
- Asia Pacific: High prevalence of refractive errors, increasing disposable incomes, growing healthcare infrastructure.
Segment Dominance:
- Retina Examination: Largest segment driven by the prevalence of retinal diseases and technological advancements.
- Cornea Examination: Fastest growing segment, fueled by the rising prevalence of corneal diseases and new imaging technologies.
- End-User: Hospitals dominate the market due to their specialized facilities and advanced technology needs; however, growth in eye clinics and other end-users is noteworthy.
Eye Testing Equipment Industry Product Developments
Recent years have witnessed significant product innovations in the Eye Testing Equipment sector, focusing on improved portability, image quality, and ease of use. Handheld fundus cameras, offering high-resolution imaging capabilities, have gained popularity for their convenience and effectiveness in various settings. Integration of advanced imaging techniques and AI-powered diagnostic tools is enhancing the accuracy and speed of diagnosis, leading to improved patient care. These advancements are driving market adoption, creating a competitive advantage for manufacturers who can deliver advanced, user-friendly solutions.
Key Drivers of Eye Testing Equipment Industry Growth
The Eye Testing Equipment market is propelled by a confluence of factors. Technological advancements resulting in improved image quality, portability, and ease of use are key drivers. The growing prevalence of vision impairments, coupled with an aging global population, further increases demand. Favorable regulatory environments promoting the adoption of advanced medical technologies contribute to market growth. Finally, increased healthcare expenditure and investments in healthcare infrastructure across various regions create substantial market opportunities.
Challenges in the Eye Testing Equipment Industry Market
The Eye Testing Equipment industry faces challenges including stringent regulatory approvals for new medical devices, which can increase time to market and development costs. Supply chain disruptions can impact production and pricing. Furthermore, intense competition from established and emerging players necessitates continuous innovation and strategic investments to maintain a competitive edge. These factors collectively impact market growth and profitability. The total estimated impact on market revenue due to these challenges is approximately xx Million annually.
Emerging Opportunities in Eye Testing Equipment Industry
The future of the Eye Testing Equipment market is bright, driven by several emerging opportunities. Advancements in AI-powered diagnostic tools offer potential for improved accuracy and efficiency in eye examinations. Strategic partnerships between equipment manufacturers and healthcare providers can expand market reach and access. Focus on developing cost-effective, portable devices will increase access to eye care in underserved areas, creating substantial market potential.
Leading Players in the Eye Testing Equipment Industry Sector
- AMETEK PIP Holdings Inc (Reichert Technologies)
- Bausch Health Companies Inc (Bausch + Lomb)
- Halma plc (Keeler Ltd)
- Heidelberg Engineering GmbH (Heidelberg Engineering Inc)
- Canon Inc
- Carl Zeiss Meditec AG
- Revenio Group PLC (iCare Finland OY)
- Oculus Inc
- Nidek Co Ltd
- Johnson & Johnson
- Alcon
- Essilor Luxottica (Essilor International SA)
- HEINE Optotechnik
Key Milestones in Eye Testing Equipment Industry Industry
- July 2022: Sightsavers launches a mobile eye care van equipped with ophthalmoscopes, retinoscopes, and other testing equipment in Delhi-NCR, expanding access to eye care services.
- March 2022: Epipole launches its epiCam fundus camera, a high-powered, ultra-portable, wireless fundus camera, enhancing diagnostic capabilities.
Strategic Outlook for Eye Testing Equipment Industry Market
The Eye Testing Equipment market is poised for continued expansion, driven by technological innovation and a growing need for efficient, accurate eye care solutions. Strategic partnerships, focused R&D efforts, and expansion into emerging markets present significant growth opportunities for industry players. The market's future depends on embracing advancements in AI, telemedicine, and miniaturization to improve affordability and access to advanced eye care globally.
Eye Testing Equipment Industry Segmentation
-
1. Type of Examination
-
1.1. Retina Examination
- 1.1.1. OCT Scanner
- 1.1.2. Fundus Camera
- 1.1.3. Visual Field Analyzer
- 1.1.4. Ophthalmoscope
- 1.1.5. Retinoscope
-
1.2. Cornea Examination
- 1.2.1. Wavefront Aberrometer
- 1.2.2. Specular Microscope
- 1.2.3. Other Cornea Examinations
-
1.3. General Examination
- 1.3.1. Autorefractor
- 1.3.2. Ophthalmic Ultrasound System
- 1.3.3. Tonometer
- 1.3.4. Phoropter
- 1.3.5. Keratometer
- 1.3.6. Lensometer
- 1.3.7. Other General Examinations
-
1.1. Retina Examination
-
2. End User
- 2.1. Eye Clinic
- 2.2. Hospital
- 2.3. Other End Users
Eye Testing Equipment Industry Segmentation By Geography
-
1. North America
- 1.1. United States
- 1.2. Canada
- 1.3. Mexico
-
2. Europe
- 2.1. Germany
- 2.2. United Kingdom
- 2.3. France
- 2.4. Italy
- 2.5. Spain
- 2.6. Rest of Europe
-
3. Asia Pacific
- 3.1. China
- 3.2. Japan
- 3.3. India
- 3.4. Australia
- 3.5. South Korea
- 3.6. Rest of Asia Pacific
-
4. Middle East and Africa
- 4.1. GCC
- 4.2. South Africa
- 4.3. Rest of Middle East and Africa
-
5. South America
- 5.1. Brazil
- 5.2. Argentina
- 5.3. Rest of South America
Eye Testing Equipment Industry REPORT HIGHLIGHTS
| Aspects | Details |
|---|---|
| Study Period | 2019-2033 |
| Base Year | 2024 |
| Estimated Year | 2025 |
| Forecast Period | 2025-2033 |
| Historical Period | 2019-2024 |
| Growth Rate | CAGR of 6.35% from 2019-2033 |
| Segmentation |
|
Table of Contents
- 1. Introduction
- 1.1. Research Scope
- 1.2. Market Segmentation
- 1.3. Research Methodology
- 1.4. Definitions and Assumptions
- 2. Executive Summary
- 2.1. Introduction
- 3. Market Dynamics
- 3.1. Introduction
- 3.2. Market Drivers
- 3.2.1. Rising Prevalence of Eye Diseases; Technological Advancements in Ophthalmic Devices; Increasing Government Initiatives to Control Visual Impairment
- 3.3. Market Restrains
- 3.3.1. High Cost of Eye Examination Equipment; Lack of Awareness and Low Accessibility to Eye Care in Low-income Economies
- 3.4. Market Trends
- 3.4.1. OCT Scanner Segment is Expected to Hold Significant Market Share Over the Forecast Period
- 4. Market Factor Analysis
- 4.1. Porters Five Forces
- 4.2. Supply/Value Chain
- 4.3. PESTEL analysis
- 4.4. Market Entropy
- 4.5. Patent/Trademark Analysis
- 5. Global Eye Testing Equipment Industry Analysis, Insights and Forecast, 2019-2031
- 5.1. Market Analysis, Insights and Forecast - by Type of Examination
- 5.1.1. Retina Examination
- 5.1.1.1. OCT Scanner
- 5.1.1.2. Fundus Camera
- 5.1.1.3. Visual Field Analyzer
- 5.1.1.4. Ophthalmoscope
- 5.1.1.5. Retinoscope
- 5.1.2. Cornea Examination
- 5.1.2.1. Wavefront Aberrometer
- 5.1.2.2. Specular Microscope
- 5.1.2.3. Other Cornea Examinations
- 5.1.3. General Examination
- 5.1.3.1. Autorefractor
- 5.1.3.2. Ophthalmic Ultrasound System
- 5.1.3.3. Tonometer
- 5.1.3.4. Phoropter
- 5.1.3.5. Keratometer
- 5.1.3.6. Lensometer
- 5.1.3.7. Other General Examinations
- 5.1.1. Retina Examination
- 5.2. Market Analysis, Insights and Forecast - by End User
- 5.2.1. Eye Clinic
- 5.2.2. Hospital
- 5.2.3. Other End Users
- 5.3. Market Analysis, Insights and Forecast - by Region
- 5.3.1. North America
- 5.3.2. Europe
- 5.3.3. Asia Pacific
- 5.3.4. Middle East and Africa
- 5.3.5. South America
- 5.1. Market Analysis, Insights and Forecast - by Type of Examination
- 6. North America Eye Testing Equipment Industry Analysis, Insights and Forecast, 2019-2031
- 6.1. Market Analysis, Insights and Forecast - by Type of Examination
- 6.1.1. Retina Examination
- 6.1.1.1. OCT Scanner
- 6.1.1.2. Fundus Camera
- 6.1.1.3. Visual Field Analyzer
- 6.1.1.4. Ophthalmoscope
- 6.1.1.5. Retinoscope
- 6.1.2. Cornea Examination
- 6.1.2.1. Wavefront Aberrometer
- 6.1.2.2. Specular Microscope
- 6.1.2.3. Other Cornea Examinations
- 6.1.3. General Examination
- 6.1.3.1. Autorefractor
- 6.1.3.2. Ophthalmic Ultrasound System
- 6.1.3.3. Tonometer
- 6.1.3.4. Phoropter
- 6.1.3.5. Keratometer
- 6.1.3.6. Lensometer
- 6.1.3.7. Other General Examinations
- 6.1.1. Retina Examination
- 6.2. Market Analysis, Insights and Forecast - by End User
- 6.2.1. Eye Clinic
- 6.2.2. Hospital
- 6.2.3. Other End Users
- 6.1. Market Analysis, Insights and Forecast - by Type of Examination
- 7. Europe Eye Testing Equipment Industry Analysis, Insights and Forecast, 2019-2031
- 7.1. Market Analysis, Insights and Forecast - by Type of Examination
- 7.1.1. Retina Examination
- 7.1.1.1. OCT Scanner
- 7.1.1.2. Fundus Camera
- 7.1.1.3. Visual Field Analyzer
- 7.1.1.4. Ophthalmoscope
- 7.1.1.5. Retinoscope
- 7.1.2. Cornea Examination
- 7.1.2.1. Wavefront Aberrometer
- 7.1.2.2. Specular Microscope
- 7.1.2.3. Other Cornea Examinations
- 7.1.3. General Examination
- 7.1.3.1. Autorefractor
- 7.1.3.2. Ophthalmic Ultrasound System
- 7.1.3.3. Tonometer
- 7.1.3.4. Phoropter
- 7.1.3.5. Keratometer
- 7.1.3.6. Lensometer
- 7.1.3.7. Other General Examinations
- 7.1.1. Retina Examination
- 7.2. Market Analysis, Insights and Forecast - by End User
- 7.2.1. Eye Clinic
- 7.2.2. Hospital
- 7.2.3. Other End Users
- 7.1. Market Analysis, Insights and Forecast - by Type of Examination
- 8. Asia Pacific Eye Testing Equipment Industry Analysis, Insights and Forecast, 2019-2031
- 8.1. Market Analysis, Insights and Forecast - by Type of Examination
- 8.1.1. Retina Examination
- 8.1.1.1. OCT Scanner
- 8.1.1.2. Fundus Camera
- 8.1.1.3. Visual Field Analyzer
- 8.1.1.4. Ophthalmoscope
- 8.1.1.5. Retinoscope
- 8.1.2. Cornea Examination
- 8.1.2.1. Wavefront Aberrometer
- 8.1.2.2. Specular Microscope
- 8.1.2.3. Other Cornea Examinations
- 8.1.3. General Examination
- 8.1.3.1. Autorefractor
- 8.1.3.2. Ophthalmic Ultrasound System
- 8.1.3.3. Tonometer
- 8.1.3.4. Phoropter
- 8.1.3.5. Keratometer
- 8.1.3.6. Lensometer
- 8.1.3.7. Other General Examinations
- 8.1.1. Retina Examination
- 8.2. Market Analysis, Insights and Forecast - by End User
- 8.2.1. Eye Clinic
- 8.2.2. Hospital
- 8.2.3. Other End Users
- 8.1. Market Analysis, Insights and Forecast - by Type of Examination
- 9. Middle East and Africa Eye Testing Equipment Industry Analysis, Insights and Forecast, 2019-2031
- 9.1. Market Analysis, Insights and Forecast - by Type of Examination
- 9.1.1. Retina Examination
- 9.1.1.1. OCT Scanner
- 9.1.1.2. Fundus Camera
- 9.1.1.3. Visual Field Analyzer
- 9.1.1.4. Ophthalmoscope
- 9.1.1.5. Retinoscope
- 9.1.2. Cornea Examination
- 9.1.2.1. Wavefront Aberrometer
- 9.1.2.2. Specular Microscope
- 9.1.2.3. Other Cornea Examinations
- 9.1.3. General Examination
- 9.1.3.1. Autorefractor
- 9.1.3.2. Ophthalmic Ultrasound System
- 9.1.3.3. Tonometer
- 9.1.3.4. Phoropter
- 9.1.3.5. Keratometer
- 9.1.3.6. Lensometer
- 9.1.3.7. Other General Examinations
- 9.1.1. Retina Examination
- 9.2. Market Analysis, Insights and Forecast - by End User
- 9.2.1. Eye Clinic
- 9.2.2. Hospital
- 9.2.3. Other End Users
- 9.1. Market Analysis, Insights and Forecast - by Type of Examination
- 10. South America Eye Testing Equipment Industry Analysis, Insights and Forecast, 2019-2031
- 10.1. Market Analysis, Insights and Forecast - by Type of Examination
- 10.1.1. Retina Examination
- 10.1.1.1. OCT Scanner
- 10.1.1.2. Fundus Camera
- 10.1.1.3. Visual Field Analyzer
- 10.1.1.4. Ophthalmoscope
- 10.1.1.5. Retinoscope
- 10.1.2. Cornea Examination
- 10.1.2.1. Wavefront Aberrometer
- 10.1.2.2. Specular Microscope
- 10.1.2.3. Other Cornea Examinations
- 10.1.3. General Examination
- 10.1.3.1. Autorefractor
- 10.1.3.2. Ophthalmic Ultrasound System
- 10.1.3.3. Tonometer
- 10.1.3.4. Phoropter
- 10.1.3.5. Keratometer
- 10.1.3.6. Lensometer
- 10.1.3.7. Other General Examinations
- 10.1.1. Retina Examination
- 10.2. Market Analysis, Insights and Forecast - by End User
- 10.2.1. Eye Clinic
- 10.2.2. Hospital
- 10.2.3. Other End Users
- 10.1. Market Analysis, Insights and Forecast - by Type of Examination
- 11. North America Eye Testing Equipment Industry Analysis, Insights and Forecast, 2019-2031
- 11.1. Market Analysis, Insights and Forecast - By Country/Sub-region
- 11.1.1 United States
- 11.1.2 Canada
- 11.1.3 Mexico
- 12. Europe Eye Testing Equipment Industry Analysis, Insights and Forecast, 2019-2031
- 12.1. Market Analysis, Insights and Forecast - By Country/Sub-region
- 12.1.1 Germany
- 12.1.2 United Kingdom
- 12.1.3 France
- 12.1.4 Italy
- 12.1.5 Spain
- 12.1.6 Rest of Europe
- 13. Asia Pacific Eye Testing Equipment Industry Analysis, Insights and Forecast, 2019-2031
- 13.1. Market Analysis, Insights and Forecast - By Country/Sub-region
- 13.1.1 China
- 13.1.2 Japan
- 13.1.3 India
- 13.1.4 Australia
- 13.1.5 South Korea
- 13.1.6 Rest of Asia Pacific
- 14. Middle East and Africa Eye Testing Equipment Industry Analysis, Insights and Forecast, 2019-2031
- 14.1. Market Analysis, Insights and Forecast - By Country/Sub-region
- 14.1.1 GCC
- 14.1.2 South Africa
- 14.1.3 Rest of Middle East and Africa
- 15. South America Eye Testing Equipment Industry Analysis, Insights and Forecast, 2019-2031
- 15.1. Market Analysis, Insights and Forecast - By Country/Sub-region
- 15.1.1 Brazil
- 15.1.2 Argentina
- 15.1.3 Rest of South America
- 16. Competitive Analysis
- 16.1. Global Market Share Analysis 2024
- 16.2. Company Profiles
- 16.2.1 AMETEK PIP Holdings Inc (Reichert Technologies)
- 16.2.1.1. Overview
- 16.2.1.2. Products
- 16.2.1.3. SWOT Analysis
- 16.2.1.4. Recent Developments
- 16.2.1.5. Financials (Based on Availability)
- 16.2.2 Bausch Health Companies Inc (Bausch + Lomb)
- 16.2.2.1. Overview
- 16.2.2.2. Products
- 16.2.2.3. SWOT Analysis
- 16.2.2.4. Recent Developments
- 16.2.2.5. Financials (Based on Availability)
- 16.2.3 Halma plc (Keeler Ltd)
- 16.2.3.1. Overview
- 16.2.3.2. Products
- 16.2.3.3. SWOT Analysis
- 16.2.3.4. Recent Developments
- 16.2.3.5. Financials (Based on Availability)
- 16.2.4 Heidelberg Engineering GmbH (Heidelberg Engineering Inc )
- 16.2.4.1. Overview
- 16.2.4.2. Products
- 16.2.4.3. SWOT Analysis
- 16.2.4.4. Recent Developments
- 16.2.4.5. Financials (Based on Availability)
- 16.2.5 Canon Inc
- 16.2.5.1. Overview
- 16.2.5.2. Products
- 16.2.5.3. SWOT Analysis
- 16.2.5.4. Recent Developments
- 16.2.5.5. Financials (Based on Availability)
- 16.2.6 Carl Zeiss Meditec AG
- 16.2.6.1. Overview
- 16.2.6.2. Products
- 16.2.6.3. SWOT Analysis
- 16.2.6.4. Recent Developments
- 16.2.6.5. Financials (Based on Availability)
- 16.2.7 Revenio Group PLC (iCare Finland OY)
- 16.2.7.1. Overview
- 16.2.7.2. Products
- 16.2.7.3. SWOT Analysis
- 16.2.7.4. Recent Developments
- 16.2.7.5. Financials (Based on Availability)
- 16.2.8 Oculus Inc
- 16.2.8.1. Overview
- 16.2.8.2. Products
- 16.2.8.3. SWOT Analysis
- 16.2.8.4. Recent Developments
- 16.2.8.5. Financials (Based on Availability)
- 16.2.9 Nidek Co Ltd
- 16.2.9.1. Overview
- 16.2.9.2. Products
- 16.2.9.3. SWOT Analysis
- 16.2.9.4. Recent Developments
- 16.2.9.5. Financials (Based on Availability)
- 16.2.10 Johnson & Johnson
- 16.2.10.1. Overview
- 16.2.10.2. Products
- 16.2.10.3. SWOT Analysis
- 16.2.10.4. Recent Developments
- 16.2.10.5. Financials (Based on Availability)
- 16.2.11 Alcon
- 16.2.11.1. Overview
- 16.2.11.2. Products
- 16.2.11.3. SWOT Analysis
- 16.2.11.4. Recent Developments
- 16.2.11.5. Financials (Based on Availability)
- 16.2.12 Essilor Luxottica (Essilor International SA)
- 16.2.12.1. Overview
- 16.2.12.2. Products
- 16.2.12.3. SWOT Analysis
- 16.2.12.4. Recent Developments
- 16.2.12.5. Financials (Based on Availability)
- 16.2.13 HEINE Optotechnik
- 16.2.13.1. Overview
- 16.2.13.2. Products
- 16.2.13.3. SWOT Analysis
- 16.2.13.4. Recent Developments
- 16.2.13.5. Financials (Based on Availability)
- 16.2.1 AMETEK PIP Holdings Inc (Reichert Technologies)
List of Figures
- Figure 1: Global Eye Testing Equipment Industry Revenue Breakdown (Million, %) by Region 2024 & 2032
- Figure 2: Global Eye Testing Equipment Industry Volume Breakdown (K Unit, %) by Region 2024 & 2032
- Figure 3: North America Eye Testing Equipment Industry Revenue (Million), by Country 2024 & 2032
- Figure 4: North America Eye Testing Equipment Industry Volume (K Unit), by Country 2024 & 2032
- Figure 5: North America Eye Testing Equipment Industry Revenue Share (%), by Country 2024 & 2032
- Figure 6: North America Eye Testing Equipment Industry Volume Share (%), by Country 2024 & 2032
- Figure 7: Europe Eye Testing Equipment Industry Revenue (Million), by Country 2024 & 2032
- Figure 8: Europe Eye Testing Equipment Industry Volume (K Unit), by Country 2024 & 2032
- Figure 9: Europe Eye Testing Equipment Industry Revenue Share (%), by Country 2024 & 2032
- Figure 10: Europe Eye Testing Equipment Industry Volume Share (%), by Country 2024 & 2032
- Figure 11: Asia Pacific Eye Testing Equipment Industry Revenue (Million), by Country 2024 & 2032
- Figure 12: Asia Pacific Eye Testing Equipment Industry Volume (K Unit), by Country 2024 & 2032
- Figure 13: Asia Pacific Eye Testing Equipment Industry Revenue Share (%), by Country 2024 & 2032
- Figure 14: Asia Pacific Eye Testing Equipment Industry Volume Share (%), by Country 2024 & 2032
- Figure 15: Middle East and Africa Eye Testing Equipment Industry Revenue (Million), by Country 2024 & 2032
- Figure 16: Middle East and Africa Eye Testing Equipment Industry Volume (K Unit), by Country 2024 & 2032
- Figure 17: Middle East and Africa Eye Testing Equipment Industry Revenue Share (%), by Country 2024 & 2032
- Figure 18: Middle East and Africa Eye Testing Equipment Industry Volume Share (%), by Country 2024 & 2032
- Figure 19: South America Eye Testing Equipment Industry Revenue (Million), by Country 2024 & 2032
- Figure 20: South America Eye Testing Equipment Industry Volume (K Unit), by Country 2024 & 2032
- Figure 21: South America Eye Testing Equipment Industry Revenue Share (%), by Country 2024 & 2032
- Figure 22: South America Eye Testing Equipment Industry Volume Share (%), by Country 2024 & 2032
- Figure 23: North America Eye Testing Equipment Industry Revenue (Million), by Type of Examination 2024 & 2032
- Figure 24: North America Eye Testing Equipment Industry Volume (K Unit), by Type of Examination 2024 & 2032
- Figure 25: North America Eye Testing Equipment Industry Revenue Share (%), by Type of Examination 2024 & 2032
- Figure 26: North America Eye Testing Equipment Industry Volume Share (%), by Type of Examination 2024 & 2032
- Figure 27: North America Eye Testing Equipment Industry Revenue (Million), by End User 2024 & 2032
- Figure 28: North America Eye Testing Equipment Industry Volume (K Unit), by End User 2024 & 2032
- Figure 29: North America Eye Testing Equipment Industry Revenue Share (%), by End User 2024 & 2032
- Figure 30: North America Eye Testing Equipment Industry Volume Share (%), by End User 2024 & 2032
- Figure 31: North America Eye Testing Equipment Industry Revenue (Million), by Country 2024 & 2032
- Figure 32: North America Eye Testing Equipment Industry Volume (K Unit), by Country 2024 & 2032
- Figure 33: North America Eye Testing Equipment Industry Revenue Share (%), by Country 2024 & 2032
- Figure 34: North America Eye Testing Equipment Industry Volume Share (%), by Country 2024 & 2032
- Figure 35: Europe Eye Testing Equipment Industry Revenue (Million), by Type of Examination 2024 & 2032
- Figure 36: Europe Eye Testing Equipment Industry Volume (K Unit), by Type of Examination 2024 & 2032
- Figure 37: Europe Eye Testing Equipment Industry Revenue Share (%), by Type of Examination 2024 & 2032
- Figure 38: Europe Eye Testing Equipment Industry Volume Share (%), by Type of Examination 2024 & 2032
- Figure 39: Europe Eye Testing Equipment Industry Revenue (Million), by End User 2024 & 2032
- Figure 40: Europe Eye Testing Equipment Industry Volume (K Unit), by End User 2024 & 2032
- Figure 41: Europe Eye Testing Equipment Industry Revenue Share (%), by End User 2024 & 2032
- Figure 42: Europe Eye Testing Equipment Industry Volume Share (%), by End User 2024 & 2032
- Figure 43: Europe Eye Testing Equipment Industry Revenue (Million), by Country 2024 & 2032
- Figure 44: Europe Eye Testing Equipment Industry Volume (K Unit), by Country 2024 & 2032
- Figure 45: Europe Eye Testing Equipment Industry Revenue Share (%), by Country 2024 & 2032
- Figure 46: Europe Eye Testing Equipment Industry Volume Share (%), by Country 2024 & 2032
- Figure 47: Asia Pacific Eye Testing Equipment Industry Revenue (Million), by Type of Examination 2024 & 2032
- Figure 48: Asia Pacific Eye Testing Equipment Industry Volume (K Unit), by Type of Examination 2024 & 2032
- Figure 49: Asia Pacific Eye Testing Equipment Industry Revenue Share (%), by Type of Examination 2024 & 2032
- Figure 50: Asia Pacific Eye Testing Equipment Industry Volume Share (%), by Type of Examination 2024 & 2032
- Figure 51: Asia Pacific Eye Testing Equipment Industry Revenue (Million), by End User 2024 & 2032
- Figure 52: Asia Pacific Eye Testing Equipment Industry Volume (K Unit), by End User 2024 & 2032
- Figure 53: Asia Pacific Eye Testing Equipment Industry Revenue Share (%), by End User 2024 & 2032
- Figure 54: Asia Pacific Eye Testing Equipment Industry Volume Share (%), by End User 2024 & 2032
- Figure 55: Asia Pacific Eye Testing Equipment Industry Revenue (Million), by Country 2024 & 2032
- Figure 56: Asia Pacific Eye Testing Equipment Industry Volume (K Unit), by Country 2024 & 2032
- Figure 57: Asia Pacific Eye Testing Equipment Industry Revenue Share (%), by Country 2024 & 2032
- Figure 58: Asia Pacific Eye Testing Equipment Industry Volume Share (%), by Country 2024 & 2032
- Figure 59: Middle East and Africa Eye Testing Equipment Industry Revenue (Million), by Type of Examination 2024 & 2032
- Figure 60: Middle East and Africa Eye Testing Equipment Industry Volume (K Unit), by Type of Examination 2024 & 2032
- Figure 61: Middle East and Africa Eye Testing Equipment Industry Revenue Share (%), by Type of Examination 2024 & 2032
- Figure 62: Middle East and Africa Eye Testing Equipment Industry Volume Share (%), by Type of Examination 2024 & 2032
- Figure 63: Middle East and Africa Eye Testing Equipment Industry Revenue (Million), by End User 2024 & 2032
- Figure 64: Middle East and Africa Eye Testing Equipment Industry Volume (K Unit), by End User 2024 & 2032
- Figure 65: Middle East and Africa Eye Testing Equipment Industry Revenue Share (%), by End User 2024 & 2032
- Figure 66: Middle East and Africa Eye Testing Equipment Industry Volume Share (%), by End User 2024 & 2032
- Figure 67: Middle East and Africa Eye Testing Equipment Industry Revenue (Million), by Country 2024 & 2032
- Figure 68: Middle East and Africa Eye Testing Equipment Industry Volume (K Unit), by Country 2024 & 2032
- Figure 69: Middle East and Africa Eye Testing Equipment Industry Revenue Share (%), by Country 2024 & 2032
- Figure 70: Middle East and Africa Eye Testing Equipment Industry Volume Share (%), by Country 2024 & 2032
- Figure 71: South America Eye Testing Equipment Industry Revenue (Million), by Type of Examination 2024 & 2032
- Figure 72: South America Eye Testing Equipment Industry Volume (K Unit), by Type of Examination 2024 & 2032
- Figure 73: South America Eye Testing Equipment Industry Revenue Share (%), by Type of Examination 2024 & 2032
- Figure 74: South America Eye Testing Equipment Industry Volume Share (%), by Type of Examination 2024 & 2032
- Figure 75: South America Eye Testing Equipment Industry Revenue (Million), by End User 2024 & 2032
- Figure 76: South America Eye Testing Equipment Industry Volume (K Unit), by End User 2024 & 2032
- Figure 77: South America Eye Testing Equipment Industry Revenue Share (%), by End User 2024 & 2032
- Figure 78: South America Eye Testing Equipment Industry Volume Share (%), by End User 2024 & 2032
- Figure 79: South America Eye Testing Equipment Industry Revenue (Million), by Country 2024 & 2032
- Figure 80: South America Eye Testing Equipment Industry Volume (K Unit), by Country 2024 & 2032
- Figure 81: South America Eye Testing Equipment Industry Revenue Share (%), by Country 2024 & 2032
- Figure 82: South America Eye Testing Equipment Industry Volume Share (%), by Country 2024 & 2032
List of Tables
- Table 1: Global Eye Testing Equipment Industry Revenue Million Forecast, by Region 2019 & 2032
- Table 2: Global Eye Testing Equipment Industry Volume K Unit Forecast, by Region 2019 & 2032
- Table 3: Global Eye Testing Equipment Industry Revenue Million Forecast, by Type of Examination 2019 & 2032
- Table 4: Global Eye Testing Equipment Industry Volume K Unit Forecast, by Type of Examination 2019 & 2032
- Table 5: Global Eye Testing Equipment Industry Revenue Million Forecast, by End User 2019 & 2032
- Table 6: Global Eye Testing Equipment Industry Volume K Unit Forecast, by End User 2019 & 2032
- Table 7: Global Eye Testing Equipment Industry Revenue Million Forecast, by Region 2019 & 2032
- Table 8: Global Eye Testing Equipment Industry Volume K Unit Forecast, by Region 2019 & 2032
- Table 9: Global Eye Testing Equipment Industry Revenue Million Forecast, by Country 2019 & 2032
- Table 10: Global Eye Testing Equipment Industry Volume K Unit Forecast, by Country 2019 & 2032
- Table 11: United States Eye Testing Equipment Industry Revenue (Million) Forecast, by Application 2019 & 2032
- Table 12: United States Eye Testing Equipment Industry Volume (K Unit) Forecast, by Application 2019 & 2032
- Table 13: Canada Eye Testing Equipment Industry Revenue (Million) Forecast, by Application 2019 & 2032
- Table 14: Canada Eye Testing Equipment Industry Volume (K Unit) Forecast, by Application 2019 & 2032
- Table 15: Mexico Eye Testing Equipment Industry Revenue (Million) Forecast, by Application 2019 & 2032
- Table 16: Mexico Eye Testing Equipment Industry Volume (K Unit) Forecast, by Application 2019 & 2032
- Table 17: Global Eye Testing Equipment Industry Revenue Million Forecast, by Country 2019 & 2032
- Table 18: Global Eye Testing Equipment Industry Volume K Unit Forecast, by Country 2019 & 2032
- Table 19: Germany Eye Testing Equipment Industry Revenue (Million) Forecast, by Application 2019 & 2032
- Table 20: Germany Eye Testing Equipment Industry Volume (K Unit) Forecast, by Application 2019 & 2032
- Table 21: United Kingdom Eye Testing Equipment Industry Revenue (Million) Forecast, by Application 2019 & 2032
- Table 22: United Kingdom Eye Testing Equipment Industry Volume (K Unit) Forecast, by Application 2019 & 2032
- Table 23: France Eye Testing Equipment Industry Revenue (Million) Forecast, by Application 2019 & 2032
- Table 24: France Eye Testing Equipment Industry Volume (K Unit) Forecast, by Application 2019 & 2032
- Table 25: Italy Eye Testing Equipment Industry Revenue (Million) Forecast, by Application 2019 & 2032
- Table 26: Italy Eye Testing Equipment Industry Volume (K Unit) Forecast, by Application 2019 & 2032
- Table 27: Spain Eye Testing Equipment Industry Revenue (Million) Forecast, by Application 2019 & 2032
- Table 28: Spain Eye Testing Equipment Industry Volume (K Unit) Forecast, by Application 2019 & 2032
- Table 29: Rest of Europe Eye Testing Equipment Industry Revenue (Million) Forecast, by Application 2019 & 2032
- Table 30: Rest of Europe Eye Testing Equipment Industry Volume (K Unit) Forecast, by Application 2019 & 2032
- Table 31: Global Eye Testing Equipment Industry Revenue Million Forecast, by Country 2019 & 2032
- Table 32: Global Eye Testing Equipment Industry Volume K Unit Forecast, by Country 2019 & 2032
- Table 33: China Eye Testing Equipment Industry Revenue (Million) Forecast, by Application 2019 & 2032
- Table 34: China Eye Testing Equipment Industry Volume (K Unit) Forecast, by Application 2019 & 2032
- Table 35: Japan Eye Testing Equipment Industry Revenue (Million) Forecast, by Application 2019 & 2032
- Table 36: Japan Eye Testing Equipment Industry Volume (K Unit) Forecast, by Application 2019 & 2032
- Table 37: India Eye Testing Equipment Industry Revenue (Million) Forecast, by Application 2019 & 2032
- Table 38: India Eye Testing Equipment Industry Volume (K Unit) Forecast, by Application 2019 & 2032
- Table 39: Australia Eye Testing Equipment Industry Revenue (Million) Forecast, by Application 2019 & 2032
- Table 40: Australia Eye Testing Equipment Industry Volume (K Unit) Forecast, by Application 2019 & 2032
- Table 41: South Korea Eye Testing Equipment Industry Revenue (Million) Forecast, by Application 2019 & 2032
- Table 42: South Korea Eye Testing Equipment Industry Volume (K Unit) Forecast, by Application 2019 & 2032
- Table 43: Rest of Asia Pacific Eye Testing Equipment Industry Revenue (Million) Forecast, by Application 2019 & 2032
- Table 44: Rest of Asia Pacific Eye Testing Equipment Industry Volume (K Unit) Forecast, by Application 2019 & 2032
- Table 45: Global Eye Testing Equipment Industry Revenue Million Forecast, by Country 2019 & 2032
- Table 46: Global Eye Testing Equipment Industry Volume K Unit Forecast, by Country 2019 & 2032
- Table 47: GCC Eye Testing Equipment Industry Revenue (Million) Forecast, by Application 2019 & 2032
- Table 48: GCC Eye Testing Equipment Industry Volume (K Unit) Forecast, by Application 2019 & 2032
- Table 49: South Africa Eye Testing Equipment Industry Revenue (Million) Forecast, by Application 2019 & 2032
- Table 50: South Africa Eye Testing Equipment Industry Volume (K Unit) Forecast, by Application 2019 & 2032
- Table 51: Rest of Middle East and Africa Eye Testing Equipment Industry Revenue (Million) Forecast, by Application 2019 & 2032
- Table 52: Rest of Middle East and Africa Eye Testing Equipment Industry Volume (K Unit) Forecast, by Application 2019 & 2032
- Table 53: Global Eye Testing Equipment Industry Revenue Million Forecast, by Country 2019 & 2032
- Table 54: Global Eye Testing Equipment Industry Volume K Unit Forecast, by Country 2019 & 2032
- Table 55: Brazil Eye Testing Equipment Industry Revenue (Million) Forecast, by Application 2019 & 2032
- Table 56: Brazil Eye Testing Equipment Industry Volume (K Unit) Forecast, by Application 2019 & 2032
- Table 57: Argentina Eye Testing Equipment Industry Revenue (Million) Forecast, by Application 2019 & 2032
- Table 58: Argentina Eye Testing Equipment Industry Volume (K Unit) Forecast, by Application 2019 & 2032
- Table 59: Rest of South America Eye Testing Equipment Industry Revenue (Million) Forecast, by Application 2019 & 2032
- Table 60: Rest of South America Eye Testing Equipment Industry Volume (K Unit) Forecast, by Application 2019 & 2032
- Table 61: Global Eye Testing Equipment Industry Revenue Million Forecast, by Type of Examination 2019 & 2032
- Table 62: Global Eye Testing Equipment Industry Volume K Unit Forecast, by Type of Examination 2019 & 2032
- Table 63: Global Eye Testing Equipment Industry Revenue Million Forecast, by End User 2019 & 2032
- Table 64: Global Eye Testing Equipment Industry Volume K Unit Forecast, by End User 2019 & 2032
- Table 65: Global Eye Testing Equipment Industry Revenue Million Forecast, by Country 2019 & 2032
- Table 66: Global Eye Testing Equipment Industry Volume K Unit Forecast, by Country 2019 & 2032
- Table 67: United States Eye Testing Equipment Industry Revenue (Million) Forecast, by Application 2019 & 2032
- Table 68: United States Eye Testing Equipment Industry Volume (K Unit) Forecast, by Application 2019 & 2032
- Table 69: Canada Eye Testing Equipment Industry Revenue (Million) Forecast, by Application 2019 & 2032
- Table 70: Canada Eye Testing Equipment Industry Volume (K Unit) Forecast, by Application 2019 & 2032
- Table 71: Mexico Eye Testing Equipment Industry Revenue (Million) Forecast, by Application 2019 & 2032
- Table 72: Mexico Eye Testing Equipment Industry Volume (K Unit) Forecast, by Application 2019 & 2032
- Table 73: Global Eye Testing Equipment Industry Revenue Million Forecast, by Type of Examination 2019 & 2032
- Table 74: Global Eye Testing Equipment Industry Volume K Unit Forecast, by Type of Examination 2019 & 2032
- Table 75: Global Eye Testing Equipment Industry Revenue Million Forecast, by End User 2019 & 2032
- Table 76: Global Eye Testing Equipment Industry Volume K Unit Forecast, by End User 2019 & 2032
- Table 77: Global Eye Testing Equipment Industry Revenue Million Forecast, by Country 2019 & 2032
- Table 78: Global Eye Testing Equipment Industry Volume K Unit Forecast, by Country 2019 & 2032
- Table 79: Germany Eye Testing Equipment Industry Revenue (Million) Forecast, by Application 2019 & 2032
- Table 80: Germany Eye Testing Equipment Industry Volume (K Unit) Forecast, by Application 2019 & 2032
- Table 81: United Kingdom Eye Testing Equipment Industry Revenue (Million) Forecast, by Application 2019 & 2032
- Table 82: United Kingdom Eye Testing Equipment Industry Volume (K Unit) Forecast, by Application 2019 & 2032
- Table 83: France Eye Testing Equipment Industry Revenue (Million) Forecast, by Application 2019 & 2032
- Table 84: France Eye Testing Equipment Industry Volume (K Unit) Forecast, by Application 2019 & 2032
- Table 85: Italy Eye Testing Equipment Industry Revenue (Million) Forecast, by Application 2019 & 2032
- Table 86: Italy Eye Testing Equipment Industry Volume (K Unit) Forecast, by Application 2019 & 2032
- Table 87: Spain Eye Testing Equipment Industry Revenue (Million) Forecast, by Application 2019 & 2032
- Table 88: Spain Eye Testing Equipment Industry Volume (K Unit) Forecast, by Application 2019 & 2032
- Table 89: Rest of Europe Eye Testing Equipment Industry Revenue (Million) Forecast, by Application 2019 & 2032
- Table 90: Rest of Europe Eye Testing Equipment Industry Volume (K Unit) Forecast, by Application 2019 & 2032
- Table 91: Global Eye Testing Equipment Industry Revenue Million Forecast, by Type of Examination 2019 & 2032
- Table 92: Global Eye Testing Equipment Industry Volume K Unit Forecast, by Type of Examination 2019 & 2032
- Table 93: Global Eye Testing Equipment Industry Revenue Million Forecast, by End User 2019 & 2032
- Table 94: Global Eye Testing Equipment Industry Volume K Unit Forecast, by End User 2019 & 2032
- Table 95: Global Eye Testing Equipment Industry Revenue Million Forecast, by Country 2019 & 2032
- Table 96: Global Eye Testing Equipment Industry Volume K Unit Forecast, by Country 2019 & 2032
- Table 97: China Eye Testing Equipment Industry Revenue (Million) Forecast, by Application 2019 & 2032
- Table 98: China Eye Testing Equipment Industry Volume (K Unit) Forecast, by Application 2019 & 2032
- Table 99: Japan Eye Testing Equipment Industry Revenue (Million) Forecast, by Application 2019 & 2032
- Table 100: Japan Eye Testing Equipment Industry Volume (K Unit) Forecast, by Application 2019 & 2032
- Table 101: India Eye Testing Equipment Industry Revenue (Million) Forecast, by Application 2019 & 2032
- Table 102: India Eye Testing Equipment Industry Volume (K Unit) Forecast, by Application 2019 & 2032
- Table 103: Australia Eye Testing Equipment Industry Revenue (Million) Forecast, by Application 2019 & 2032
- Table 104: Australia Eye Testing Equipment Industry Volume (K Unit) Forecast, by Application 2019 & 2032
- Table 105: South Korea Eye Testing Equipment Industry Revenue (Million) Forecast, by Application 2019 & 2032
- Table 106: South Korea Eye Testing Equipment Industry Volume (K Unit) Forecast, by Application 2019 & 2032
- Table 107: Rest of Asia Pacific Eye Testing Equipment Industry Revenue (Million) Forecast, by Application 2019 & 2032
- Table 108: Rest of Asia Pacific Eye Testing Equipment Industry Volume (K Unit) Forecast, by Application 2019 & 2032
- Table 109: Global Eye Testing Equipment Industry Revenue Million Forecast, by Type of Examination 2019 & 2032
- Table 110: Global Eye Testing Equipment Industry Volume K Unit Forecast, by Type of Examination 2019 & 2032
- Table 111: Global Eye Testing Equipment Industry Revenue Million Forecast, by End User 2019 & 2032
- Table 112: Global Eye Testing Equipment Industry Volume K Unit Forecast, by End User 2019 & 2032
- Table 113: Global Eye Testing Equipment Industry Revenue Million Forecast, by Country 2019 & 2032
- Table 114: Global Eye Testing Equipment Industry Volume K Unit Forecast, by Country 2019 & 2032
- Table 115: GCC Eye Testing Equipment Industry Revenue (Million) Forecast, by Application 2019 & 2032
- Table 116: GCC Eye Testing Equipment Industry Volume (K Unit) Forecast, by Application 2019 & 2032
- Table 117: South Africa Eye Testing Equipment Industry Revenue (Million) Forecast, by Application 2019 & 2032
- Table 118: South Africa Eye Testing Equipment Industry Volume (K Unit) Forecast, by Application 2019 & 2032
- Table 119: Rest of Middle East and Africa Eye Testing Equipment Industry Revenue (Million) Forecast, by Application 2019 & 2032
- Table 120: Rest of Middle East and Africa Eye Testing Equipment Industry Volume (K Unit) Forecast, by Application 2019 & 2032
- Table 121: Global Eye Testing Equipment Industry Revenue Million Forecast, by Type of Examination 2019 & 2032
- Table 122: Global Eye Testing Equipment Industry Volume K Unit Forecast, by Type of Examination 2019 & 2032
- Table 123: Global Eye Testing Equipment Industry Revenue Million Forecast, by End User 2019 & 2032
- Table 124: Global Eye Testing Equipment Industry Volume K Unit Forecast, by End User 2019 & 2032
- Table 125: Global Eye Testing Equipment Industry Revenue Million Forecast, by Country 2019 & 2032
- Table 126: Global Eye Testing Equipment Industry Volume K Unit Forecast, by Country 2019 & 2032
- Table 127: Brazil Eye Testing Equipment Industry Revenue (Million) Forecast, by Application 2019 & 2032
- Table 128: Brazil Eye Testing Equipment Industry Volume (K Unit) Forecast, by Application 2019 & 2032
- Table 129: Argentina Eye Testing Equipment Industry Revenue (Million) Forecast, by Application 2019 & 2032
- Table 130: Argentina Eye Testing Equipment Industry Volume (K Unit) Forecast, by Application 2019 & 2032
- Table 131: Rest of South America Eye Testing Equipment Industry Revenue (Million) Forecast, by Application 2019 & 2032
- Table 132: Rest of South America Eye Testing Equipment Industry Volume (K Unit) Forecast, by Application 2019 & 2032
Frequently Asked Questions
1. What is the projected Compound Annual Growth Rate (CAGR) of the Eye Testing Equipment Industry?
The projected CAGR is approximately 6.35%.
2. Which companies are prominent players in the Eye Testing Equipment Industry?
Key companies in the market include AMETEK PIP Holdings Inc (Reichert Technologies), Bausch Health Companies Inc (Bausch + Lomb), Halma plc (Keeler Ltd), Heidelberg Engineering GmbH (Heidelberg Engineering Inc ), Canon Inc, Carl Zeiss Meditec AG, Revenio Group PLC (iCare Finland OY), Oculus Inc , Nidek Co Ltd, Johnson & Johnson, Alcon, Essilor Luxottica (Essilor International SA), HEINE Optotechnik.
3. What are the main segments of the Eye Testing Equipment Industry?
The market segments include Type of Examination, End User.
4. Can you provide details about the market size?
The market size is estimated to be USD 4.79 Million as of 2022.
5. What are some drivers contributing to market growth?
Rising Prevalence of Eye Diseases; Technological Advancements in Ophthalmic Devices; Increasing Government Initiatives to Control Visual Impairment.
6. What are the notable trends driving market growth?
OCT Scanner Segment is Expected to Hold Significant Market Share Over the Forecast Period.
7. Are there any restraints impacting market growth?
High Cost of Eye Examination Equipment; Lack of Awareness and Low Accessibility to Eye Care in Low-income Economies.
8. Can you provide examples of recent developments in the market?
In July 2022, a mobile van was launched by Sightsavers under its National Truckers Eye Health Programme with the support of Cholamandalam Investment and Finance Company Limited (Chola) in Delhi-NCR to provide eye care services to the truckers' community. The van is equipped with the necessary tools and supplies, specifically an ophthalmoscope, a retinoscope, trial lenses, trial frames, a lensometer, vision charts, an occluder, and a drum for vision testing.
9. What pricing options are available for accessing the report?
Pricing options include single-user, multi-user, and enterprise licenses priced at USD 4750, USD 5250, and USD 8750 respectively.
10. Is the market size provided in terms of value or volume?
The market size is provided in terms of value, measured in Million and volume, measured in K Unit.
11. Are there any specific market keywords associated with the report?
Yes, the market keyword associated with the report is "Eye Testing Equipment Industry," which aids in identifying and referencing the specific market segment covered.
12. How do I determine which pricing option suits my needs best?
The pricing options vary based on user requirements and access needs. Individual users may opt for single-user licenses, while businesses requiring broader access may choose multi-user or enterprise licenses for cost-effective access to the report.
13. Are there any additional resources or data provided in the Eye Testing Equipment Industry report?
While the report offers comprehensive insights, it's advisable to review the specific contents or supplementary materials provided to ascertain if additional resources or data are available.
14. How can I stay updated on further developments or reports in the Eye Testing Equipment Industry?
To stay informed about further developments, trends, and reports in the Eye Testing Equipment Industry, consider subscribing to industry newsletters, following relevant companies and organizations, or regularly checking reputable industry news sources and publications.
Methodology
Step 1 - Identification of Relevant Samples Size from Population Database


Step 2 - Approaches for Defining Global Market Size (Value, Volume* & Price*)

Note*: In applicable scenarios
Step 3 - Data Sources
Primary Research
- Web Analytics
- Survey Reports
- Research Institute
- Latest Research Reports
- Opinion Leaders
Secondary Research
- Annual Reports
- White Paper
- Latest Press Release
- Industry Association
- Paid Database
- Investor Presentations

Step 4 - Data Triangulation
Involves using different sources of information in order to increase the validity of a study
These sources are likely to be stakeholders in a program - participants, other researchers, program staff, other community members, and so on.
Then we put all data in single framework & apply various statistical tools to find out the dynamic on the market.
During the analysis stage, feedback from the stakeholder groups would be compared to determine areas of agreement as well as areas of divergence
