

Key Insights
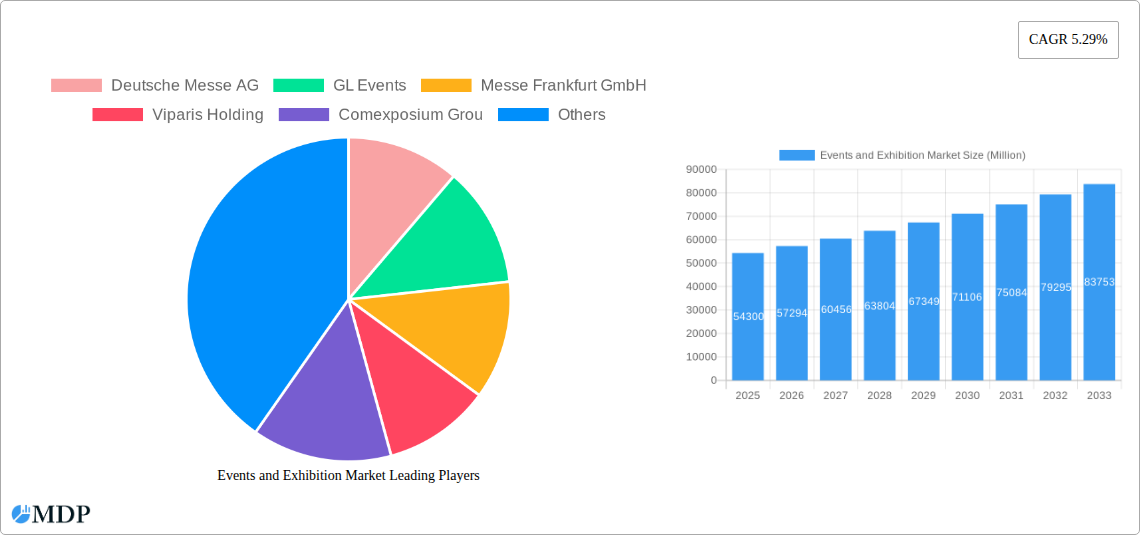
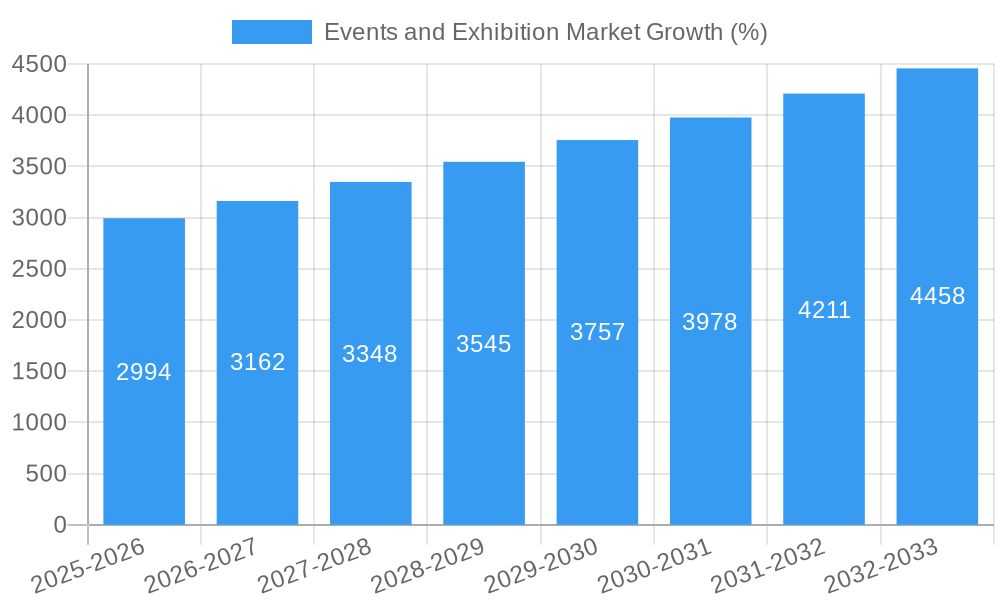
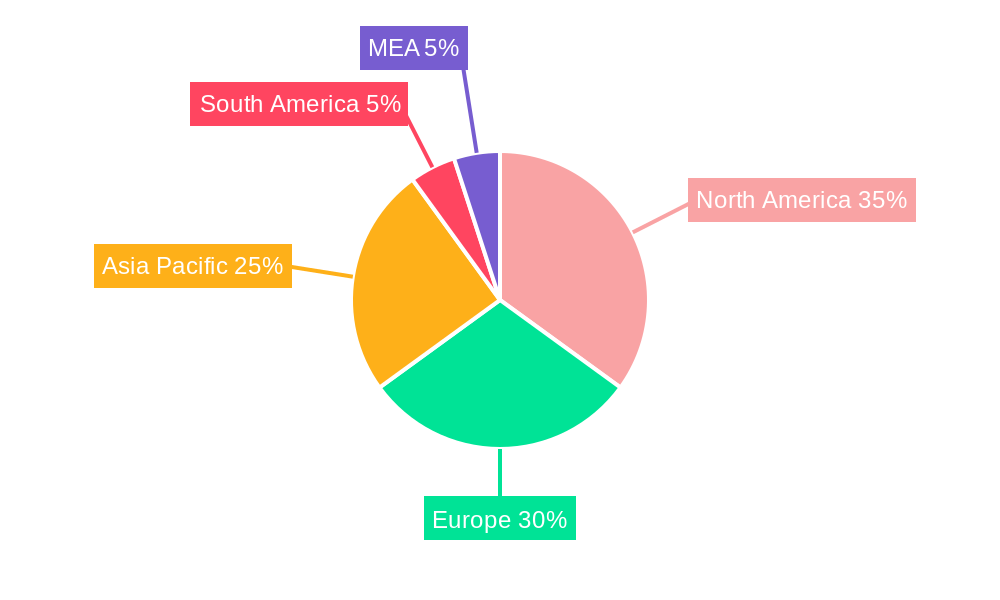
The global events and exhibition market, valued at $54.30 billion in 2025, is projected to experience robust growth, exhibiting a compound annual growth rate (CAGR) of 5.29% from 2025 to 2033. This expansion is fueled by several key drivers. The increasing adoption of hybrid and virtual event formats caters to broader audiences and offers cost-effective solutions for both exhibitors and attendees. Furthermore, the resurgence of in-person events post-pandemic, coupled with a growing preference for experiential marketing, significantly contributes to market growth. The diverse segmentation, encompassing B2B, B2C, and mixed events across various revenue streams (exhibitor fees, sponsorships, entrance fees, and services), caters to a wide range of industry needs. Key end-user sectors like consumer goods and retail, automotive, and industrial manufacturing are driving significant demand. However, economic uncertainties and potential logistical challenges could act as restraints, impacting the market's trajectory. Competitive landscape analysis reveals leading players such as Deutsche Messe AG, Messe Frankfurt GmbH, and Viparis Holding, continually innovating to maintain market share. Geographic analysis shows strong presence in North America and Europe, with Asia-Pacific emerging as a significant growth region driven by rapid economic development and increasing urbanization in key markets like China and India.
The market's future trajectory hinges on several factors. Continued technological advancements in virtual and hybrid event platforms will be crucial for enhancing engagement and accessibility. Moreover, successful adaptation to changing consumer preferences, including sustainability concerns and a focus on personalized experiences, will shape the competitive landscape. Government regulations concerning public gatherings and safety protocols will also influence market growth. The ability of event organizers to adapt their strategies to address these evolving factors will significantly determine their success in this dynamic and competitive market. Market penetration in emerging economies and the development of specialized niche events catering to specific industry needs are expected to fuel further growth in the coming years. A focus on data-driven insights and analytics will allow organizers to optimize event strategies and enhance ROI for exhibitors and sponsors.
Events and Exhibition Market: A Comprehensive Report (2019-2033)
This comprehensive report provides an in-depth analysis of the global Events and Exhibition Market, offering invaluable insights for industry stakeholders, investors, and strategic planners. With a study period spanning 2019-2033, a base year of 2025, and a forecast period of 2025-2033, this report meticulously examines market dynamics, trends, leading players, and future opportunities. The market is projected to reach xx Million by 2033, exhibiting a CAGR of xx% during the forecast period.
Events and Exhibition Market Market Dynamics & Concentration
The Events and Exhibition Market is characterized by a moderately concentrated landscape, with key players like Deutsche Messe AG, Messe Frankfurt GmbH, and Comexposium Group holding significant market share. The market share of these top 10 players is estimated at xx%. However, the market also exhibits a considerable presence of smaller, specialized event organizers catering to niche segments.
Market concentration is influenced by factors including:
- Innovation Drivers: Technological advancements in event management software, virtual and hybrid event platforms, and data analytics are driving innovation and attracting new entrants.
- Regulatory Frameworks: Government regulations regarding event safety, licensing, and sustainability practices play a significant role in shaping market dynamics. Changes in these regulations can impact operational costs and market access.
- Product Substitutes: The rise of virtual and hybrid events presents a significant substitute, particularly for B2B events. However, the inherent limitations of virtual events in fostering networking and face-to-face interaction continue to support in-person events.
- End-User Trends: Shifting consumer preferences towards experiential events, coupled with the growing demand for personalized and engaging experiences, are key drivers of market growth.
- M&A Activities: The industry has witnessed a significant number of mergers and acquisitions (M&A) deals in recent years (xx deals in the last 5 years). These activities contribute to market consolidation and enhance the capabilities of larger players.
Events and Exhibition Market Industry Trends & Analysis
The Events and Exhibition Market is experiencing robust growth, driven by several key factors:
- Rising Disposable Incomes: Increasing disposable incomes, particularly in emerging economies, fuel higher spending on leisure and entertainment, driving the growth of B2C events.
- Technological Disruptions: The adoption of virtual and hybrid event formats expands reach and accessibility, while also opening new avenues for data analytics and personalized experiences.
- Consumer Preferences: Demand for unique, personalized, and experiential events is pushing organizers to create more immersive and engaging experiences. Sustainability concerns are also influencing event planning and execution.
- Competitive Dynamics: The market is increasingly competitive, with players focusing on differentiation through unique offerings, value-added services, and advanced technologies.
The global Events and Exhibition market size, valued at xx Million in 2024, is projected to reach xx Million by 2033, with a CAGR of xx%. Market penetration rates vary significantly across segments and regions, with mature markets exhibiting higher penetration levels.
Leading Markets & Segments in Events and Exhibition Market
Dominant Regions/Countries: Europe and North America currently hold the largest market shares, driven by strong economic activity, well-developed infrastructure, and a high concentration of major event organizers. However, Asia-Pacific is poised for significant growth due to rising disposable incomes and expanding middle class.
Dominant Segments:
- By Type: B2B events remain a significant segment due to their role in business networking and lead generation. However, the growth of B2C and hybrid events are also noteworthy.
- By Revenue Stream: Exhibitor fees continue to be the primary revenue stream, followed by sponsorship fees and entrance fees. Value-added services such as event technology and marketing support are also significant revenue generators.
- By End User: The Consumer Goods and Retail Sector, Automotive and Transportation Sector, and Industrial sectors are major end users, each with specific event needs and preferences.
Key Drivers by Segment:
- Economic Policies: Government incentives and support for the events industry play a vital role in market growth.
- Infrastructure: Availability of appropriate event venues, transportation, and communication infrastructure directly impacts market expansion.
Events and Exhibition Market Product Developments
Recent product innovations focus on enhancing the attendee experience through improved technology. This includes virtual reality (VR) and augmented reality (AR) integration, interactive exhibits, personalized content, and data-driven event optimization. The development of sophisticated event management platforms and analytics tools is further enhancing efficiency and effectiveness. These advancements are improving market fit by catering to the evolving preferences of both organizers and attendees.
Key Drivers of Events and Exhibition Market Growth
Several factors are fueling the growth of the events and exhibition market:
- Technological Advancements: The adoption of virtual and hybrid event technologies has broadened market reach and enabled cost-effective operations.
- Economic Growth: Rising disposable incomes and robust economic activity in key regions are increasing demand for events and exhibitions.
- Government Support: Favorable regulatory environments and government initiatives promoting the events industry foster market expansion.
Challenges in the Events and Exhibition Market Market
The Events and Exhibition Market faces challenges like:
- Regulatory Hurdles: Stricter regulations regarding safety, security, and sustainability may increase operating costs.
- Supply Chain Issues: Disruptions in the supply chain can impact the availability of resources and materials needed for event organization.
- Competitive Pressures: Intense competition among event organizers requires continuous innovation and differentiation. This competition puts pressure on pricing and profitability.
Emerging Opportunities in Events and Exhibition Market
The events and exhibition market presents significant opportunities for long-term growth, driven by:
- Technological Breakthroughs: Further advancements in VR/AR, AI-powered personalization, and data analytics will enhance the attendee experience and streamline event operations.
- Strategic Partnerships: Collaborations between event organizers, technology providers, and marketing agencies can create synergistic growth opportunities.
- Market Expansion: Untapped markets in emerging economies present significant potential for expansion.
Leading Players in the Events and Exhibition Market Sector
- Deutsche Messe AG
- GL Events
- Messe Frankfurt GmbH
- Viparis Holding
- Comexposium Group
- Koelnmesse GmbH
- Messe Düsseldorf GmbH
- Percept Limited
- Fiera Milano SpA
- MCH Group AG
Key Milestones in Events and Exhibition Market Industry
- November 2023: Art Design Chicago highlights the importance of local artistic communities and showcases the potential of citywide event collaborations. This event demonstrates the impact of cultural events on local economies and tourism.
- November 2023: The merger of EventWorks and Quest Events strengthens the full-service offerings within the event rental sector, showcasing consolidation trends within the industry. This consolidation leads to greater efficiency and expanded service offerings.
Strategic Outlook for Events and Exhibition Market Market
The Events and Exhibition Market is poised for continued growth, driven by technological innovation, expanding global reach, and evolving consumer preferences. Strategic opportunities lie in leveraging technology for enhanced personalization, optimizing event logistics, and developing sustainable practices. Focusing on niche markets and offering specialized event experiences will further enhance competitiveness and profitability.
Events and Exhibition Market Segmentation
-
1. Type
- 1.1. B2B
- 1.2. B2C
- 1.3. Mixed/Hybrid
-
2. Revenue Stream
- 2.1. Exhibitor Fee
- 2.2. Sponsorship Fee
- 2.3. Entrance Fee
- 2.4. Services
-
3. End User
- 3.1. Consumer Goods and Retail Sector
- 3.2. Automotive and Transportation Sector
- 3.3. Industrial
- 3.4. Entertainment
- 3.5. Real Estate and Property
- 3.6. Hospitality Sector
- 3.7. Other End Users
Events and Exhibition Market Segmentation By Geography
-
1. North America
- 1.1. United States
- 1.2. Canada
-
2. Europe
- 2.1. Germany
- 2.2. United Kingdom
- 2.3. France
-
3. Asia Pacific
- 3.1. China
- 3.2. Japan
- 3.3. India
- 3.4. South Korea
- 3.5. Australia and New Zealand
- 4. Latin America
- 5. Middle East and Africa
Events and Exhibition Market REPORT HIGHLIGHTS
| Aspects | Details |
|---|---|
| Study Period | 2019-2033 |
| Base Year | 2024 |
| Estimated Year | 2025 |
| Forecast Period | 2025-2033 |
| Historical Period | 2019-2024 |
| Growth Rate | CAGR of 5.29% from 2019-2033 |
| Segmentation |
|
Table of Contents
- 1. Introduction
- 1.1. Research Scope
- 1.2. Market Segmentation
- 1.3. Research Methodology
- 1.4. Definitions and Assumptions
- 2. Executive Summary
- 2.1. Introduction
- 3. Market Dynamics
- 3.1. Introduction
- 3.2. Market Drivers
- 3.2.1. Growing Adoption of Geo-Cloning for Exhibition Organizers; Increasing Growth of Consumer Goods Penetrates the Growth of B2C Exhibition
- 3.3. Market Restrains
- 3.3.1. Loss Due to Restrictions of Smaller Players to Participate Owing to Potential Low Turnouts
- 3.4. Market Trends
- 3.4.1. Entertainment Sector to Witness Fastest Growth
- 4. Market Factor Analysis
- 4.1. Porters Five Forces
- 4.2. Supply/Value Chain
- 4.3. PESTEL analysis
- 4.4. Market Entropy
- 4.5. Patent/Trademark Analysis
- 5. Global Events and Exhibition Market Analysis, Insights and Forecast, 2019-2031
- 5.1. Market Analysis, Insights and Forecast - by Type
- 5.1.1. B2B
- 5.1.2. B2C
- 5.1.3. Mixed/Hybrid
- 5.2. Market Analysis, Insights and Forecast - by Revenue Stream
- 5.2.1. Exhibitor Fee
- 5.2.2. Sponsorship Fee
- 5.2.3. Entrance Fee
- 5.2.4. Services
- 5.3. Market Analysis, Insights and Forecast - by End User
- 5.3.1. Consumer Goods and Retail Sector
- 5.3.2. Automotive and Transportation Sector
- 5.3.3. Industrial
- 5.3.4. Entertainment
- 5.3.5. Real Estate and Property
- 5.3.6. Hospitality Sector
- 5.3.7. Other End Users
- 5.4. Market Analysis, Insights and Forecast - by Region
- 5.4.1. North America
- 5.4.2. Europe
- 5.4.3. Asia Pacific
- 5.4.4. Latin America
- 5.4.5. Middle East and Africa
- 5.1. Market Analysis, Insights and Forecast - by Type
- 6. North America Events and Exhibition Market Analysis, Insights and Forecast, 2019-2031
- 6.1. Market Analysis, Insights and Forecast - by Type
- 6.1.1. B2B
- 6.1.2. B2C
- 6.1.3. Mixed/Hybrid
- 6.2. Market Analysis, Insights and Forecast - by Revenue Stream
- 6.2.1. Exhibitor Fee
- 6.2.2. Sponsorship Fee
- 6.2.3. Entrance Fee
- 6.2.4. Services
- 6.3. Market Analysis, Insights and Forecast - by End User
- 6.3.1. Consumer Goods and Retail Sector
- 6.3.2. Automotive and Transportation Sector
- 6.3.3. Industrial
- 6.3.4. Entertainment
- 6.3.5. Real Estate and Property
- 6.3.6. Hospitality Sector
- 6.3.7. Other End Users
- 6.1. Market Analysis, Insights and Forecast - by Type
- 7. Europe Events and Exhibition Market Analysis, Insights and Forecast, 2019-2031
- 7.1. Market Analysis, Insights and Forecast - by Type
- 7.1.1. B2B
- 7.1.2. B2C
- 7.1.3. Mixed/Hybrid
- 7.2. Market Analysis, Insights and Forecast - by Revenue Stream
- 7.2.1. Exhibitor Fee
- 7.2.2. Sponsorship Fee
- 7.2.3. Entrance Fee
- 7.2.4. Services
- 7.3. Market Analysis, Insights and Forecast - by End User
- 7.3.1. Consumer Goods and Retail Sector
- 7.3.2. Automotive and Transportation Sector
- 7.3.3. Industrial
- 7.3.4. Entertainment
- 7.3.5. Real Estate and Property
- 7.3.6. Hospitality Sector
- 7.3.7. Other End Users
- 7.1. Market Analysis, Insights and Forecast - by Type
- 8. Asia Pacific Events and Exhibition Market Analysis, Insights and Forecast, 2019-2031
- 8.1. Market Analysis, Insights and Forecast - by Type
- 8.1.1. B2B
- 8.1.2. B2C
- 8.1.3. Mixed/Hybrid
- 8.2. Market Analysis, Insights and Forecast - by Revenue Stream
- 8.2.1. Exhibitor Fee
- 8.2.2. Sponsorship Fee
- 8.2.3. Entrance Fee
- 8.2.4. Services
- 8.3. Market Analysis, Insights and Forecast - by End User
- 8.3.1. Consumer Goods and Retail Sector
- 8.3.2. Automotive and Transportation Sector
- 8.3.3. Industrial
- 8.3.4. Entertainment
- 8.3.5. Real Estate and Property
- 8.3.6. Hospitality Sector
- 8.3.7. Other End Users
- 8.1. Market Analysis, Insights and Forecast - by Type
- 9. Latin America Events and Exhibition Market Analysis, Insights and Forecast, 2019-2031
- 9.1. Market Analysis, Insights and Forecast - by Type
- 9.1.1. B2B
- 9.1.2. B2C
- 9.1.3. Mixed/Hybrid
- 9.2. Market Analysis, Insights and Forecast - by Revenue Stream
- 9.2.1. Exhibitor Fee
- 9.2.2. Sponsorship Fee
- 9.2.3. Entrance Fee
- 9.2.4. Services
- 9.3. Market Analysis, Insights and Forecast - by End User
- 9.3.1. Consumer Goods and Retail Sector
- 9.3.2. Automotive and Transportation Sector
- 9.3.3. Industrial
- 9.3.4. Entertainment
- 9.3.5. Real Estate and Property
- 9.3.6. Hospitality Sector
- 9.3.7. Other End Users
- 9.1. Market Analysis, Insights and Forecast - by Type
- 10. Middle East and Africa Events and Exhibition Market Analysis, Insights and Forecast, 2019-2031
- 10.1. Market Analysis, Insights and Forecast - by Type
- 10.1.1. B2B
- 10.1.2. B2C
- 10.1.3. Mixed/Hybrid
- 10.2. Market Analysis, Insights and Forecast - by Revenue Stream
- 10.2.1. Exhibitor Fee
- 10.2.2. Sponsorship Fee
- 10.2.3. Entrance Fee
- 10.2.4. Services
- 10.3. Market Analysis, Insights and Forecast - by End User
- 10.3.1. Consumer Goods and Retail Sector
- 10.3.2. Automotive and Transportation Sector
- 10.3.3. Industrial
- 10.3.4. Entertainment
- 10.3.5. Real Estate and Property
- 10.3.6. Hospitality Sector
- 10.3.7. Other End Users
- 10.1. Market Analysis, Insights and Forecast - by Type
- 11. North America Events and Exhibition Market Analysis, Insights and Forecast, 2019-2031
- 11.1. Market Analysis, Insights and Forecast - By Country/Sub-region
- 11.1.1 United States
- 11.1.2 Canada
- 11.1.3 Mexico
- 12. Europe Events and Exhibition Market Analysis, Insights and Forecast, 2019-2031
- 12.1. Market Analysis, Insights and Forecast - By Country/Sub-region
- 12.1.1 Germany
- 12.1.2 United Kingdom
- 12.1.3 France
- 12.1.4 Spain
- 12.1.5 Italy
- 12.1.6 Spain
- 12.1.7 Belgium
- 12.1.8 Netherland
- 12.1.9 Nordics
- 12.1.10 Rest of Europe
- 13. Asia Pacific Events and Exhibition Market Analysis, Insights and Forecast, 2019-2031
- 13.1. Market Analysis, Insights and Forecast - By Country/Sub-region
- 13.1.1 China
- 13.1.2 Japan
- 13.1.3 India
- 13.1.4 South Korea
- 13.1.5 Southeast Asia
- 13.1.6 Australia
- 13.1.7 Indonesia
- 13.1.8 Phillipes
- 13.1.9 Singapore
- 13.1.10 Thailandc
- 13.1.11 Rest of Asia Pacific
- 14. South America Events and Exhibition Market Analysis, Insights and Forecast, 2019-2031
- 14.1. Market Analysis, Insights and Forecast - By Country/Sub-region
- 14.1.1 Brazil
- 14.1.2 Argentina
- 14.1.3 Peru
- 14.1.4 Chile
- 14.1.5 Colombia
- 14.1.6 Ecuador
- 14.1.7 Venezuela
- 14.1.8 Rest of South America
- 15. North America Events and Exhibition Market Analysis, Insights and Forecast, 2019-2031
- 15.1. Market Analysis, Insights and Forecast - By Country/Sub-region
- 15.1.1 United States
- 15.1.2 Canada
- 15.1.3 Mexico
- 16. MEA Events and Exhibition Market Analysis, Insights and Forecast, 2019-2031
- 16.1. Market Analysis, Insights and Forecast - By Country/Sub-region
- 16.1.1 United Arab Emirates
- 16.1.2 Saudi Arabia
- 16.1.3 South Africa
- 16.1.4 Rest of Middle East and Africa
- 17. Competitive Analysis
- 17.1. Global Market Share Analysis 2024
- 17.2. Company Profiles
- 17.2.1 Deutsche Messe AG
- 17.2.1.1. Overview
- 17.2.1.2. Products
- 17.2.1.3. SWOT Analysis
- 17.2.1.4. Recent Developments
- 17.2.1.5. Financials (Based on Availability)
- 17.2.2 GL Events
- 17.2.2.1. Overview
- 17.2.2.2. Products
- 17.2.2.3. SWOT Analysis
- 17.2.2.4. Recent Developments
- 17.2.2.5. Financials (Based on Availability)
- 17.2.3 Messe Frankfurt GmbH
- 17.2.3.1. Overview
- 17.2.3.2. Products
- 17.2.3.3. SWOT Analysis
- 17.2.3.4. Recent Developments
- 17.2.3.5. Financials (Based on Availability)
- 17.2.4 Viparis Holding
- 17.2.4.1. Overview
- 17.2.4.2. Products
- 17.2.4.3. SWOT Analysis
- 17.2.4.4. Recent Developments
- 17.2.4.5. Financials (Based on Availability)
- 17.2.5 Comexposium Grou
- 17.2.5.1. Overview
- 17.2.5.2. Products
- 17.2.5.3. SWOT Analysis
- 17.2.5.4. Recent Developments
- 17.2.5.5. Financials (Based on Availability)
- 17.2.6 Koelnmesse GmbH
- 17.2.6.1. Overview
- 17.2.6.2. Products
- 17.2.6.3. SWOT Analysis
- 17.2.6.4. Recent Developments
- 17.2.6.5. Financials (Based on Availability)
- 17.2.7 Messe Dsseldorf GmbH
- 17.2.7.1. Overview
- 17.2.7.2. Products
- 17.2.7.3. SWOT Analysis
- 17.2.7.4. Recent Developments
- 17.2.7.5. Financials (Based on Availability)
- 17.2.8 Percept Limited
- 17.2.8.1. Overview
- 17.2.8.2. Products
- 17.2.8.3. SWOT Analysis
- 17.2.8.4. Recent Developments
- 17.2.8.5. Financials (Based on Availability)
- 17.2.9 Fiera Milano SpA
- 17.2.9.1. Overview
- 17.2.9.2. Products
- 17.2.9.3. SWOT Analysis
- 17.2.9.4. Recent Developments
- 17.2.9.5. Financials (Based on Availability)
- 17.2.10 MCH Group AG
- 17.2.10.1. Overview
- 17.2.10.2. Products
- 17.2.10.3. SWOT Analysis
- 17.2.10.4. Recent Developments
- 17.2.10.5. Financials (Based on Availability)
- 17.2.1 Deutsche Messe AG
List of Figures
- Figure 1: Global Events and Exhibition Market Revenue Breakdown (Million, %) by Region 2024 & 2032
- Figure 2: North America Events and Exhibition Market Revenue (Million), by Country 2024 & 2032
- Figure 3: North America Events and Exhibition Market Revenue Share (%), by Country 2024 & 2032
- Figure 4: Europe Events and Exhibition Market Revenue (Million), by Country 2024 & 2032
- Figure 5: Europe Events and Exhibition Market Revenue Share (%), by Country 2024 & 2032
- Figure 6: Asia Pacific Events and Exhibition Market Revenue (Million), by Country 2024 & 2032
- Figure 7: Asia Pacific Events and Exhibition Market Revenue Share (%), by Country 2024 & 2032
- Figure 8: South America Events and Exhibition Market Revenue (Million), by Country 2024 & 2032
- Figure 9: South America Events and Exhibition Market Revenue Share (%), by Country 2024 & 2032
- Figure 10: North America Events and Exhibition Market Revenue (Million), by Country 2024 & 2032
- Figure 11: North America Events and Exhibition Market Revenue Share (%), by Country 2024 & 2032
- Figure 12: MEA Events and Exhibition Market Revenue (Million), by Country 2024 & 2032
- Figure 13: MEA Events and Exhibition Market Revenue Share (%), by Country 2024 & 2032
- Figure 14: North America Events and Exhibition Market Revenue (Million), by Type 2024 & 2032
- Figure 15: North America Events and Exhibition Market Revenue Share (%), by Type 2024 & 2032
- Figure 16: North America Events and Exhibition Market Revenue (Million), by Revenue Stream 2024 & 2032
- Figure 17: North America Events and Exhibition Market Revenue Share (%), by Revenue Stream 2024 & 2032
- Figure 18: North America Events and Exhibition Market Revenue (Million), by End User 2024 & 2032
- Figure 19: North America Events and Exhibition Market Revenue Share (%), by End User 2024 & 2032
- Figure 20: North America Events and Exhibition Market Revenue (Million), by Country 2024 & 2032
- Figure 21: North America Events and Exhibition Market Revenue Share (%), by Country 2024 & 2032
- Figure 22: Europe Events and Exhibition Market Revenue (Million), by Type 2024 & 2032
- Figure 23: Europe Events and Exhibition Market Revenue Share (%), by Type 2024 & 2032
- Figure 24: Europe Events and Exhibition Market Revenue (Million), by Revenue Stream 2024 & 2032
- Figure 25: Europe Events and Exhibition Market Revenue Share (%), by Revenue Stream 2024 & 2032
- Figure 26: Europe Events and Exhibition Market Revenue (Million), by End User 2024 & 2032
- Figure 27: Europe Events and Exhibition Market Revenue Share (%), by End User 2024 & 2032
- Figure 28: Europe Events and Exhibition Market Revenue (Million), by Country 2024 & 2032
- Figure 29: Europe Events and Exhibition Market Revenue Share (%), by Country 2024 & 2032
- Figure 30: Asia Pacific Events and Exhibition Market Revenue (Million), by Type 2024 & 2032
- Figure 31: Asia Pacific Events and Exhibition Market Revenue Share (%), by Type 2024 & 2032
- Figure 32: Asia Pacific Events and Exhibition Market Revenue (Million), by Revenue Stream 2024 & 2032
- Figure 33: Asia Pacific Events and Exhibition Market Revenue Share (%), by Revenue Stream 2024 & 2032
- Figure 34: Asia Pacific Events and Exhibition Market Revenue (Million), by End User 2024 & 2032
- Figure 35: Asia Pacific Events and Exhibition Market Revenue Share (%), by End User 2024 & 2032
- Figure 36: Asia Pacific Events and Exhibition Market Revenue (Million), by Country 2024 & 2032
- Figure 37: Asia Pacific Events and Exhibition Market Revenue Share (%), by Country 2024 & 2032
- Figure 38: Latin America Events and Exhibition Market Revenue (Million), by Type 2024 & 2032
- Figure 39: Latin America Events and Exhibition Market Revenue Share (%), by Type 2024 & 2032
- Figure 40: Latin America Events and Exhibition Market Revenue (Million), by Revenue Stream 2024 & 2032
- Figure 41: Latin America Events and Exhibition Market Revenue Share (%), by Revenue Stream 2024 & 2032
- Figure 42: Latin America Events and Exhibition Market Revenue (Million), by End User 2024 & 2032
- Figure 43: Latin America Events and Exhibition Market Revenue Share (%), by End User 2024 & 2032
- Figure 44: Latin America Events and Exhibition Market Revenue (Million), by Country 2024 & 2032
- Figure 45: Latin America Events and Exhibition Market Revenue Share (%), by Country 2024 & 2032
- Figure 46: Middle East and Africa Events and Exhibition Market Revenue (Million), by Type 2024 & 2032
- Figure 47: Middle East and Africa Events and Exhibition Market Revenue Share (%), by Type 2024 & 2032
- Figure 48: Middle East and Africa Events and Exhibition Market Revenue (Million), by Revenue Stream 2024 & 2032
- Figure 49: Middle East and Africa Events and Exhibition Market Revenue Share (%), by Revenue Stream 2024 & 2032
- Figure 50: Middle East and Africa Events and Exhibition Market Revenue (Million), by End User 2024 & 2032
- Figure 51: Middle East and Africa Events and Exhibition Market Revenue Share (%), by End User 2024 & 2032
- Figure 52: Middle East and Africa Events and Exhibition Market Revenue (Million), by Country 2024 & 2032
- Figure 53: Middle East and Africa Events and Exhibition Market Revenue Share (%), by Country 2024 & 2032
List of Tables
- Table 1: Global Events and Exhibition Market Revenue Million Forecast, by Region 2019 & 2032
- Table 2: Global Events and Exhibition Market Revenue Million Forecast, by Type 2019 & 2032
- Table 3: Global Events and Exhibition Market Revenue Million Forecast, by Revenue Stream 2019 & 2032
- Table 4: Global Events and Exhibition Market Revenue Million Forecast, by End User 2019 & 2032
- Table 5: Global Events and Exhibition Market Revenue Million Forecast, by Region 2019 & 2032
- Table 6: Global Events and Exhibition Market Revenue Million Forecast, by Country 2019 & 2032
- Table 7: United States Events and Exhibition Market Revenue (Million) Forecast, by Application 2019 & 2032
- Table 8: Canada Events and Exhibition Market Revenue (Million) Forecast, by Application 2019 & 2032
- Table 9: Mexico Events and Exhibition Market Revenue (Million) Forecast, by Application 2019 & 2032
- Table 10: Global Events and Exhibition Market Revenue Million Forecast, by Country 2019 & 2032
- Table 11: Germany Events and Exhibition Market Revenue (Million) Forecast, by Application 2019 & 2032
- Table 12: United Kingdom Events and Exhibition Market Revenue (Million) Forecast, by Application 2019 & 2032
- Table 13: France Events and Exhibition Market Revenue (Million) Forecast, by Application 2019 & 2032
- Table 14: Spain Events and Exhibition Market Revenue (Million) Forecast, by Application 2019 & 2032
- Table 15: Italy Events and Exhibition Market Revenue (Million) Forecast, by Application 2019 & 2032
- Table 16: Spain Events and Exhibition Market Revenue (Million) Forecast, by Application 2019 & 2032
- Table 17: Belgium Events and Exhibition Market Revenue (Million) Forecast, by Application 2019 & 2032
- Table 18: Netherland Events and Exhibition Market Revenue (Million) Forecast, by Application 2019 & 2032
- Table 19: Nordics Events and Exhibition Market Revenue (Million) Forecast, by Application 2019 & 2032
- Table 20: Rest of Europe Events and Exhibition Market Revenue (Million) Forecast, by Application 2019 & 2032
- Table 21: Global Events and Exhibition Market Revenue Million Forecast, by Country 2019 & 2032
- Table 22: China Events and Exhibition Market Revenue (Million) Forecast, by Application 2019 & 2032
- Table 23: Japan Events and Exhibition Market Revenue (Million) Forecast, by Application 2019 & 2032
- Table 24: India Events and Exhibition Market Revenue (Million) Forecast, by Application 2019 & 2032
- Table 25: South Korea Events and Exhibition Market Revenue (Million) Forecast, by Application 2019 & 2032
- Table 26: Southeast Asia Events and Exhibition Market Revenue (Million) Forecast, by Application 2019 & 2032
- Table 27: Australia Events and Exhibition Market Revenue (Million) Forecast, by Application 2019 & 2032
- Table 28: Indonesia Events and Exhibition Market Revenue (Million) Forecast, by Application 2019 & 2032
- Table 29: Phillipes Events and Exhibition Market Revenue (Million) Forecast, by Application 2019 & 2032
- Table 30: Singapore Events and Exhibition Market Revenue (Million) Forecast, by Application 2019 & 2032
- Table 31: Thailandc Events and Exhibition Market Revenue (Million) Forecast, by Application 2019 & 2032
- Table 32: Rest of Asia Pacific Events and Exhibition Market Revenue (Million) Forecast, by Application 2019 & 2032
- Table 33: Global Events and Exhibition Market Revenue Million Forecast, by Country 2019 & 2032
- Table 34: Brazil Events and Exhibition Market Revenue (Million) Forecast, by Application 2019 & 2032
- Table 35: Argentina Events and Exhibition Market Revenue (Million) Forecast, by Application 2019 & 2032
- Table 36: Peru Events and Exhibition Market Revenue (Million) Forecast, by Application 2019 & 2032
- Table 37: Chile Events and Exhibition Market Revenue (Million) Forecast, by Application 2019 & 2032
- Table 38: Colombia Events and Exhibition Market Revenue (Million) Forecast, by Application 2019 & 2032
- Table 39: Ecuador Events and Exhibition Market Revenue (Million) Forecast, by Application 2019 & 2032
- Table 40: Venezuela Events and Exhibition Market Revenue (Million) Forecast, by Application 2019 & 2032
- Table 41: Rest of South America Events and Exhibition Market Revenue (Million) Forecast, by Application 2019 & 2032
- Table 42: Global Events and Exhibition Market Revenue Million Forecast, by Country 2019 & 2032
- Table 43: United States Events and Exhibition Market Revenue (Million) Forecast, by Application 2019 & 2032
- Table 44: Canada Events and Exhibition Market Revenue (Million) Forecast, by Application 2019 & 2032
- Table 45: Mexico Events and Exhibition Market Revenue (Million) Forecast, by Application 2019 & 2032
- Table 46: Global Events and Exhibition Market Revenue Million Forecast, by Country 2019 & 2032
- Table 47: United Arab Emirates Events and Exhibition Market Revenue (Million) Forecast, by Application 2019 & 2032
- Table 48: Saudi Arabia Events and Exhibition Market Revenue (Million) Forecast, by Application 2019 & 2032
- Table 49: South Africa Events and Exhibition Market Revenue (Million) Forecast, by Application 2019 & 2032
- Table 50: Rest of Middle East and Africa Events and Exhibition Market Revenue (Million) Forecast, by Application 2019 & 2032
- Table 51: Global Events and Exhibition Market Revenue Million Forecast, by Type 2019 & 2032
- Table 52: Global Events and Exhibition Market Revenue Million Forecast, by Revenue Stream 2019 & 2032
- Table 53: Global Events and Exhibition Market Revenue Million Forecast, by End User 2019 & 2032
- Table 54: Global Events and Exhibition Market Revenue Million Forecast, by Country 2019 & 2032
- Table 55: United States Events and Exhibition Market Revenue (Million) Forecast, by Application 2019 & 2032
- Table 56: Canada Events and Exhibition Market Revenue (Million) Forecast, by Application 2019 & 2032
- Table 57: Global Events and Exhibition Market Revenue Million Forecast, by Type 2019 & 2032
- Table 58: Global Events and Exhibition Market Revenue Million Forecast, by Revenue Stream 2019 & 2032
- Table 59: Global Events and Exhibition Market Revenue Million Forecast, by End User 2019 & 2032
- Table 60: Global Events and Exhibition Market Revenue Million Forecast, by Country 2019 & 2032
- Table 61: Germany Events and Exhibition Market Revenue (Million) Forecast, by Application 2019 & 2032
- Table 62: United Kingdom Events and Exhibition Market Revenue (Million) Forecast, by Application 2019 & 2032
- Table 63: France Events and Exhibition Market Revenue (Million) Forecast, by Application 2019 & 2032
- Table 64: Global Events and Exhibition Market Revenue Million Forecast, by Type 2019 & 2032
- Table 65: Global Events and Exhibition Market Revenue Million Forecast, by Revenue Stream 2019 & 2032
- Table 66: Global Events and Exhibition Market Revenue Million Forecast, by End User 2019 & 2032
- Table 67: Global Events and Exhibition Market Revenue Million Forecast, by Country 2019 & 2032
- Table 68: China Events and Exhibition Market Revenue (Million) Forecast, by Application 2019 & 2032
- Table 69: Japan Events and Exhibition Market Revenue (Million) Forecast, by Application 2019 & 2032
- Table 70: India Events and Exhibition Market Revenue (Million) Forecast, by Application 2019 & 2032
- Table 71: South Korea Events and Exhibition Market Revenue (Million) Forecast, by Application 2019 & 2032
- Table 72: Australia and New Zealand Events and Exhibition Market Revenue (Million) Forecast, by Application 2019 & 2032
- Table 73: Global Events and Exhibition Market Revenue Million Forecast, by Type 2019 & 2032
- Table 74: Global Events and Exhibition Market Revenue Million Forecast, by Revenue Stream 2019 & 2032
- Table 75: Global Events and Exhibition Market Revenue Million Forecast, by End User 2019 & 2032
- Table 76: Global Events and Exhibition Market Revenue Million Forecast, by Country 2019 & 2032
- Table 77: Global Events and Exhibition Market Revenue Million Forecast, by Type 2019 & 2032
- Table 78: Global Events and Exhibition Market Revenue Million Forecast, by Revenue Stream 2019 & 2032
- Table 79: Global Events and Exhibition Market Revenue Million Forecast, by End User 2019 & 2032
- Table 80: Global Events and Exhibition Market Revenue Million Forecast, by Country 2019 & 2032
Frequently Asked Questions
1. What is the projected Compound Annual Growth Rate (CAGR) of the Events and Exhibition Market?
The projected CAGR is approximately 5.29%.
2. Which companies are prominent players in the Events and Exhibition Market?
Key companies in the market include Deutsche Messe AG, GL Events, Messe Frankfurt GmbH, Viparis Holding, Comexposium Grou, Koelnmesse GmbH, Messe Dsseldorf GmbH, Percept Limited, Fiera Milano SpA, MCH Group AG.
3. What are the main segments of the Events and Exhibition Market?
The market segments include Type, Revenue Stream, End User.
4. Can you provide details about the market size?
The market size is estimated to be USD 54.30 Million as of 2022.
5. What are some drivers contributing to market growth?
Growing Adoption of Geo-Cloning for Exhibition Organizers; Increasing Growth of Consumer Goods Penetrates the Growth of B2C Exhibition.
6. What are the notable trends driving market growth?
Entertainment Sector to Witness Fastest Growth.
7. Are there any restraints impacting market growth?
Loss Due to Restrictions of Smaller Players to Participate Owing to Potential Low Turnouts.
8. Can you provide examples of recent developments in the market?
November 2023 - Art Design Chicago, an initiative of the Terra Foundation for American Art in partnership with local artists and arts organizations, is a citywide collaboration and series of events and exhibitions that highlight the voices and stories that are part of the city's unique artistic heritage and creative communities. Continuing into 2025, more than 50 Chicago-area arts organizations across 30 Chicago neighborhoods and several suburban communities showcase the work of hundreds of artists.
9. What pricing options are available for accessing the report?
Pricing options include single-user, multi-user, and enterprise licenses priced at USD 4750, USD 5250, and USD 8750 respectively.
10. Is the market size provided in terms of value or volume?
The market size is provided in terms of value, measured in Million.
11. Are there any specific market keywords associated with the report?
Yes, the market keyword associated with the report is "Events and Exhibition Market," which aids in identifying and referencing the specific market segment covered.
12. How do I determine which pricing option suits my needs best?
The pricing options vary based on user requirements and access needs. Individual users may opt for single-user licenses, while businesses requiring broader access may choose multi-user or enterprise licenses for cost-effective access to the report.
13. Are there any additional resources or data provided in the Events and Exhibition Market report?
While the report offers comprehensive insights, it's advisable to review the specific contents or supplementary materials provided to ascertain if additional resources or data are available.
14. How can I stay updated on further developments or reports in the Events and Exhibition Market?
To stay informed about further developments, trends, and reports in the Events and Exhibition Market, consider subscribing to industry newsletters, following relevant companies and organizations, or regularly checking reputable industry news sources and publications.
Methodology
Step 1 - Identification of Relevant Samples Size from Population Database


Step 2 - Approaches for Defining Global Market Size (Value, Volume* & Price*)

Note*: In applicable scenarios
Step 3 - Data Sources
Primary Research
- Web Analytics
- Survey Reports
- Research Institute
- Latest Research Reports
- Opinion Leaders
Secondary Research
- Annual Reports
- White Paper
- Latest Press Release
- Industry Association
- Paid Database
- Investor Presentations

Step 4 - Data Triangulation
Involves using different sources of information in order to increase the validity of a study
These sources are likely to be stakeholders in a program - participants, other researchers, program staff, other community members, and so on.
Then we put all data in single framework & apply various statistical tools to find out the dynamic on the market.
During the analysis stage, feedback from the stakeholder groups would be compared to determine areas of agreement as well as areas of divergence
