

Key Insights
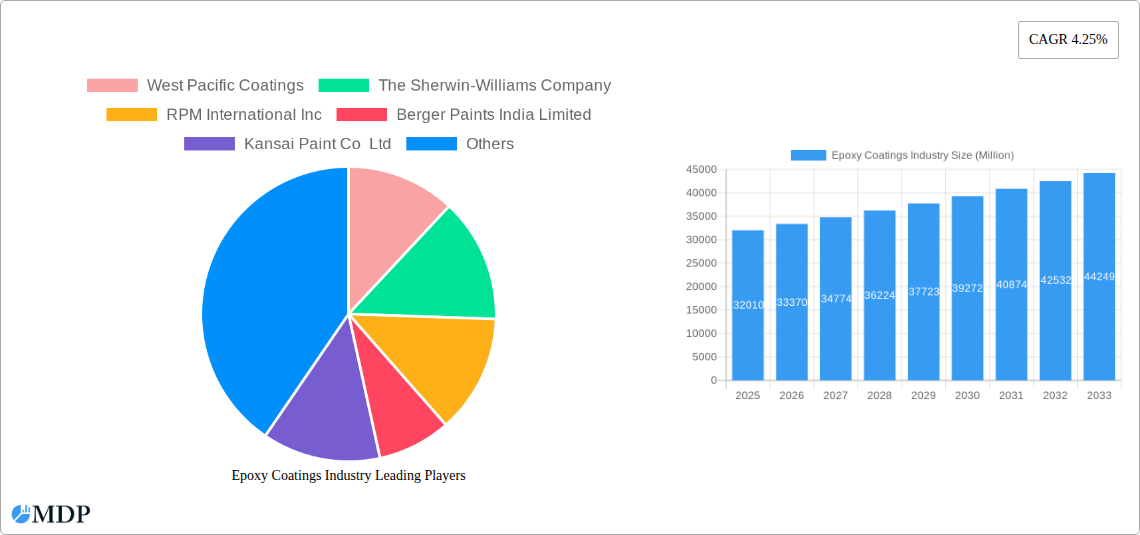
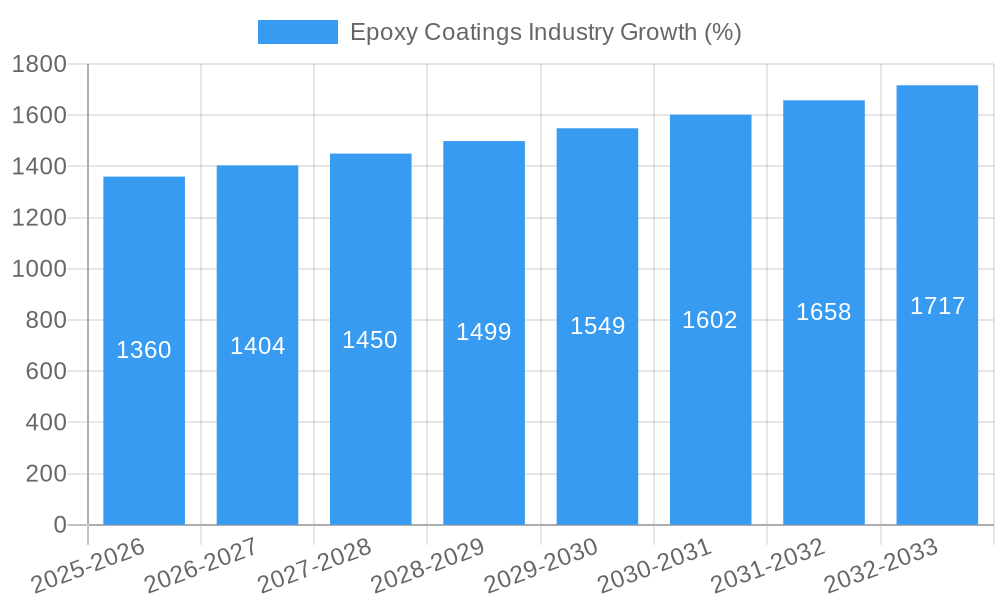
The global epoxy coatings market, valued at $32.01 billion in 2025, is projected to experience robust growth, driven by the increasing demand from various end-use sectors. A compound annual growth rate (CAGR) of 4.25% from 2025 to 2033 signifies a substantial market expansion. Key drivers include the rising construction activity globally, particularly in developing economies, coupled with the growing need for durable and protective coatings in the automotive and transportation industries. The inherent properties of epoxy coatings—high chemical resistance, excellent adhesion, and superior mechanical strength—make them ideal for applications demanding long-term performance and protection against corrosion and wear. Further fueling market growth is the increasing adoption of water-based epoxy coatings due to their environmentally friendly nature and stricter regulations on volatile organic compounds (VOCs). However, fluctuating raw material prices and the potential for substitute materials pose challenges to sustained market growth. The market segmentation reveals a significant contribution from the building and construction sector, followed by the automotive and industrial segments. Technological advancements focusing on improved durability, faster curing times, and enhanced aesthetics are expected to further shape market dynamics. Competition among major players like Sherwin-Williams, PPG Industries, and Nippon Paint is intense, leading to innovation and diverse product offerings.
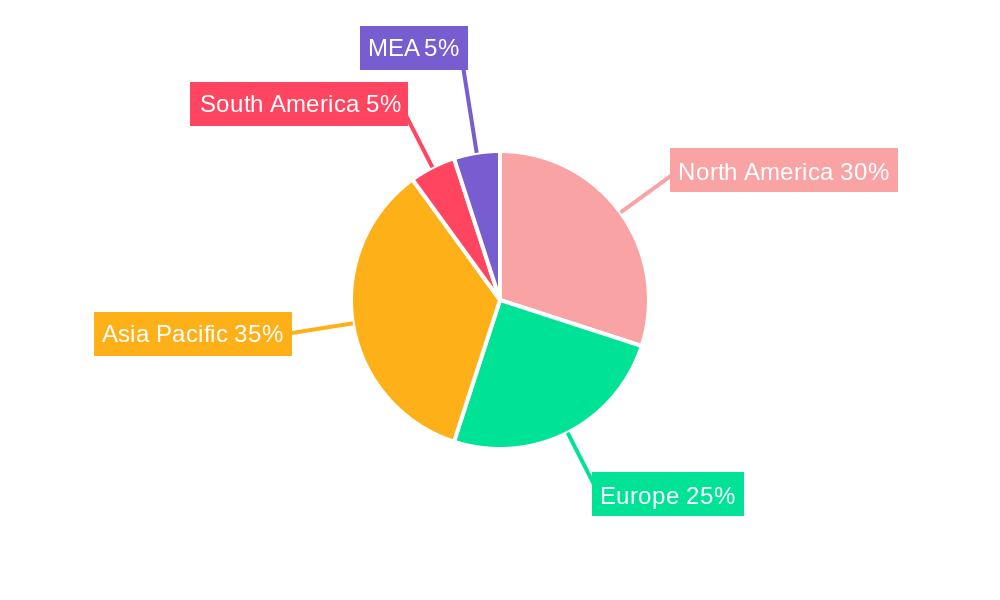
The regional landscape showcases a significant presence of North America and Europe, driven by established infrastructure and robust industrial activity. However, the Asia-Pacific region is anticipated to exhibit substantial growth over the forecast period due to rapid urbanization, infrastructure development, and rising industrialization in countries like China and India. The market is expected to witness strategic collaborations, mergers and acquisitions, and product launches as companies strive to capture market share and cater to the diverse needs of different industries. Continued research and development efforts in developing sustainable and high-performance epoxy coatings will be crucial in shaping the future trajectory of this market. The long-term outlook for the epoxy coatings market remains positive, with continuous growth expected as global infrastructure projects and industrial activities expand.
Epoxy Coatings Industry: A Comprehensive Market Report (2019-2033)
This comprehensive report provides an in-depth analysis of the global Epoxy Coatings Industry, offering invaluable insights for stakeholders, investors, and industry professionals. With a study period spanning 2019-2033, a base year of 2025, and a forecast period of 2025-2033, this report covers market dynamics, trends, leading players, and future growth opportunities. The report utilizes real data and predicted values where necessary, ensuring actionable insights without placeholders. The total market size is predicted to be xx Million by 2033.
Epoxy Coatings Industry Market Dynamics & Concentration
The global epoxy coatings market exhibits a moderately consolidated structure, with key players like Sherwin-Williams, PPG Industries, and BASF holding significant market share. The market share of the top 5 players is estimated to be around xx%. Innovation plays a crucial role, driven by the demand for high-performance, sustainable, and specialized coatings. Stringent environmental regulations, particularly regarding volatile organic compounds (VOCs), are shaping product development and influencing market dynamics. The industry witnesses continuous M&A activities, with approximately xx deals recorded between 2019 and 2024, primarily focused on expanding product portfolios and geographic reach. Product substitutes, such as polyurethane coatings, pose a competitive threat, particularly in specific niche applications. However, the superior properties of epoxy coatings, including high durability, chemical resistance, and excellent adhesion, sustain their dominant position. End-user trends, like increasing infrastructure development and the growing automotive sector, are significant growth drivers.
- Market Concentration: Moderately consolidated, top 5 players holding xx% market share.
- Innovation Drivers: Demand for high-performance, sustainable coatings.
- Regulatory Frameworks: Stringent VOC regulations influencing product development.
- Product Substitutes: Polyurethane coatings present competition in niche applications.
- End-User Trends: Growing infrastructure and automotive sectors fuel demand.
- M&A Activities: Approximately xx deals recorded from 2019 to 2024.
Epoxy Coatings Industry Industry Trends & Analysis
The global epoxy coatings market is projected to register a CAGR of xx% during the forecast period (2025-2033), driven by robust growth in construction, automotive, and industrial sectors. Technological disruptions, such as the development of water-based and powder-based epoxy coatings, are gaining traction due to their environmental benefits and improved performance characteristics. Consumer preferences are shifting towards sustainable and eco-friendly options, prompting manufacturers to innovate and offer greener solutions. Market penetration of water-based epoxy coatings is steadily increasing, reaching an estimated xx% in 2024, and is expected to continue its growth trajectory. The competitive landscape is characterized by intense rivalry among established players and emerging entrants, leading to continuous product innovation and price competition. Several factors are hindering market growth, including fluctuating raw material prices and potential economic slowdowns.
Leading Markets & Segments in Epoxy Coatings Industry
The Building and Construction segment dominates the epoxy coatings market, accounting for approximately xx% of the total market value in 2024. This is primarily fueled by the increasing demand for durable and protective floor coatings in commercial and residential buildings. Geographically, the Asia-Pacific region exhibits robust growth, driven by rapid infrastructure development and industrialization. Within technology segments, water-based epoxy coatings are gaining significant traction due to their environmentally friendly nature and are projected to capture a xx% market share by 2033.
- Dominant Segment: Building and Construction (xx% market share in 2024).
- Key Drivers (Building and Construction): Infrastructure development, rising construction activity, and demand for durable flooring solutions.
- Dominant Region: Asia-Pacific, driven by rapid infrastructure development and industrialization.
- Fastest-Growing Technology Segment: Water-based epoxy coatings, projected xx% market share by 2033.
Epoxy Coatings Industry Product Developments
Recent innovations focus on enhancing performance characteristics, such as improved durability, chemical resistance, and faster curing times. The introduction of bio-based epoxy formulations reflects a growing emphasis on sustainability. These developments cater to specific end-user needs, addressing challenges like moisture resistance and corrosion protection in various applications. The market also sees the emergence of specialized epoxy coatings for niche applications like high-traffic areas and food processing facilities.
Key Drivers of Epoxy Coatings Industry Growth
Growth is propelled by several factors: the expansion of construction and infrastructure projects globally, particularly in developing economies; the increasing adoption of epoxy coatings in various industrial sectors due to their superior performance attributes; and the continuous development of technologically advanced, environmentally friendly epoxy formulations. Government regulations encouraging the use of low-VOC coatings also stimulate growth.
Challenges in the Epoxy Coatings Industry Market
The industry faces challenges including price volatility of raw materials, particularly epoxy resins, which directly impacts production costs; the emergence of competitive alternatives like polyurethane coatings, creating pressure on market share; and supply chain disruptions caused by geopolitical events or natural disasters, impacting manufacturing and distribution.
Emerging Opportunities in Epoxy Coatings Industry
Significant growth opportunities exist in emerging markets, particularly in Asia and Africa, due to increasing infrastructure investments; the development and adoption of advanced coatings technologies such as self-healing and antimicrobial epoxy coatings cater to diverse customer needs; and strategic partnerships and collaborations among manufacturers and end-users can unlock new applications and market segments.
Leading Players in the Epoxy Coatings Industry Sector
- West Pacific Coatings
- The Sherwin-Williams Company
- RPM International Inc
- Berger Paints India Limited
- Kansai Paint Co Ltd
- Pidilite Industries Limited
- Koster Bauchemie AG
- PPG Industries Inc
- Nippon Paint Holdings Co Ltd
- BASF SE
- The Euclid Chemical Company
- Wanhua
- Dur-A-Flex Inc
- Tikkurila
- AkzoNobel NV
- Axalta Coating Systems LLC
- Asian Paints
Key Milestones in Epoxy Coatings Industry Industry
- April 2023: Dur-A-Flex Inc. launched Vent-E, a revolutionary epoxy coating for concrete floors exceeding moisture and salt content thresholds of traditional coatings. This significantly expands the applicability of epoxy coatings to challenging environments.
- March 2023: Wanhua Chemical Group showcased innovative coating solutions at the European Coatings Show, emphasizing the shift towards water-based and bio-based formulations. This highlights the industry's focus on sustainability and efficiency.
Strategic Outlook for Epoxy Coatings Industry Market
The future of the epoxy coatings market looks promising, with sustained growth anticipated across various segments and regions. Strategic partnerships, technological innovations, and a focus on sustainability will play a crucial role in shaping future market dynamics. Expanding into emerging markets and developing specialized coatings for niche applications will offer significant growth opportunities for key players.
Epoxy Coatings Industry Segmentation
-
1. Technology
- 1.1. Water-based
- 1.2. Solvent-based
- 1.3. Powder-based
-
2. End-user Industry
- 2.1. Building and Construction
- 2.2. Automotive
- 2.3. Transportation
- 2.4. Industrial
- 2.5. Other End-user Industries
Epoxy Coatings Industry Segmentation By Geography
-
1. Asia Pacific
- 1.1. China
- 1.2. India
- 1.3. Japan
- 1.4. South Korea
- 1.5. Rest of Asia Pacific
-
2. North America
- 2.1. United States
- 2.2. Canada
- 2.3. Mexico
-
3. Europe
- 3.1. Germany
- 3.2. United Kingdom
- 3.3. Italy
- 3.4. France
- 3.5. Rest of Europe
-
4. South America
- 4.1. Brazil
- 4.2. Argentina
- 4.3. Rest of South America
-
5. Middle East and Africa
- 5.1. Saudi Arabia
- 5.2. South Africa
- 5.3. Rest of Middle East and Africa
Epoxy Coatings Industry REPORT HIGHLIGHTS
| Aspects | Details |
|---|---|
| Study Period | 2019-2033 |
| Base Year | 2024 |
| Estimated Year | 2025 |
| Forecast Period | 2025-2033 |
| Historical Period | 2019-2024 |
| Growth Rate | CAGR of 4.25% from 2019-2033 |
| Segmentation |
|
Table of Contents
- 1. Introduction
- 1.1. Research Scope
- 1.2. Market Segmentation
- 1.3. Research Methodology
- 1.4. Definitions and Assumptions
- 2. Executive Summary
- 2.1. Introduction
- 3. Market Dynamics
- 3.1. Introduction
- 3.2. Market Drivers
- 3.2.1. Increasing Demand for Water-borne Epoxy Coatings; Growing Building and Construction Industry; Other Drivers
- 3.3. Market Restrains
- 3.3.1. Stringent Regulation on VOC Emissions; Other Restraints
- 3.4. Market Trends
- 3.4.1. Increasing Demand from the Building and Construction Industry
- 4. Market Factor Analysis
- 4.1. Porters Five Forces
- 4.2. Supply/Value Chain
- 4.3. PESTEL analysis
- 4.4. Market Entropy
- 4.5. Patent/Trademark Analysis
- 5. Global Epoxy Coatings Industry Analysis, Insights and Forecast, 2019-2031
- 5.1. Market Analysis, Insights and Forecast - by Technology
- 5.1.1. Water-based
- 5.1.2. Solvent-based
- 5.1.3. Powder-based
- 5.2. Market Analysis, Insights and Forecast - by End-user Industry
- 5.2.1. Building and Construction
- 5.2.2. Automotive
- 5.2.3. Transportation
- 5.2.4. Industrial
- 5.2.5. Other End-user Industries
- 5.3. Market Analysis, Insights and Forecast - by Region
- 5.3.1. Asia Pacific
- 5.3.2. North America
- 5.3.3. Europe
- 5.3.4. South America
- 5.3.5. Middle East and Africa
- 5.1. Market Analysis, Insights and Forecast - by Technology
- 6. Asia Pacific Epoxy Coatings Industry Analysis, Insights and Forecast, 2019-2031
- 6.1. Market Analysis, Insights and Forecast - by Technology
- 6.1.1. Water-based
- 6.1.2. Solvent-based
- 6.1.3. Powder-based
- 6.2. Market Analysis, Insights and Forecast - by End-user Industry
- 6.2.1. Building and Construction
- 6.2.2. Automotive
- 6.2.3. Transportation
- 6.2.4. Industrial
- 6.2.5. Other End-user Industries
- 6.1. Market Analysis, Insights and Forecast - by Technology
- 7. North America Epoxy Coatings Industry Analysis, Insights and Forecast, 2019-2031
- 7.1. Market Analysis, Insights and Forecast - by Technology
- 7.1.1. Water-based
- 7.1.2. Solvent-based
- 7.1.3. Powder-based
- 7.2. Market Analysis, Insights and Forecast - by End-user Industry
- 7.2.1. Building and Construction
- 7.2.2. Automotive
- 7.2.3. Transportation
- 7.2.4. Industrial
- 7.2.5. Other End-user Industries
- 7.1. Market Analysis, Insights and Forecast - by Technology
- 8. Europe Epoxy Coatings Industry Analysis, Insights and Forecast, 2019-2031
- 8.1. Market Analysis, Insights and Forecast - by Technology
- 8.1.1. Water-based
- 8.1.2. Solvent-based
- 8.1.3. Powder-based
- 8.2. Market Analysis, Insights and Forecast - by End-user Industry
- 8.2.1. Building and Construction
- 8.2.2. Automotive
- 8.2.3. Transportation
- 8.2.4. Industrial
- 8.2.5. Other End-user Industries
- 8.1. Market Analysis, Insights and Forecast - by Technology
- 9. South America Epoxy Coatings Industry Analysis, Insights and Forecast, 2019-2031
- 9.1. Market Analysis, Insights and Forecast - by Technology
- 9.1.1. Water-based
- 9.1.2. Solvent-based
- 9.1.3. Powder-based
- 9.2. Market Analysis, Insights and Forecast - by End-user Industry
- 9.2.1. Building and Construction
- 9.2.2. Automotive
- 9.2.3. Transportation
- 9.2.4. Industrial
- 9.2.5. Other End-user Industries
- 9.1. Market Analysis, Insights and Forecast - by Technology
- 10. Middle East and Africa Epoxy Coatings Industry Analysis, Insights and Forecast, 2019-2031
- 10.1. Market Analysis, Insights and Forecast - by Technology
- 10.1.1. Water-based
- 10.1.2. Solvent-based
- 10.1.3. Powder-based
- 10.2. Market Analysis, Insights and Forecast - by End-user Industry
- 10.2.1. Building and Construction
- 10.2.2. Automotive
- 10.2.3. Transportation
- 10.2.4. Industrial
- 10.2.5. Other End-user Industries
- 10.1. Market Analysis, Insights and Forecast - by Technology
- 11. North America Epoxy Coatings Industry Analysis, Insights and Forecast, 2019-2031
- 11.1. Market Analysis, Insights and Forecast - By Country/Sub-region
- 11.1.1 United States
- 11.1.2 Canada
- 11.1.3 Mexico
- 12. Europe Epoxy Coatings Industry Analysis, Insights and Forecast, 2019-2031
- 12.1. Market Analysis, Insights and Forecast - By Country/Sub-region
- 12.1.1 Germany
- 12.1.2 France
- 12.1.3 Italy
- 12.1.4 United Kingdom
- 12.1.5 Netherlands
- 12.1.6 Rest of Europe
- 13. Asia Pacific Epoxy Coatings Industry Analysis, Insights and Forecast, 2019-2031
- 13.1. Market Analysis, Insights and Forecast - By Country/Sub-region
- 13.1.1 China
- 13.1.2 Japan
- 13.1.3 India
- 13.1.4 South Korea
- 13.1.5 Taiwan
- 13.1.6 Australia
- 13.1.7 Rest of Asia-Pacific
- 14. South America Epoxy Coatings Industry Analysis, Insights and Forecast, 2019-2031
- 14.1. Market Analysis, Insights and Forecast - By Country/Sub-region
- 14.1.1 Brazil
- 14.1.2 Argentina
- 14.1.3 Rest of South America
- 15. MEA Epoxy Coatings Industry Analysis, Insights and Forecast, 2019-2031
- 15.1. Market Analysis, Insights and Forecast - By Country/Sub-region
- 15.1.1 Middle East
- 15.1.2 Africa
- 16. Competitive Analysis
- 16.1. Global Market Share Analysis 2024
- 16.2. Company Profiles
- 16.2.1 West Pacific Coatings
- 16.2.1.1. Overview
- 16.2.1.2. Products
- 16.2.1.3. SWOT Analysis
- 16.2.1.4. Recent Developments
- 16.2.1.5. Financials (Based on Availability)
- 16.2.2 The Sherwin-Williams Company
- 16.2.2.1. Overview
- 16.2.2.2. Products
- 16.2.2.3. SWOT Analysis
- 16.2.2.4. Recent Developments
- 16.2.2.5. Financials (Based on Availability)
- 16.2.3 RPM International Inc
- 16.2.3.1. Overview
- 16.2.3.2. Products
- 16.2.3.3. SWOT Analysis
- 16.2.3.4. Recent Developments
- 16.2.3.5. Financials (Based on Availability)
- 16.2.4 Berger Paints India Limited
- 16.2.4.1. Overview
- 16.2.4.2. Products
- 16.2.4.3. SWOT Analysis
- 16.2.4.4. Recent Developments
- 16.2.4.5. Financials (Based on Availability)
- 16.2.5 Kansai Paint Co Ltd
- 16.2.5.1. Overview
- 16.2.5.2. Products
- 16.2.5.3. SWOT Analysis
- 16.2.5.4. Recent Developments
- 16.2.5.5. Financials (Based on Availability)
- 16.2.6 Pidilite Industries Limited
- 16.2.6.1. Overview
- 16.2.6.2. Products
- 16.2.6.3. SWOT Analysis
- 16.2.6.4. Recent Developments
- 16.2.6.5. Financials (Based on Availability)
- 16.2.7 Koster Bauchemie AG
- 16.2.7.1. Overview
- 16.2.7.2. Products
- 16.2.7.3. SWOT Analysis
- 16.2.7.4. Recent Developments
- 16.2.7.5. Financials (Based on Availability)
- 16.2.8 PPG Industries Inc
- 16.2.8.1. Overview
- 16.2.8.2. Products
- 16.2.8.3. SWOT Analysis
- 16.2.8.4. Recent Developments
- 16.2.8.5. Financials (Based on Availability)
- 16.2.9 Nippon Paint Holdings Co Ltd
- 16.2.9.1. Overview
- 16.2.9.2. Products
- 16.2.9.3. SWOT Analysis
- 16.2.9.4. Recent Developments
- 16.2.9.5. Financials (Based on Availability)
- 16.2.10 BASF SE
- 16.2.10.1. Overview
- 16.2.10.2. Products
- 16.2.10.3. SWOT Analysis
- 16.2.10.4. Recent Developments
- 16.2.10.5. Financials (Based on Availability)
- 16.2.11 The Euclid Chemical Company
- 16.2.11.1. Overview
- 16.2.11.2. Products
- 16.2.11.3. SWOT Analysis
- 16.2.11.4. Recent Developments
- 16.2.11.5. Financials (Based on Availability)
- 16.2.12 Wanhua
- 16.2.12.1. Overview
- 16.2.12.2. Products
- 16.2.12.3. SWOT Analysis
- 16.2.12.4. Recent Developments
- 16.2.12.5. Financials (Based on Availability)
- 16.2.13 Dur-A-Flex Inc
- 16.2.13.1. Overview
- 16.2.13.2. Products
- 16.2.13.3. SWOT Analysis
- 16.2.13.4. Recent Developments
- 16.2.13.5. Financials (Based on Availability)
- 16.2.14 Tikkurila
- 16.2.14.1. Overview
- 16.2.14.2. Products
- 16.2.14.3. SWOT Analysis
- 16.2.14.4. Recent Developments
- 16.2.14.5. Financials (Based on Availability)
- 16.2.15 AkzoNobel NV
- 16.2.15.1. Overview
- 16.2.15.2. Products
- 16.2.15.3. SWOT Analysis
- 16.2.15.4. Recent Developments
- 16.2.15.5. Financials (Based on Availability)
- 16.2.16 Axalta Coating Systems LLC
- 16.2.16.1. Overview
- 16.2.16.2. Products
- 16.2.16.3. SWOT Analysis
- 16.2.16.4. Recent Developments
- 16.2.16.5. Financials (Based on Availability)
- 16.2.17 Asian Paints
- 16.2.17.1. Overview
- 16.2.17.2. Products
- 16.2.17.3. SWOT Analysis
- 16.2.17.4. Recent Developments
- 16.2.17.5. Financials (Based on Availability)
- 16.2.1 West Pacific Coatings
List of Figures
- Figure 1: Global Epoxy Coatings Industry Revenue Breakdown (Million, %) by Region 2024 & 2032
- Figure 2: Global Epoxy Coatings Industry Volume Breakdown (K Tons, %) by Region 2024 & 2032
- Figure 3: North America Epoxy Coatings Industry Revenue (Million), by Country 2024 & 2032
- Figure 4: North America Epoxy Coatings Industry Volume (K Tons), by Country 2024 & 2032
- Figure 5: North America Epoxy Coatings Industry Revenue Share (%), by Country 2024 & 2032
- Figure 6: North America Epoxy Coatings Industry Volume Share (%), by Country 2024 & 2032
- Figure 7: Europe Epoxy Coatings Industry Revenue (Million), by Country 2024 & 2032
- Figure 8: Europe Epoxy Coatings Industry Volume (K Tons), by Country 2024 & 2032
- Figure 9: Europe Epoxy Coatings Industry Revenue Share (%), by Country 2024 & 2032
- Figure 10: Europe Epoxy Coatings Industry Volume Share (%), by Country 2024 & 2032
- Figure 11: Asia Pacific Epoxy Coatings Industry Revenue (Million), by Country 2024 & 2032
- Figure 12: Asia Pacific Epoxy Coatings Industry Volume (K Tons), by Country 2024 & 2032
- Figure 13: Asia Pacific Epoxy Coatings Industry Revenue Share (%), by Country 2024 & 2032
- Figure 14: Asia Pacific Epoxy Coatings Industry Volume Share (%), by Country 2024 & 2032
- Figure 15: South America Epoxy Coatings Industry Revenue (Million), by Country 2024 & 2032
- Figure 16: South America Epoxy Coatings Industry Volume (K Tons), by Country 2024 & 2032
- Figure 17: South America Epoxy Coatings Industry Revenue Share (%), by Country 2024 & 2032
- Figure 18: South America Epoxy Coatings Industry Volume Share (%), by Country 2024 & 2032
- Figure 19: MEA Epoxy Coatings Industry Revenue (Million), by Country 2024 & 2032
- Figure 20: MEA Epoxy Coatings Industry Volume (K Tons), by Country 2024 & 2032
- Figure 21: MEA Epoxy Coatings Industry Revenue Share (%), by Country 2024 & 2032
- Figure 22: MEA Epoxy Coatings Industry Volume Share (%), by Country 2024 & 2032
- Figure 23: Asia Pacific Epoxy Coatings Industry Revenue (Million), by Technology 2024 & 2032
- Figure 24: Asia Pacific Epoxy Coatings Industry Volume (K Tons), by Technology 2024 & 2032
- Figure 25: Asia Pacific Epoxy Coatings Industry Revenue Share (%), by Technology 2024 & 2032
- Figure 26: Asia Pacific Epoxy Coatings Industry Volume Share (%), by Technology 2024 & 2032
- Figure 27: Asia Pacific Epoxy Coatings Industry Revenue (Million), by End-user Industry 2024 & 2032
- Figure 28: Asia Pacific Epoxy Coatings Industry Volume (K Tons), by End-user Industry 2024 & 2032
- Figure 29: Asia Pacific Epoxy Coatings Industry Revenue Share (%), by End-user Industry 2024 & 2032
- Figure 30: Asia Pacific Epoxy Coatings Industry Volume Share (%), by End-user Industry 2024 & 2032
- Figure 31: Asia Pacific Epoxy Coatings Industry Revenue (Million), by Country 2024 & 2032
- Figure 32: Asia Pacific Epoxy Coatings Industry Volume (K Tons), by Country 2024 & 2032
- Figure 33: Asia Pacific Epoxy Coatings Industry Revenue Share (%), by Country 2024 & 2032
- Figure 34: Asia Pacific Epoxy Coatings Industry Volume Share (%), by Country 2024 & 2032
- Figure 35: North America Epoxy Coatings Industry Revenue (Million), by Technology 2024 & 2032
- Figure 36: North America Epoxy Coatings Industry Volume (K Tons), by Technology 2024 & 2032
- Figure 37: North America Epoxy Coatings Industry Revenue Share (%), by Technology 2024 & 2032
- Figure 38: North America Epoxy Coatings Industry Volume Share (%), by Technology 2024 & 2032
- Figure 39: North America Epoxy Coatings Industry Revenue (Million), by End-user Industry 2024 & 2032
- Figure 40: North America Epoxy Coatings Industry Volume (K Tons), by End-user Industry 2024 & 2032
- Figure 41: North America Epoxy Coatings Industry Revenue Share (%), by End-user Industry 2024 & 2032
- Figure 42: North America Epoxy Coatings Industry Volume Share (%), by End-user Industry 2024 & 2032
- Figure 43: North America Epoxy Coatings Industry Revenue (Million), by Country 2024 & 2032
- Figure 44: North America Epoxy Coatings Industry Volume (K Tons), by Country 2024 & 2032
- Figure 45: North America Epoxy Coatings Industry Revenue Share (%), by Country 2024 & 2032
- Figure 46: North America Epoxy Coatings Industry Volume Share (%), by Country 2024 & 2032
- Figure 47: Europe Epoxy Coatings Industry Revenue (Million), by Technology 2024 & 2032
- Figure 48: Europe Epoxy Coatings Industry Volume (K Tons), by Technology 2024 & 2032
- Figure 49: Europe Epoxy Coatings Industry Revenue Share (%), by Technology 2024 & 2032
- Figure 50: Europe Epoxy Coatings Industry Volume Share (%), by Technology 2024 & 2032
- Figure 51: Europe Epoxy Coatings Industry Revenue (Million), by End-user Industry 2024 & 2032
- Figure 52: Europe Epoxy Coatings Industry Volume (K Tons), by End-user Industry 2024 & 2032
- Figure 53: Europe Epoxy Coatings Industry Revenue Share (%), by End-user Industry 2024 & 2032
- Figure 54: Europe Epoxy Coatings Industry Volume Share (%), by End-user Industry 2024 & 2032
- Figure 55: Europe Epoxy Coatings Industry Revenue (Million), by Country 2024 & 2032
- Figure 56: Europe Epoxy Coatings Industry Volume (K Tons), by Country 2024 & 2032
- Figure 57: Europe Epoxy Coatings Industry Revenue Share (%), by Country 2024 & 2032
- Figure 58: Europe Epoxy Coatings Industry Volume Share (%), by Country 2024 & 2032
- Figure 59: South America Epoxy Coatings Industry Revenue (Million), by Technology 2024 & 2032
- Figure 60: South America Epoxy Coatings Industry Volume (K Tons), by Technology 2024 & 2032
- Figure 61: South America Epoxy Coatings Industry Revenue Share (%), by Technology 2024 & 2032
- Figure 62: South America Epoxy Coatings Industry Volume Share (%), by Technology 2024 & 2032
- Figure 63: South America Epoxy Coatings Industry Revenue (Million), by End-user Industry 2024 & 2032
- Figure 64: South America Epoxy Coatings Industry Volume (K Tons), by End-user Industry 2024 & 2032
- Figure 65: South America Epoxy Coatings Industry Revenue Share (%), by End-user Industry 2024 & 2032
- Figure 66: South America Epoxy Coatings Industry Volume Share (%), by End-user Industry 2024 & 2032
- Figure 67: South America Epoxy Coatings Industry Revenue (Million), by Country 2024 & 2032
- Figure 68: South America Epoxy Coatings Industry Volume (K Tons), by Country 2024 & 2032
- Figure 69: South America Epoxy Coatings Industry Revenue Share (%), by Country 2024 & 2032
- Figure 70: South America Epoxy Coatings Industry Volume Share (%), by Country 2024 & 2032
- Figure 71: Middle East and Africa Epoxy Coatings Industry Revenue (Million), by Technology 2024 & 2032
- Figure 72: Middle East and Africa Epoxy Coatings Industry Volume (K Tons), by Technology 2024 & 2032
- Figure 73: Middle East and Africa Epoxy Coatings Industry Revenue Share (%), by Technology 2024 & 2032
- Figure 74: Middle East and Africa Epoxy Coatings Industry Volume Share (%), by Technology 2024 & 2032
- Figure 75: Middle East and Africa Epoxy Coatings Industry Revenue (Million), by End-user Industry 2024 & 2032
- Figure 76: Middle East and Africa Epoxy Coatings Industry Volume (K Tons), by End-user Industry 2024 & 2032
- Figure 77: Middle East and Africa Epoxy Coatings Industry Revenue Share (%), by End-user Industry 2024 & 2032
- Figure 78: Middle East and Africa Epoxy Coatings Industry Volume Share (%), by End-user Industry 2024 & 2032
- Figure 79: Middle East and Africa Epoxy Coatings Industry Revenue (Million), by Country 2024 & 2032
- Figure 80: Middle East and Africa Epoxy Coatings Industry Volume (K Tons), by Country 2024 & 2032
- Figure 81: Middle East and Africa Epoxy Coatings Industry Revenue Share (%), by Country 2024 & 2032
- Figure 82: Middle East and Africa Epoxy Coatings Industry Volume Share (%), by Country 2024 & 2032
List of Tables
- Table 1: Global Epoxy Coatings Industry Revenue Million Forecast, by Region 2019 & 2032
- Table 2: Global Epoxy Coatings Industry Volume K Tons Forecast, by Region 2019 & 2032
- Table 3: Global Epoxy Coatings Industry Revenue Million Forecast, by Technology 2019 & 2032
- Table 4: Global Epoxy Coatings Industry Volume K Tons Forecast, by Technology 2019 & 2032
- Table 5: Global Epoxy Coatings Industry Revenue Million Forecast, by End-user Industry 2019 & 2032
- Table 6: Global Epoxy Coatings Industry Volume K Tons Forecast, by End-user Industry 2019 & 2032
- Table 7: Global Epoxy Coatings Industry Revenue Million Forecast, by Region 2019 & 2032
- Table 8: Global Epoxy Coatings Industry Volume K Tons Forecast, by Region 2019 & 2032
- Table 9: Global Epoxy Coatings Industry Revenue Million Forecast, by Country 2019 & 2032
- Table 10: Global Epoxy Coatings Industry Volume K Tons Forecast, by Country 2019 & 2032
- Table 11: United States Epoxy Coatings Industry Revenue (Million) Forecast, by Application 2019 & 2032
- Table 12: United States Epoxy Coatings Industry Volume (K Tons) Forecast, by Application 2019 & 2032
- Table 13: Canada Epoxy Coatings Industry Revenue (Million) Forecast, by Application 2019 & 2032
- Table 14: Canada Epoxy Coatings Industry Volume (K Tons) Forecast, by Application 2019 & 2032
- Table 15: Mexico Epoxy Coatings Industry Revenue (Million) Forecast, by Application 2019 & 2032
- Table 16: Mexico Epoxy Coatings Industry Volume (K Tons) Forecast, by Application 2019 & 2032
- Table 17: Global Epoxy Coatings Industry Revenue Million Forecast, by Country 2019 & 2032
- Table 18: Global Epoxy Coatings Industry Volume K Tons Forecast, by Country 2019 & 2032
- Table 19: Germany Epoxy Coatings Industry Revenue (Million) Forecast, by Application 2019 & 2032
- Table 20: Germany Epoxy Coatings Industry Volume (K Tons) Forecast, by Application 2019 & 2032
- Table 21: France Epoxy Coatings Industry Revenue (Million) Forecast, by Application 2019 & 2032
- Table 22: France Epoxy Coatings Industry Volume (K Tons) Forecast, by Application 2019 & 2032
- Table 23: Italy Epoxy Coatings Industry Revenue (Million) Forecast, by Application 2019 & 2032
- Table 24: Italy Epoxy Coatings Industry Volume (K Tons) Forecast, by Application 2019 & 2032
- Table 25: United Kingdom Epoxy Coatings Industry Revenue (Million) Forecast, by Application 2019 & 2032
- Table 26: United Kingdom Epoxy Coatings Industry Volume (K Tons) Forecast, by Application 2019 & 2032
- Table 27: Netherlands Epoxy Coatings Industry Revenue (Million) Forecast, by Application 2019 & 2032
- Table 28: Netherlands Epoxy Coatings Industry Volume (K Tons) Forecast, by Application 2019 & 2032
- Table 29: Rest of Europe Epoxy Coatings Industry Revenue (Million) Forecast, by Application 2019 & 2032
- Table 30: Rest of Europe Epoxy Coatings Industry Volume (K Tons) Forecast, by Application 2019 & 2032
- Table 31: Global Epoxy Coatings Industry Revenue Million Forecast, by Country 2019 & 2032
- Table 32: Global Epoxy Coatings Industry Volume K Tons Forecast, by Country 2019 & 2032
- Table 33: China Epoxy Coatings Industry Revenue (Million) Forecast, by Application 2019 & 2032
- Table 34: China Epoxy Coatings Industry Volume (K Tons) Forecast, by Application 2019 & 2032
- Table 35: Japan Epoxy Coatings Industry Revenue (Million) Forecast, by Application 2019 & 2032
- Table 36: Japan Epoxy Coatings Industry Volume (K Tons) Forecast, by Application 2019 & 2032
- Table 37: India Epoxy Coatings Industry Revenue (Million) Forecast, by Application 2019 & 2032
- Table 38: India Epoxy Coatings Industry Volume (K Tons) Forecast, by Application 2019 & 2032
- Table 39: South Korea Epoxy Coatings Industry Revenue (Million) Forecast, by Application 2019 & 2032
- Table 40: South Korea Epoxy Coatings Industry Volume (K Tons) Forecast, by Application 2019 & 2032
- Table 41: Taiwan Epoxy Coatings Industry Revenue (Million) Forecast, by Application 2019 & 2032
- Table 42: Taiwan Epoxy Coatings Industry Volume (K Tons) Forecast, by Application 2019 & 2032
- Table 43: Australia Epoxy Coatings Industry Revenue (Million) Forecast, by Application 2019 & 2032
- Table 44: Australia Epoxy Coatings Industry Volume (K Tons) Forecast, by Application 2019 & 2032
- Table 45: Rest of Asia-Pacific Epoxy Coatings Industry Revenue (Million) Forecast, by Application 2019 & 2032
- Table 46: Rest of Asia-Pacific Epoxy Coatings Industry Volume (K Tons) Forecast, by Application 2019 & 2032
- Table 47: Global Epoxy Coatings Industry Revenue Million Forecast, by Country 2019 & 2032
- Table 48: Global Epoxy Coatings Industry Volume K Tons Forecast, by Country 2019 & 2032
- Table 49: Brazil Epoxy Coatings Industry Revenue (Million) Forecast, by Application 2019 & 2032
- Table 50: Brazil Epoxy Coatings Industry Volume (K Tons) Forecast, by Application 2019 & 2032
- Table 51: Argentina Epoxy Coatings Industry Revenue (Million) Forecast, by Application 2019 & 2032
- Table 52: Argentina Epoxy Coatings Industry Volume (K Tons) Forecast, by Application 2019 & 2032
- Table 53: Rest of South America Epoxy Coatings Industry Revenue (Million) Forecast, by Application 2019 & 2032
- Table 54: Rest of South America Epoxy Coatings Industry Volume (K Tons) Forecast, by Application 2019 & 2032
- Table 55: Global Epoxy Coatings Industry Revenue Million Forecast, by Country 2019 & 2032
- Table 56: Global Epoxy Coatings Industry Volume K Tons Forecast, by Country 2019 & 2032
- Table 57: Middle East Epoxy Coatings Industry Revenue (Million) Forecast, by Application 2019 & 2032
- Table 58: Middle East Epoxy Coatings Industry Volume (K Tons) Forecast, by Application 2019 & 2032
- Table 59: Africa Epoxy Coatings Industry Revenue (Million) Forecast, by Application 2019 & 2032
- Table 60: Africa Epoxy Coatings Industry Volume (K Tons) Forecast, by Application 2019 & 2032
- Table 61: Global Epoxy Coatings Industry Revenue Million Forecast, by Technology 2019 & 2032
- Table 62: Global Epoxy Coatings Industry Volume K Tons Forecast, by Technology 2019 & 2032
- Table 63: Global Epoxy Coatings Industry Revenue Million Forecast, by End-user Industry 2019 & 2032
- Table 64: Global Epoxy Coatings Industry Volume K Tons Forecast, by End-user Industry 2019 & 2032
- Table 65: Global Epoxy Coatings Industry Revenue Million Forecast, by Country 2019 & 2032
- Table 66: Global Epoxy Coatings Industry Volume K Tons Forecast, by Country 2019 & 2032
- Table 67: China Epoxy Coatings Industry Revenue (Million) Forecast, by Application 2019 & 2032
- Table 68: China Epoxy Coatings Industry Volume (K Tons) Forecast, by Application 2019 & 2032
- Table 69: India Epoxy Coatings Industry Revenue (Million) Forecast, by Application 2019 & 2032
- Table 70: India Epoxy Coatings Industry Volume (K Tons) Forecast, by Application 2019 & 2032
- Table 71: Japan Epoxy Coatings Industry Revenue (Million) Forecast, by Application 2019 & 2032
- Table 72: Japan Epoxy Coatings Industry Volume (K Tons) Forecast, by Application 2019 & 2032
- Table 73: South Korea Epoxy Coatings Industry Revenue (Million) Forecast, by Application 2019 & 2032
- Table 74: South Korea Epoxy Coatings Industry Volume (K Tons) Forecast, by Application 2019 & 2032
- Table 75: Rest of Asia Pacific Epoxy Coatings Industry Revenue (Million) Forecast, by Application 2019 & 2032
- Table 76: Rest of Asia Pacific Epoxy Coatings Industry Volume (K Tons) Forecast, by Application 2019 & 2032
- Table 77: Global Epoxy Coatings Industry Revenue Million Forecast, by Technology 2019 & 2032
- Table 78: Global Epoxy Coatings Industry Volume K Tons Forecast, by Technology 2019 & 2032
- Table 79: Global Epoxy Coatings Industry Revenue Million Forecast, by End-user Industry 2019 & 2032
- Table 80: Global Epoxy Coatings Industry Volume K Tons Forecast, by End-user Industry 2019 & 2032
- Table 81: Global Epoxy Coatings Industry Revenue Million Forecast, by Country 2019 & 2032
- Table 82: Global Epoxy Coatings Industry Volume K Tons Forecast, by Country 2019 & 2032
- Table 83: United States Epoxy Coatings Industry Revenue (Million) Forecast, by Application 2019 & 2032
- Table 84: United States Epoxy Coatings Industry Volume (K Tons) Forecast, by Application 2019 & 2032
- Table 85: Canada Epoxy Coatings Industry Revenue (Million) Forecast, by Application 2019 & 2032
- Table 86: Canada Epoxy Coatings Industry Volume (K Tons) Forecast, by Application 2019 & 2032
- Table 87: Mexico Epoxy Coatings Industry Revenue (Million) Forecast, by Application 2019 & 2032
- Table 88: Mexico Epoxy Coatings Industry Volume (K Tons) Forecast, by Application 2019 & 2032
- Table 89: Global Epoxy Coatings Industry Revenue Million Forecast, by Technology 2019 & 2032
- Table 90: Global Epoxy Coatings Industry Volume K Tons Forecast, by Technology 2019 & 2032
- Table 91: Global Epoxy Coatings Industry Revenue Million Forecast, by End-user Industry 2019 & 2032
- Table 92: Global Epoxy Coatings Industry Volume K Tons Forecast, by End-user Industry 2019 & 2032
- Table 93: Global Epoxy Coatings Industry Revenue Million Forecast, by Country 2019 & 2032
- Table 94: Global Epoxy Coatings Industry Volume K Tons Forecast, by Country 2019 & 2032
- Table 95: Germany Epoxy Coatings Industry Revenue (Million) Forecast, by Application 2019 & 2032
- Table 96: Germany Epoxy Coatings Industry Volume (K Tons) Forecast, by Application 2019 & 2032
- Table 97: United Kingdom Epoxy Coatings Industry Revenue (Million) Forecast, by Application 2019 & 2032
- Table 98: United Kingdom Epoxy Coatings Industry Volume (K Tons) Forecast, by Application 2019 & 2032
- Table 99: Italy Epoxy Coatings Industry Revenue (Million) Forecast, by Application 2019 & 2032
- Table 100: Italy Epoxy Coatings Industry Volume (K Tons) Forecast, by Application 2019 & 2032
- Table 101: France Epoxy Coatings Industry Revenue (Million) Forecast, by Application 2019 & 2032
- Table 102: France Epoxy Coatings Industry Volume (K Tons) Forecast, by Application 2019 & 2032
- Table 103: Rest of Europe Epoxy Coatings Industry Revenue (Million) Forecast, by Application 2019 & 2032
- Table 104: Rest of Europe Epoxy Coatings Industry Volume (K Tons) Forecast, by Application 2019 & 2032
- Table 105: Global Epoxy Coatings Industry Revenue Million Forecast, by Technology 2019 & 2032
- Table 106: Global Epoxy Coatings Industry Volume K Tons Forecast, by Technology 2019 & 2032
- Table 107: Global Epoxy Coatings Industry Revenue Million Forecast, by End-user Industry 2019 & 2032
- Table 108: Global Epoxy Coatings Industry Volume K Tons Forecast, by End-user Industry 2019 & 2032
- Table 109: Global Epoxy Coatings Industry Revenue Million Forecast, by Country 2019 & 2032
- Table 110: Global Epoxy Coatings Industry Volume K Tons Forecast, by Country 2019 & 2032
- Table 111: Brazil Epoxy Coatings Industry Revenue (Million) Forecast, by Application 2019 & 2032
- Table 112: Brazil Epoxy Coatings Industry Volume (K Tons) Forecast, by Application 2019 & 2032
- Table 113: Argentina Epoxy Coatings Industry Revenue (Million) Forecast, by Application 2019 & 2032
- Table 114: Argentina Epoxy Coatings Industry Volume (K Tons) Forecast, by Application 2019 & 2032
- Table 115: Rest of South America Epoxy Coatings Industry Revenue (Million) Forecast, by Application 2019 & 2032
- Table 116: Rest of South America Epoxy Coatings Industry Volume (K Tons) Forecast, by Application 2019 & 2032
- Table 117: Global Epoxy Coatings Industry Revenue Million Forecast, by Technology 2019 & 2032
- Table 118: Global Epoxy Coatings Industry Volume K Tons Forecast, by Technology 2019 & 2032
- Table 119: Global Epoxy Coatings Industry Revenue Million Forecast, by End-user Industry 2019 & 2032
- Table 120: Global Epoxy Coatings Industry Volume K Tons Forecast, by End-user Industry 2019 & 2032
- Table 121: Global Epoxy Coatings Industry Revenue Million Forecast, by Country 2019 & 2032
- Table 122: Global Epoxy Coatings Industry Volume K Tons Forecast, by Country 2019 & 2032
- Table 123: Saudi Arabia Epoxy Coatings Industry Revenue (Million) Forecast, by Application 2019 & 2032
- Table 124: Saudi Arabia Epoxy Coatings Industry Volume (K Tons) Forecast, by Application 2019 & 2032
- Table 125: South Africa Epoxy Coatings Industry Revenue (Million) Forecast, by Application 2019 & 2032
- Table 126: South Africa Epoxy Coatings Industry Volume (K Tons) Forecast, by Application 2019 & 2032
- Table 127: Rest of Middle East and Africa Epoxy Coatings Industry Revenue (Million) Forecast, by Application 2019 & 2032
- Table 128: Rest of Middle East and Africa Epoxy Coatings Industry Volume (K Tons) Forecast, by Application 2019 & 2032
Frequently Asked Questions
1. What is the projected Compound Annual Growth Rate (CAGR) of the Epoxy Coatings Industry?
The projected CAGR is approximately 4.25%.
2. Which companies are prominent players in the Epoxy Coatings Industry?
Key companies in the market include West Pacific Coatings, The Sherwin-Williams Company, RPM International Inc, Berger Paints India Limited, Kansai Paint Co Ltd, Pidilite Industries Limited, Koster Bauchemie AG, PPG Industries Inc, Nippon Paint Holdings Co Ltd, BASF SE, The Euclid Chemical Company, Wanhua, Dur-A-Flex Inc, Tikkurila, AkzoNobel NV, Axalta Coating Systems LLC, Asian Paints.
3. What are the main segments of the Epoxy Coatings Industry?
The market segments include Technology, End-user Industry.
4. Can you provide details about the market size?
The market size is estimated to be USD 32.01 Million as of 2022.
5. What are some drivers contributing to market growth?
Increasing Demand for Water-borne Epoxy Coatings; Growing Building and Construction Industry; Other Drivers.
6. What are the notable trends driving market growth?
Increasing Demand from the Building and Construction Industry.
7. Are there any restraints impacting market growth?
Stringent Regulation on VOC Emissions; Other Restraints.
8. Can you provide examples of recent developments in the market?
April 2023: Dur-A-Flex Inc. introduced Vent-E, a revolutionary formulation specially designed to provide additional protection to concrete floors that surpass the moisture and salt content thresholds of traditional epoxy coatings. This coating solution is well-suited for various applications, including commercial buildings, storage areas, warehouse floors, assembly and production areas, and more.
9. What pricing options are available for accessing the report?
Pricing options include single-user, multi-user, and enterprise licenses priced at USD 3,950, USD 4,950, and USD 6,950 respectively.
10. Is the market size provided in terms of value or volume?
The market size is provided in terms of value, measured in Million and volume, measured in K Tons.
11. Are there any specific market keywords associated with the report?
Yes, the market keyword associated with the report is "Epoxy Coatings Industry," which aids in identifying and referencing the specific market segment covered.
12. How do I determine which pricing option suits my needs best?
The pricing options vary based on user requirements and access needs. Individual users may opt for single-user licenses, while businesses requiring broader access may choose multi-user or enterprise licenses for cost-effective access to the report.
13. Are there any additional resources or data provided in the Epoxy Coatings Industry report?
While the report offers comprehensive insights, it's advisable to review the specific contents or supplementary materials provided to ascertain if additional resources or data are available.
14. How can I stay updated on further developments or reports in the Epoxy Coatings Industry?
To stay informed about further developments, trends, and reports in the Epoxy Coatings Industry, consider subscribing to industry newsletters, following relevant companies and organizations, or regularly checking reputable industry news sources and publications.
Methodology
Step 1 - Identification of Relevant Samples Size from Population Database


Step 2 - Approaches for Defining Global Market Size (Value, Volume* & Price*)

Note*: In applicable scenarios
Step 3 - Data Sources
Primary Research
- Web Analytics
- Survey Reports
- Research Institute
- Latest Research Reports
- Opinion Leaders
Secondary Research
- Annual Reports
- White Paper
- Latest Press Release
- Industry Association
- Paid Database
- Investor Presentations

Step 4 - Data Triangulation
Involves using different sources of information in order to increase the validity of a study
These sources are likely to be stakeholders in a program - participants, other researchers, program staff, other community members, and so on.
Then we put all data in single framework & apply various statistical tools to find out the dynamic on the market.
During the analysis stage, feedback from the stakeholder groups would be compared to determine areas of agreement as well as areas of divergence
