

Key Insights
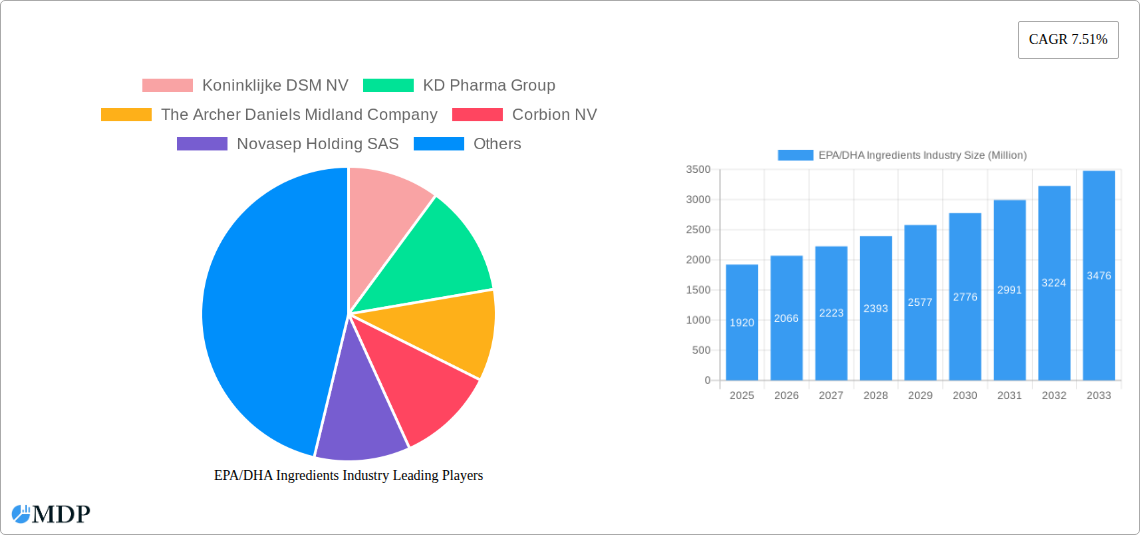
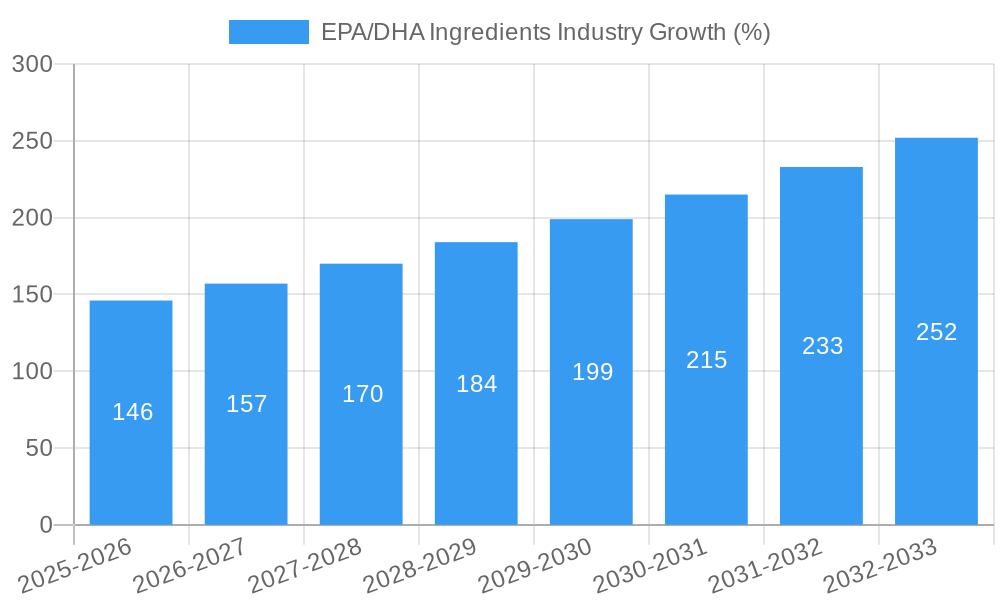
The EPA/DHA Ingredients market, valued at $1.92 billion in 2025, is projected to experience robust growth, driven by increasing consumer awareness of the health benefits associated with omega-3 fatty acids. This surge in demand is fueled by the rising prevalence of cardiovascular diseases and other chronic conditions, where EPA and DHA play a crucial role in disease prevention and management. The market's growth is further propelled by the expanding nutraceutical and functional food sectors, which increasingly incorporate EPA and DHA into their product offerings to cater to health-conscious consumers. Key market trends include a growing preference for sustainable and ethically sourced ingredients, innovation in delivery forms (e.g., capsules, powders, and functional beverages), and the development of more bioavailable and stable EPA/DHA products. Competitive pressures are stimulating manufacturers to focus on efficiency improvements and cost reductions throughout the value chain to maintain market share. While challenges such as fluctuating raw material prices and stringent regulatory requirements exist, the overall market outlook for EPA/DHA ingredients remains optimistic, projecting a steady compound annual growth rate (CAGR) of 7.51% from 2025 to 2033. This growth is expected to be geographically diverse, with North America and Europe maintaining significant market shares, but also substantial growth opportunities emerging in Asia-Pacific and other developing regions.
The major players in the EPA/DHA ingredients market, including Koninklijke DSM NV, KD Pharma Group, Archer Daniels Midland Company, and Corbion NV, are actively engaged in research and development to improve product quality, explore new sources of EPA and DHA, and develop innovative applications. Their strategic partnerships, acquisitions, and investments are significantly shaping the market landscape. The market's future trajectory is likely influenced by evolving consumer preferences, technological advancements in extraction and purification processes, and the increasing adoption of personalized nutrition approaches that emphasize the benefits of omega-3 supplementation. Furthermore, the growing emphasis on transparency and traceability within the supply chain will likely drive demand for sustainably sourced and certified EPA/DHA products.
EPA/DHA Ingredients Industry Market Report: 2019-2033
This comprehensive report provides a detailed analysis of the EPA/DHA ingredients industry, offering actionable insights for stakeholders across the value chain. Covering the period 2019-2033, with a focus on 2025, this report analyzes market dynamics, trends, leading players, and future opportunities within this rapidly evolving sector. Benefit from our in-depth analysis and projections to inform your strategic decision-making.
EPA/DHA Ingredients Industry Market Dynamics & Concentration
The EPA/DHA ingredients market, valued at xx Million in 2024, exhibits a moderately concentrated landscape. Key players like Koninklijke DSM NV, KD Pharma Group, and Archer Daniels Midland Company hold significant market share, but a competitive fringe of smaller specialized firms also exists. Market concentration is influenced by factors such as economies of scale in sourcing and processing, R&D capabilities, and established brand recognition.
- Market Share: The top 5 players hold an estimated xx% market share in 2024, with a projected xx% by 2033.
- Innovation Drivers: Technological advancements in extraction and purification methods, coupled with growing consumer demand for high-quality, sustainably sourced EPA/DHA, are key drivers.
- Regulatory Frameworks: Stringent regulations regarding purity, labeling, and safety standards influence market dynamics and create a barrier to entry for smaller players. Compliance costs are significant.
- Product Substitutes: While no perfect substitutes exist, alternative sources of omega-3 fatty acids (like ALA from plant-based sources) provide some level of competition. However, the efficacy of EPA/DHA remains unmatched for many health benefits.
- End-User Trends: The increasing awareness of the health benefits of EPA/DHA, particularly for cardiovascular and brain health, fuels market growth. Demand is driven by the dietary supplement, functional food, and pharmaceutical sectors.
- M&A Activities: The industry has witnessed xx M&A deals in the period 2019-2024. Consolidation is expected to continue as larger players seek to expand their market share and product portfolios.
EPA/DHA Ingredients Industry Industry Trends & Analysis
The EPA/DHA ingredients market is projected to experience a CAGR of xx% during the forecast period (2025-2033), driven by several factors. Growing consumer health consciousness and the increasing prevalence of chronic diseases necessitate the consumption of omega-3 fatty acids. Technological advancements, such as improved extraction and purification techniques, are leading to higher-quality products with increased concentration and purity. The increasing demand for convenient and palatable formats, like omega-3 gummies, also plays a significant role. This growth is not without challenges: fluctuations in raw material prices (fish oil) and increasing competition from alternative sources of omega-3s, such as plant-based sources, pose a challenge to market players. Market penetration is highest in developed economies but is growing rapidly in developing nations with rising disposable incomes. The shift towards sustainable and ethical sourcing is also gaining momentum, influencing consumer purchasing decisions and creating new opportunities for companies committed to sustainability.
Leading Markets & Segments in EPA/DHA Ingredients Industry
North America currently dominates the EPA/DHA ingredients market, followed by Europe and Asia Pacific.
Key Drivers for North American Dominance:
- Strong consumer awareness of the health benefits of EPA/DHA.
- High per capita consumption of dietary supplements.
- Well-established distribution networks for supplements and functional foods.
- Significant investments in research and development.
Asia Pacific's Growth Potential:
- Rapidly expanding middle class with increased disposable incomes.
- Growing awareness of the importance of preventive healthcare.
- Increasing adoption of Western dietary habits.
- Government initiatives promoting health and wellness.
Detailed analysis reveals that the dietary supplements segment holds the largest market share, followed by the functional foods segment. The pharmaceutical segment is experiencing relatively slower growth, but steady expansion is expected as scientific research continues to highlight the therapeutic potential of EPA/DHA.
EPA/DHA Ingredients Industry Product Developments
Recent product innovations focus on enhancing the bioavailability, stability, and palatability of EPA/DHA. This includes the development of microencapsulated products, novel delivery systems, and innovative product formats like gummies and chewables. Manufacturers are also focusing on sustainable sourcing practices and emphasizing the purity and quality of their products to cater to the increasing demand for high-quality ingredients. Competitive advantages are built around efficient production processes, unique formulations, and strong branding to create a unique market niche.
Key Drivers of EPA/DHA Ingredients Industry Growth
Several factors are driving the growth of the EPA/DHA ingredients industry. The rising prevalence of chronic diseases like cardiovascular disease and dementia is creating a strong consumer demand for these essential fatty acids. Advances in extraction technologies are making EPA/DHA more affordable and accessible. Moreover, increasing awareness of the health benefits of EPA/DHA among consumers, combined with the rising demand for functional foods and dietary supplements, is boosting market growth. Government regulations promoting healthier diets are also beneficial.
Challenges in the EPA/DHA Ingredients Industry Market
The EPA/DHA ingredients industry faces several challenges, including fluctuations in raw material prices (fish oil), impacting profitability. Supply chain disruptions and the competition from alternative omega-3 sources (plant-based) also pose challenges. Stringent regulatory requirements across different geographies increase compliance costs. Finally, maintaining the quality and purity of products, especially from sustainably sourced fish oil, requires significant investment in quality control and supply chain management.
Emerging Opportunities in EPA/DHA Ingredients Industry
Several emerging opportunities exist in the EPA/DHA ingredients industry. Technological advancements such as innovative extraction methods and novel delivery systems are creating opportunities for new product development and market differentiation. Strategic partnerships between ingredient suppliers and food/supplement manufacturers to develop and launch innovative products are further driving growth. The expansion into new geographical markets with growing consumer health consciousness presents significant market potential.
Leading Players in the EPA/DHA Ingredients Industry Sector
- Koninklijke DSM NV
- KD Pharma Group
- The Archer Daniels Midland Company
- Corbion NV
- Novasep Holding SAS
- Neptune Wellness Solutions
- BASF SE
- Omega Protein Corporation
- Croda International PLC
- Novotech Nutraceuticals
*List Not Exhaustive
Key Milestones in EPA/DHA Ingredients Industry Industry
- March 2024: DSM-Firmenich partnered with SCN BestCo to launch omega-3 gummies with EPA and DHA ingredients. This signifies a move towards more convenient and appealing product formats.
- March 2024: Epax invested USD 40 Million in a state-of-the-art distillation facility, enhancing its capacity for ultra-concentrated omega-3 production and reinforcing its position as a leader in premium omega-3 ingredients.
- February 2024: Epax launched EPAX Omega 3-9-11, a full-spectrum oil expanding its product portfolio and targeting the growing market for skin health supplements.
Strategic Outlook for EPA/DHA Ingredients Industry Market
The EPA/DHA ingredients market exhibits strong growth potential, driven by consumer health consciousness and technological advancements. Companies focused on innovation, sustainable sourcing, and strategic partnerships are expected to benefit the most. The expansion into new product formats, geographical markets, and applications will be key strategic initiatives for long-term success in this dynamic market. Investing in research and development to discover novel ways of extracting, purifying, and delivering EPA/DHA will maintain competitive advantage.
EPA/DHA Ingredients Industry Segmentation
-
1. Type
- 1.1. Eicosapentaenoic Acid (EPA)
- 1.2. Docosahexaenoic Acid (DHA)
-
2. Source
- 2.1. Fish Oil
- 2.2. Algae Oil
- 2.3. Krill Oil
- 2.4. Other Sources
-
3. Application
- 3.1. Infant Formulae
- 3.2. Dietary Supplements
- 3.3. Fortified Food and Beverages
- 3.4. Pharmaceuticals
- 3.5. Other Applications
EPA/DHA Ingredients Industry Segmentation By Geography
-
1. North America
- 1.1. United States
- 1.2. Mexico
- 1.3. Canada
- 1.4. Rest of North America
-
2. Europe
- 2.1. Spain
- 2.2. United Kingdom
- 2.3. Germany
- 2.4. France
- 2.5. Russia
- 2.6. Italy
- 2.7. Rest of Europe
-
3. Asia Pacific
- 3.1. China
- 3.2. Japan
- 3.3. India
- 3.4. Australia
- 3.5. Rest of Asia Pacific
-
4. South America
- 4.1. Brazil
- 4.2. Argentina
- 4.3. Rest of South America
-
5. Middle East and Africa
- 5.1. United Arab Emirates
- 5.2. South Africa
- 5.3. Rest of Middle East and Africa

EPA/DHA Ingredients Industry REPORT HIGHLIGHTS
| Aspects | Details |
|---|---|
| Study Period | 2019-2033 |
| Base Year | 2024 |
| Estimated Year | 2025 |
| Forecast Period | 2025-2033 |
| Historical Period | 2019-2024 |
| Growth Rate | CAGR of 7.51% from 2019-2033 |
| Segmentation |
|
Table of Contents
- 1. Introduction
- 1.1. Research Scope
- 1.2. Market Segmentation
- 1.3. Research Methodology
- 1.4. Definitions and Assumptions
- 2. Executive Summary
- 2.1. Introduction
- 3. Market Dynamics
- 3.1. Introduction
- 3.2. Market Drivers
- 3.2.1. Increasing Awareness Of Health Benefits Associated With EPA And DHA; Demand for Concentrated Forms of Omega 3
- 3.3. Market Restrains
- 3.3.1. Increasing Awareness Of Health Benefits Associated With EPA And DHA; Demand for Concentrated Forms of Omega 3
- 3.4. Market Trends
- 3.4.1. Increasing Awareness Of Health Benefits Associated With EPA And DHA
- 4. Market Factor Analysis
- 4.1. Porters Five Forces
- 4.2. Supply/Value Chain
- 4.3. PESTEL analysis
- 4.4. Market Entropy
- 4.5. Patent/Trademark Analysis
- 5. Global EPA/DHA Ingredients Industry Analysis, Insights and Forecast, 2019-2031
- 5.1. Market Analysis, Insights and Forecast - by Type
- 5.1.1. Eicosapentaenoic Acid (EPA)
- 5.1.2. Docosahexaenoic Acid (DHA)
- 5.2. Market Analysis, Insights and Forecast - by Source
- 5.2.1. Fish Oil
- 5.2.2. Algae Oil
- 5.2.3. Krill Oil
- 5.2.4. Other Sources
- 5.3. Market Analysis, Insights and Forecast - by Application
- 5.3.1. Infant Formulae
- 5.3.2. Dietary Supplements
- 5.3.3. Fortified Food and Beverages
- 5.3.4. Pharmaceuticals
- 5.3.5. Other Applications
- 5.4. Market Analysis, Insights and Forecast - by Region
- 5.4.1. North America
- 5.4.2. Europe
- 5.4.3. Asia Pacific
- 5.4.4. South America
- 5.4.5. Middle East and Africa
- 5.1. Market Analysis, Insights and Forecast - by Type
- 6. North America EPA/DHA Ingredients Industry Analysis, Insights and Forecast, 2019-2031
- 6.1. Market Analysis, Insights and Forecast - by Type
- 6.1.1. Eicosapentaenoic Acid (EPA)
- 6.1.2. Docosahexaenoic Acid (DHA)
- 6.2. Market Analysis, Insights and Forecast - by Source
- 6.2.1. Fish Oil
- 6.2.2. Algae Oil
- 6.2.3. Krill Oil
- 6.2.4. Other Sources
- 6.3. Market Analysis, Insights and Forecast - by Application
- 6.3.1. Infant Formulae
- 6.3.2. Dietary Supplements
- 6.3.3. Fortified Food and Beverages
- 6.3.4. Pharmaceuticals
- 6.3.5. Other Applications
- 6.1. Market Analysis, Insights and Forecast - by Type
- 7. Europe EPA/DHA Ingredients Industry Analysis, Insights and Forecast, 2019-2031
- 7.1. Market Analysis, Insights and Forecast - by Type
- 7.1.1. Eicosapentaenoic Acid (EPA)
- 7.1.2. Docosahexaenoic Acid (DHA)
- 7.2. Market Analysis, Insights and Forecast - by Source
- 7.2.1. Fish Oil
- 7.2.2. Algae Oil
- 7.2.3. Krill Oil
- 7.2.4. Other Sources
- 7.3. Market Analysis, Insights and Forecast - by Application
- 7.3.1. Infant Formulae
- 7.3.2. Dietary Supplements
- 7.3.3. Fortified Food and Beverages
- 7.3.4. Pharmaceuticals
- 7.3.5. Other Applications
- 7.1. Market Analysis, Insights and Forecast - by Type
- 8. Asia Pacific EPA/DHA Ingredients Industry Analysis, Insights and Forecast, 2019-2031
- 8.1. Market Analysis, Insights and Forecast - by Type
- 8.1.1. Eicosapentaenoic Acid (EPA)
- 8.1.2. Docosahexaenoic Acid (DHA)
- 8.2. Market Analysis, Insights and Forecast - by Source
- 8.2.1. Fish Oil
- 8.2.2. Algae Oil
- 8.2.3. Krill Oil
- 8.2.4. Other Sources
- 8.3. Market Analysis, Insights and Forecast - by Application
- 8.3.1. Infant Formulae
- 8.3.2. Dietary Supplements
- 8.3.3. Fortified Food and Beverages
- 8.3.4. Pharmaceuticals
- 8.3.5. Other Applications
- 8.1. Market Analysis, Insights and Forecast - by Type
- 9. South America EPA/DHA Ingredients Industry Analysis, Insights and Forecast, 2019-2031
- 9.1. Market Analysis, Insights and Forecast - by Type
- 9.1.1. Eicosapentaenoic Acid (EPA)
- 9.1.2. Docosahexaenoic Acid (DHA)
- 9.2. Market Analysis, Insights and Forecast - by Source
- 9.2.1. Fish Oil
- 9.2.2. Algae Oil
- 9.2.3. Krill Oil
- 9.2.4. Other Sources
- 9.3. Market Analysis, Insights and Forecast - by Application
- 9.3.1. Infant Formulae
- 9.3.2. Dietary Supplements
- 9.3.3. Fortified Food and Beverages
- 9.3.4. Pharmaceuticals
- 9.3.5. Other Applications
- 9.1. Market Analysis, Insights and Forecast - by Type
- 10. Middle East and Africa EPA/DHA Ingredients Industry Analysis, Insights and Forecast, 2019-2031
- 10.1. Market Analysis, Insights and Forecast - by Type
- 10.1.1. Eicosapentaenoic Acid (EPA)
- 10.1.2. Docosahexaenoic Acid (DHA)
- 10.2. Market Analysis, Insights and Forecast - by Source
- 10.2.1. Fish Oil
- 10.2.2. Algae Oil
- 10.2.3. Krill Oil
- 10.2.4. Other Sources
- 10.3. Market Analysis, Insights and Forecast - by Application
- 10.3.1. Infant Formulae
- 10.3.2. Dietary Supplements
- 10.3.3. Fortified Food and Beverages
- 10.3.4. Pharmaceuticals
- 10.3.5. Other Applications
- 10.1. Market Analysis, Insights and Forecast - by Type
- 11. Competitive Analysis
- 11.1. Global Market Share Analysis 2024
- 11.2. Company Profiles
- 11.2.1 Koninklijke DSM NV
- 11.2.1.1. Overview
- 11.2.1.2. Products
- 11.2.1.3. SWOT Analysis
- 11.2.1.4. Recent Developments
- 11.2.1.5. Financials (Based on Availability)
- 11.2.2 KD Pharma Group
- 11.2.2.1. Overview
- 11.2.2.2. Products
- 11.2.2.3. SWOT Analysis
- 11.2.2.4. Recent Developments
- 11.2.2.5. Financials (Based on Availability)
- 11.2.3 The Archer Daniels Midland Company
- 11.2.3.1. Overview
- 11.2.3.2. Products
- 11.2.3.3. SWOT Analysis
- 11.2.3.4. Recent Developments
- 11.2.3.5. Financials (Based on Availability)
- 11.2.4 Corbion NV
- 11.2.4.1. Overview
- 11.2.4.2. Products
- 11.2.4.3. SWOT Analysis
- 11.2.4.4. Recent Developments
- 11.2.4.5. Financials (Based on Availability)
- 11.2.5 Novasep Holding SAS
- 11.2.5.1. Overview
- 11.2.5.2. Products
- 11.2.5.3. SWOT Analysis
- 11.2.5.4. Recent Developments
- 11.2.5.5. Financials (Based on Availability)
- 11.2.6 Neptune Wellness Solutions
- 11.2.6.1. Overview
- 11.2.6.2. Products
- 11.2.6.3. SWOT Analysis
- 11.2.6.4. Recent Developments
- 11.2.6.5. Financials (Based on Availability)
- 11.2.7 BASF SE
- 11.2.7.1. Overview
- 11.2.7.2. Products
- 11.2.7.3. SWOT Analysis
- 11.2.7.4. Recent Developments
- 11.2.7.5. Financials (Based on Availability)
- 11.2.8 Omega Protein Corporation
- 11.2.8.1. Overview
- 11.2.8.2. Products
- 11.2.8.3. SWOT Analysis
- 11.2.8.4. Recent Developments
- 11.2.8.5. Financials (Based on Availability)
- 11.2.9 Croda International PLC
- 11.2.9.1. Overview
- 11.2.9.2. Products
- 11.2.9.3. SWOT Analysis
- 11.2.9.4. Recent Developments
- 11.2.9.5. Financials (Based on Availability)
- 11.2.10 Novotech Nutraceuticals*List Not Exhaustive
- 11.2.10.1. Overview
- 11.2.10.2. Products
- 11.2.10.3. SWOT Analysis
- 11.2.10.4. Recent Developments
- 11.2.10.5. Financials (Based on Availability)
- 11.2.1 Koninklijke DSM NV
List of Figures
- Figure 1: Global EPA/DHA Ingredients Industry Revenue Breakdown (Million, %) by Region 2024 & 2032
- Figure 2: Global EPA/DHA Ingredients Industry Volume Breakdown (Billion, %) by Region 2024 & 2032
- Figure 3: North America EPA/DHA Ingredients Industry Revenue (Million), by Type 2024 & 2032
- Figure 4: North America EPA/DHA Ingredients Industry Volume (Billion), by Type 2024 & 2032
- Figure 5: North America EPA/DHA Ingredients Industry Revenue Share (%), by Type 2024 & 2032
- Figure 6: North America EPA/DHA Ingredients Industry Volume Share (%), by Type 2024 & 2032
- Figure 7: North America EPA/DHA Ingredients Industry Revenue (Million), by Source 2024 & 2032
- Figure 8: North America EPA/DHA Ingredients Industry Volume (Billion), by Source 2024 & 2032
- Figure 9: North America EPA/DHA Ingredients Industry Revenue Share (%), by Source 2024 & 2032
- Figure 10: North America EPA/DHA Ingredients Industry Volume Share (%), by Source 2024 & 2032
- Figure 11: North America EPA/DHA Ingredients Industry Revenue (Million), by Application 2024 & 2032
- Figure 12: North America EPA/DHA Ingredients Industry Volume (Billion), by Application 2024 & 2032
- Figure 13: North America EPA/DHA Ingredients Industry Revenue Share (%), by Application 2024 & 2032
- Figure 14: North America EPA/DHA Ingredients Industry Volume Share (%), by Application 2024 & 2032
- Figure 15: North America EPA/DHA Ingredients Industry Revenue (Million), by Country 2024 & 2032
- Figure 16: North America EPA/DHA Ingredients Industry Volume (Billion), by Country 2024 & 2032
- Figure 17: North America EPA/DHA Ingredients Industry Revenue Share (%), by Country 2024 & 2032
- Figure 18: North America EPA/DHA Ingredients Industry Volume Share (%), by Country 2024 & 2032
- Figure 19: Europe EPA/DHA Ingredients Industry Revenue (Million), by Type 2024 & 2032
- Figure 20: Europe EPA/DHA Ingredients Industry Volume (Billion), by Type 2024 & 2032
- Figure 21: Europe EPA/DHA Ingredients Industry Revenue Share (%), by Type 2024 & 2032
- Figure 22: Europe EPA/DHA Ingredients Industry Volume Share (%), by Type 2024 & 2032
- Figure 23: Europe EPA/DHA Ingredients Industry Revenue (Million), by Source 2024 & 2032
- Figure 24: Europe EPA/DHA Ingredients Industry Volume (Billion), by Source 2024 & 2032
- Figure 25: Europe EPA/DHA Ingredients Industry Revenue Share (%), by Source 2024 & 2032
- Figure 26: Europe EPA/DHA Ingredients Industry Volume Share (%), by Source 2024 & 2032
- Figure 27: Europe EPA/DHA Ingredients Industry Revenue (Million), by Application 2024 & 2032
- Figure 28: Europe EPA/DHA Ingredients Industry Volume (Billion), by Application 2024 & 2032
- Figure 29: Europe EPA/DHA Ingredients Industry Revenue Share (%), by Application 2024 & 2032
- Figure 30: Europe EPA/DHA Ingredients Industry Volume Share (%), by Application 2024 & 2032
- Figure 31: Europe EPA/DHA Ingredients Industry Revenue (Million), by Country 2024 & 2032
- Figure 32: Europe EPA/DHA Ingredients Industry Volume (Billion), by Country 2024 & 2032
- Figure 33: Europe EPA/DHA Ingredients Industry Revenue Share (%), by Country 2024 & 2032
- Figure 34: Europe EPA/DHA Ingredients Industry Volume Share (%), by Country 2024 & 2032
- Figure 35: Asia Pacific EPA/DHA Ingredients Industry Revenue (Million), by Type 2024 & 2032
- Figure 36: Asia Pacific EPA/DHA Ingredients Industry Volume (Billion), by Type 2024 & 2032
- Figure 37: Asia Pacific EPA/DHA Ingredients Industry Revenue Share (%), by Type 2024 & 2032
- Figure 38: Asia Pacific EPA/DHA Ingredients Industry Volume Share (%), by Type 2024 & 2032
- Figure 39: Asia Pacific EPA/DHA Ingredients Industry Revenue (Million), by Source 2024 & 2032
- Figure 40: Asia Pacific EPA/DHA Ingredients Industry Volume (Billion), by Source 2024 & 2032
- Figure 41: Asia Pacific EPA/DHA Ingredients Industry Revenue Share (%), by Source 2024 & 2032
- Figure 42: Asia Pacific EPA/DHA Ingredients Industry Volume Share (%), by Source 2024 & 2032
- Figure 43: Asia Pacific EPA/DHA Ingredients Industry Revenue (Million), by Application 2024 & 2032
- Figure 44: Asia Pacific EPA/DHA Ingredients Industry Volume (Billion), by Application 2024 & 2032
- Figure 45: Asia Pacific EPA/DHA Ingredients Industry Revenue Share (%), by Application 2024 & 2032
- Figure 46: Asia Pacific EPA/DHA Ingredients Industry Volume Share (%), by Application 2024 & 2032
- Figure 47: Asia Pacific EPA/DHA Ingredients Industry Revenue (Million), by Country 2024 & 2032
- Figure 48: Asia Pacific EPA/DHA Ingredients Industry Volume (Billion), by Country 2024 & 2032
- Figure 49: Asia Pacific EPA/DHA Ingredients Industry Revenue Share (%), by Country 2024 & 2032
- Figure 50: Asia Pacific EPA/DHA Ingredients Industry Volume Share (%), by Country 2024 & 2032
- Figure 51: South America EPA/DHA Ingredients Industry Revenue (Million), by Type 2024 & 2032
- Figure 52: South America EPA/DHA Ingredients Industry Volume (Billion), by Type 2024 & 2032
- Figure 53: South America EPA/DHA Ingredients Industry Revenue Share (%), by Type 2024 & 2032
- Figure 54: South America EPA/DHA Ingredients Industry Volume Share (%), by Type 2024 & 2032
- Figure 55: South America EPA/DHA Ingredients Industry Revenue (Million), by Source 2024 & 2032
- Figure 56: South America EPA/DHA Ingredients Industry Volume (Billion), by Source 2024 & 2032
- Figure 57: South America EPA/DHA Ingredients Industry Revenue Share (%), by Source 2024 & 2032
- Figure 58: South America EPA/DHA Ingredients Industry Volume Share (%), by Source 2024 & 2032
- Figure 59: South America EPA/DHA Ingredients Industry Revenue (Million), by Application 2024 & 2032
- Figure 60: South America EPA/DHA Ingredients Industry Volume (Billion), by Application 2024 & 2032
- Figure 61: South America EPA/DHA Ingredients Industry Revenue Share (%), by Application 2024 & 2032
- Figure 62: South America EPA/DHA Ingredients Industry Volume Share (%), by Application 2024 & 2032
- Figure 63: South America EPA/DHA Ingredients Industry Revenue (Million), by Country 2024 & 2032
- Figure 64: South America EPA/DHA Ingredients Industry Volume (Billion), by Country 2024 & 2032
- Figure 65: South America EPA/DHA Ingredients Industry Revenue Share (%), by Country 2024 & 2032
- Figure 66: South America EPA/DHA Ingredients Industry Volume Share (%), by Country 2024 & 2032
- Figure 67: Middle East and Africa EPA/DHA Ingredients Industry Revenue (Million), by Type 2024 & 2032
- Figure 68: Middle East and Africa EPA/DHA Ingredients Industry Volume (Billion), by Type 2024 & 2032
- Figure 69: Middle East and Africa EPA/DHA Ingredients Industry Revenue Share (%), by Type 2024 & 2032
- Figure 70: Middle East and Africa EPA/DHA Ingredients Industry Volume Share (%), by Type 2024 & 2032
- Figure 71: Middle East and Africa EPA/DHA Ingredients Industry Revenue (Million), by Source 2024 & 2032
- Figure 72: Middle East and Africa EPA/DHA Ingredients Industry Volume (Billion), by Source 2024 & 2032
- Figure 73: Middle East and Africa EPA/DHA Ingredients Industry Revenue Share (%), by Source 2024 & 2032
- Figure 74: Middle East and Africa EPA/DHA Ingredients Industry Volume Share (%), by Source 2024 & 2032
- Figure 75: Middle East and Africa EPA/DHA Ingredients Industry Revenue (Million), by Application 2024 & 2032
- Figure 76: Middle East and Africa EPA/DHA Ingredients Industry Volume (Billion), by Application 2024 & 2032
- Figure 77: Middle East and Africa EPA/DHA Ingredients Industry Revenue Share (%), by Application 2024 & 2032
- Figure 78: Middle East and Africa EPA/DHA Ingredients Industry Volume Share (%), by Application 2024 & 2032
- Figure 79: Middle East and Africa EPA/DHA Ingredients Industry Revenue (Million), by Country 2024 & 2032
- Figure 80: Middle East and Africa EPA/DHA Ingredients Industry Volume (Billion), by Country 2024 & 2032
- Figure 81: Middle East and Africa EPA/DHA Ingredients Industry Revenue Share (%), by Country 2024 & 2032
- Figure 82: Middle East and Africa EPA/DHA Ingredients Industry Volume Share (%), by Country 2024 & 2032
List of Tables
- Table 1: Global EPA/DHA Ingredients Industry Revenue Million Forecast, by Region 2019 & 2032
- Table 2: Global EPA/DHA Ingredients Industry Volume Billion Forecast, by Region 2019 & 2032
- Table 3: Global EPA/DHA Ingredients Industry Revenue Million Forecast, by Type 2019 & 2032
- Table 4: Global EPA/DHA Ingredients Industry Volume Billion Forecast, by Type 2019 & 2032
- Table 5: Global EPA/DHA Ingredients Industry Revenue Million Forecast, by Source 2019 & 2032
- Table 6: Global EPA/DHA Ingredients Industry Volume Billion Forecast, by Source 2019 & 2032
- Table 7: Global EPA/DHA Ingredients Industry Revenue Million Forecast, by Application 2019 & 2032
- Table 8: Global EPA/DHA Ingredients Industry Volume Billion Forecast, by Application 2019 & 2032
- Table 9: Global EPA/DHA Ingredients Industry Revenue Million Forecast, by Region 2019 & 2032
- Table 10: Global EPA/DHA Ingredients Industry Volume Billion Forecast, by Region 2019 & 2032
- Table 11: Global EPA/DHA Ingredients Industry Revenue Million Forecast, by Type 2019 & 2032
- Table 12: Global EPA/DHA Ingredients Industry Volume Billion Forecast, by Type 2019 & 2032
- Table 13: Global EPA/DHA Ingredients Industry Revenue Million Forecast, by Source 2019 & 2032
- Table 14: Global EPA/DHA Ingredients Industry Volume Billion Forecast, by Source 2019 & 2032
- Table 15: Global EPA/DHA Ingredients Industry Revenue Million Forecast, by Application 2019 & 2032
- Table 16: Global EPA/DHA Ingredients Industry Volume Billion Forecast, by Application 2019 & 2032
- Table 17: Global EPA/DHA Ingredients Industry Revenue Million Forecast, by Country 2019 & 2032
- Table 18: Global EPA/DHA Ingredients Industry Volume Billion Forecast, by Country 2019 & 2032
- Table 19: United States EPA/DHA Ingredients Industry Revenue (Million) Forecast, by Application 2019 & 2032
- Table 20: United States EPA/DHA Ingredients Industry Volume (Billion) Forecast, by Application 2019 & 2032
- Table 21: Mexico EPA/DHA Ingredients Industry Revenue (Million) Forecast, by Application 2019 & 2032
- Table 22: Mexico EPA/DHA Ingredients Industry Volume (Billion) Forecast, by Application 2019 & 2032
- Table 23: Canada EPA/DHA Ingredients Industry Revenue (Million) Forecast, by Application 2019 & 2032
- Table 24: Canada EPA/DHA Ingredients Industry Volume (Billion) Forecast, by Application 2019 & 2032
- Table 25: Rest of North America EPA/DHA Ingredients Industry Revenue (Million) Forecast, by Application 2019 & 2032
- Table 26: Rest of North America EPA/DHA Ingredients Industry Volume (Billion) Forecast, by Application 2019 & 2032
- Table 27: Global EPA/DHA Ingredients Industry Revenue Million Forecast, by Type 2019 & 2032
- Table 28: Global EPA/DHA Ingredients Industry Volume Billion Forecast, by Type 2019 & 2032
- Table 29: Global EPA/DHA Ingredients Industry Revenue Million Forecast, by Source 2019 & 2032
- Table 30: Global EPA/DHA Ingredients Industry Volume Billion Forecast, by Source 2019 & 2032
- Table 31: Global EPA/DHA Ingredients Industry Revenue Million Forecast, by Application 2019 & 2032
- Table 32: Global EPA/DHA Ingredients Industry Volume Billion Forecast, by Application 2019 & 2032
- Table 33: Global EPA/DHA Ingredients Industry Revenue Million Forecast, by Country 2019 & 2032
- Table 34: Global EPA/DHA Ingredients Industry Volume Billion Forecast, by Country 2019 & 2032
- Table 35: Spain EPA/DHA Ingredients Industry Revenue (Million) Forecast, by Application 2019 & 2032
- Table 36: Spain EPA/DHA Ingredients Industry Volume (Billion) Forecast, by Application 2019 & 2032
- Table 37: United Kingdom EPA/DHA Ingredients Industry Revenue (Million) Forecast, by Application 2019 & 2032
- Table 38: United Kingdom EPA/DHA Ingredients Industry Volume (Billion) Forecast, by Application 2019 & 2032
- Table 39: Germany EPA/DHA Ingredients Industry Revenue (Million) Forecast, by Application 2019 & 2032
- Table 40: Germany EPA/DHA Ingredients Industry Volume (Billion) Forecast, by Application 2019 & 2032
- Table 41: France EPA/DHA Ingredients Industry Revenue (Million) Forecast, by Application 2019 & 2032
- Table 42: France EPA/DHA Ingredients Industry Volume (Billion) Forecast, by Application 2019 & 2032
- Table 43: Russia EPA/DHA Ingredients Industry Revenue (Million) Forecast, by Application 2019 & 2032
- Table 44: Russia EPA/DHA Ingredients Industry Volume (Billion) Forecast, by Application 2019 & 2032
- Table 45: Italy EPA/DHA Ingredients Industry Revenue (Million) Forecast, by Application 2019 & 2032
- Table 46: Italy EPA/DHA Ingredients Industry Volume (Billion) Forecast, by Application 2019 & 2032
- Table 47: Rest of Europe EPA/DHA Ingredients Industry Revenue (Million) Forecast, by Application 2019 & 2032
- Table 48: Rest of Europe EPA/DHA Ingredients Industry Volume (Billion) Forecast, by Application 2019 & 2032
- Table 49: Global EPA/DHA Ingredients Industry Revenue Million Forecast, by Type 2019 & 2032
- Table 50: Global EPA/DHA Ingredients Industry Volume Billion Forecast, by Type 2019 & 2032
- Table 51: Global EPA/DHA Ingredients Industry Revenue Million Forecast, by Source 2019 & 2032
- Table 52: Global EPA/DHA Ingredients Industry Volume Billion Forecast, by Source 2019 & 2032
- Table 53: Global EPA/DHA Ingredients Industry Revenue Million Forecast, by Application 2019 & 2032
- Table 54: Global EPA/DHA Ingredients Industry Volume Billion Forecast, by Application 2019 & 2032
- Table 55: Global EPA/DHA Ingredients Industry Revenue Million Forecast, by Country 2019 & 2032
- Table 56: Global EPA/DHA Ingredients Industry Volume Billion Forecast, by Country 2019 & 2032
- Table 57: China EPA/DHA Ingredients Industry Revenue (Million) Forecast, by Application 2019 & 2032
- Table 58: China EPA/DHA Ingredients Industry Volume (Billion) Forecast, by Application 2019 & 2032
- Table 59: Japan EPA/DHA Ingredients Industry Revenue (Million) Forecast, by Application 2019 & 2032
- Table 60: Japan EPA/DHA Ingredients Industry Volume (Billion) Forecast, by Application 2019 & 2032
- Table 61: India EPA/DHA Ingredients Industry Revenue (Million) Forecast, by Application 2019 & 2032
- Table 62: India EPA/DHA Ingredients Industry Volume (Billion) Forecast, by Application 2019 & 2032
- Table 63: Australia EPA/DHA Ingredients Industry Revenue (Million) Forecast, by Application 2019 & 2032
- Table 64: Australia EPA/DHA Ingredients Industry Volume (Billion) Forecast, by Application 2019 & 2032
- Table 65: Rest of Asia Pacific EPA/DHA Ingredients Industry Revenue (Million) Forecast, by Application 2019 & 2032
- Table 66: Rest of Asia Pacific EPA/DHA Ingredients Industry Volume (Billion) Forecast, by Application 2019 & 2032
- Table 67: Global EPA/DHA Ingredients Industry Revenue Million Forecast, by Type 2019 & 2032
- Table 68: Global EPA/DHA Ingredients Industry Volume Billion Forecast, by Type 2019 & 2032
- Table 69: Global EPA/DHA Ingredients Industry Revenue Million Forecast, by Source 2019 & 2032
- Table 70: Global EPA/DHA Ingredients Industry Volume Billion Forecast, by Source 2019 & 2032
- Table 71: Global EPA/DHA Ingredients Industry Revenue Million Forecast, by Application 2019 & 2032
- Table 72: Global EPA/DHA Ingredients Industry Volume Billion Forecast, by Application 2019 & 2032
- Table 73: Global EPA/DHA Ingredients Industry Revenue Million Forecast, by Country 2019 & 2032
- Table 74: Global EPA/DHA Ingredients Industry Volume Billion Forecast, by Country 2019 & 2032
- Table 75: Brazil EPA/DHA Ingredients Industry Revenue (Million) Forecast, by Application 2019 & 2032
- Table 76: Brazil EPA/DHA Ingredients Industry Volume (Billion) Forecast, by Application 2019 & 2032
- Table 77: Argentina EPA/DHA Ingredients Industry Revenue (Million) Forecast, by Application 2019 & 2032
- Table 78: Argentina EPA/DHA Ingredients Industry Volume (Billion) Forecast, by Application 2019 & 2032
- Table 79: Rest of South America EPA/DHA Ingredients Industry Revenue (Million) Forecast, by Application 2019 & 2032
- Table 80: Rest of South America EPA/DHA Ingredients Industry Volume (Billion) Forecast, by Application 2019 & 2032
- Table 81: Global EPA/DHA Ingredients Industry Revenue Million Forecast, by Type 2019 & 2032
- Table 82: Global EPA/DHA Ingredients Industry Volume Billion Forecast, by Type 2019 & 2032
- Table 83: Global EPA/DHA Ingredients Industry Revenue Million Forecast, by Source 2019 & 2032
- Table 84: Global EPA/DHA Ingredients Industry Volume Billion Forecast, by Source 2019 & 2032
- Table 85: Global EPA/DHA Ingredients Industry Revenue Million Forecast, by Application 2019 & 2032
- Table 86: Global EPA/DHA Ingredients Industry Volume Billion Forecast, by Application 2019 & 2032
- Table 87: Global EPA/DHA Ingredients Industry Revenue Million Forecast, by Country 2019 & 2032
- Table 88: Global EPA/DHA Ingredients Industry Volume Billion Forecast, by Country 2019 & 2032
- Table 89: United Arab Emirates EPA/DHA Ingredients Industry Revenue (Million) Forecast, by Application 2019 & 2032
- Table 90: United Arab Emirates EPA/DHA Ingredients Industry Volume (Billion) Forecast, by Application 2019 & 2032
- Table 91: South Africa EPA/DHA Ingredients Industry Revenue (Million) Forecast, by Application 2019 & 2032
- Table 92: South Africa EPA/DHA Ingredients Industry Volume (Billion) Forecast, by Application 2019 & 2032
- Table 93: Rest of Middle East and Africa EPA/DHA Ingredients Industry Revenue (Million) Forecast, by Application 2019 & 2032
- Table 94: Rest of Middle East and Africa EPA/DHA Ingredients Industry Volume (Billion) Forecast, by Application 2019 & 2032
Frequently Asked Questions
1. What is the projected Compound Annual Growth Rate (CAGR) of the EPA/DHA Ingredients Industry?
The projected CAGR is approximately 7.51%.
2. Which companies are prominent players in the EPA/DHA Ingredients Industry?
Key companies in the market include Koninklijke DSM NV, KD Pharma Group, The Archer Daniels Midland Company, Corbion NV, Novasep Holding SAS, Neptune Wellness Solutions, BASF SE, Omega Protein Corporation, Croda International PLC, Novotech Nutraceuticals*List Not Exhaustive.
3. What are the main segments of the EPA/DHA Ingredients Industry?
The market segments include Type, Source, Application.
4. Can you provide details about the market size?
The market size is estimated to be USD 1.92 Million as of 2022.
5. What are some drivers contributing to market growth?
Increasing Awareness Of Health Benefits Associated With EPA And DHA; Demand for Concentrated Forms of Omega 3.
6. What are the notable trends driving market growth?
Increasing Awareness Of Health Benefits Associated With EPA And DHA.
7. Are there any restraints impacting market growth?
Increasing Awareness Of Health Benefits Associated With EPA And DHA; Demand for Concentrated Forms of Omega 3.
8. Can you provide examples of recent developments in the market?
March 2024: DSM-Firmenich partnered with SCN BestCo to launch omega-3 gummies with EPA and DHA ingredients.
9. What pricing options are available for accessing the report?
Pricing options include single-user, multi-user, and enterprise licenses priced at USD 4750, USD 5250, and USD 8750 respectively.
10. Is the market size provided in terms of value or volume?
The market size is provided in terms of value, measured in Million and volume, measured in Billion.
11. Are there any specific market keywords associated with the report?
Yes, the market keyword associated with the report is "EPA/DHA Ingredients Industry," which aids in identifying and referencing the specific market segment covered.
12. How do I determine which pricing option suits my needs best?
The pricing options vary based on user requirements and access needs. Individual users may opt for single-user licenses, while businesses requiring broader access may choose multi-user or enterprise licenses for cost-effective access to the report.
13. Are there any additional resources or data provided in the EPA/DHA Ingredients Industry report?
While the report offers comprehensive insights, it's advisable to review the specific contents or supplementary materials provided to ascertain if additional resources or data are available.
14. How can I stay updated on further developments or reports in the EPA/DHA Ingredients Industry?
To stay informed about further developments, trends, and reports in the EPA/DHA Ingredients Industry, consider subscribing to industry newsletters, following relevant companies and organizations, or regularly checking reputable industry news sources and publications.
Methodology
Step 1 - Identification of Relevant Samples Size from Population Database


Step 2 - Approaches for Defining Global Market Size (Value, Volume* & Price*)

Note*: In applicable scenarios
Step 3 - Data Sources
Primary Research
- Web Analytics
- Survey Reports
- Research Institute
- Latest Research Reports
- Opinion Leaders
Secondary Research
- Annual Reports
- White Paper
- Latest Press Release
- Industry Association
- Paid Database
- Investor Presentations

Step 4 - Data Triangulation
Involves using different sources of information in order to increase the validity of a study
These sources are likely to be stakeholders in a program - participants, other researchers, program staff, other community members, and so on.
Then we put all data in single framework & apply various statistical tools to find out the dynamic on the market.
During the analysis stage, feedback from the stakeholder groups would be compared to determine areas of agreement as well as areas of divergence
