

Key Insights
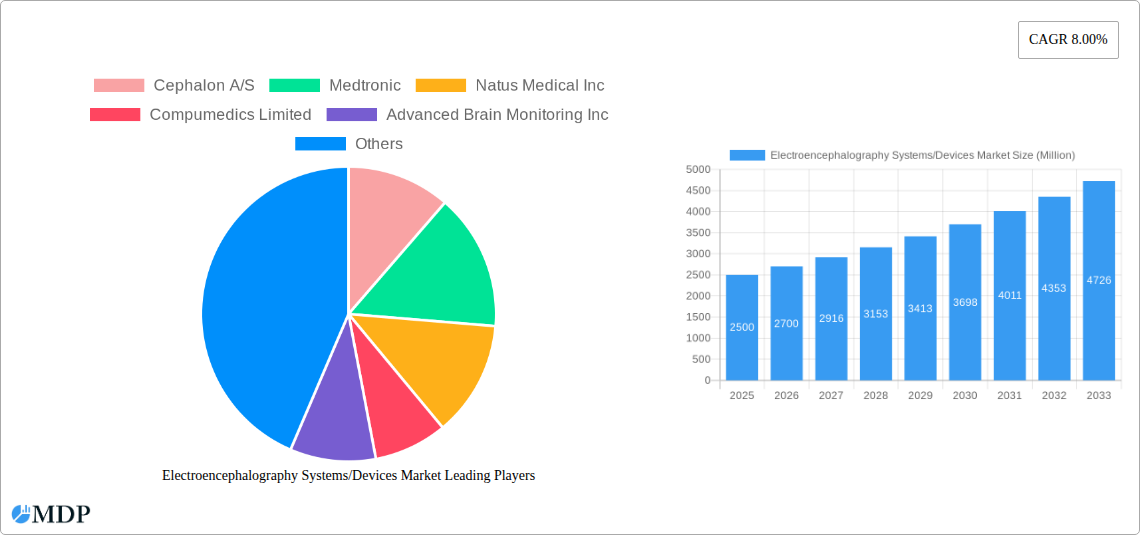
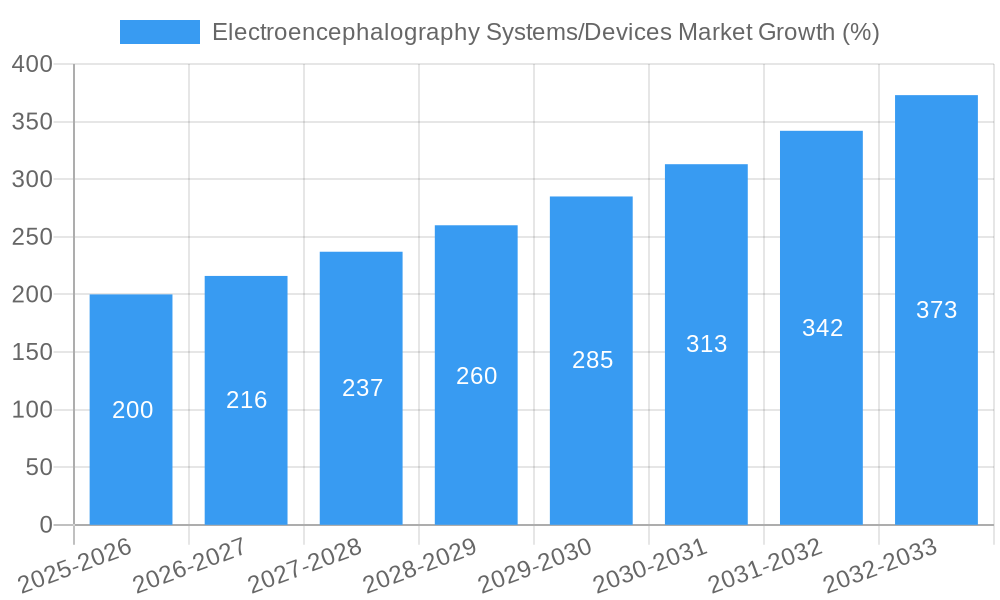
The global Electroencephalography (EEG) Systems/Devices market is experiencing robust growth, projected to reach a significant value by 2033, driven by a compound annual growth rate (CAGR) of 8.00% from 2019-2033. This expansion is fueled by several key factors. The increasing prevalence of neurological disorders like epilepsy, sleep disorders, and Alzheimer's disease is significantly boosting demand for accurate and efficient EEG diagnostic tools. Advancements in technology, such as the development of portable and wireless EEG systems, are enhancing accessibility and patient comfort, leading to wider adoption across various healthcare settings. Furthermore, the rising integration of EEG systems with sophisticated data analytics and AI-powered diagnostic tools is improving the speed and accuracy of diagnoses, further propelling market growth. The market is segmented by device type (portable and standalone) and end-user (hospitals, diagnostic centers, and others), with hospitals currently dominating market share due to their established infrastructure and higher testing volumes.
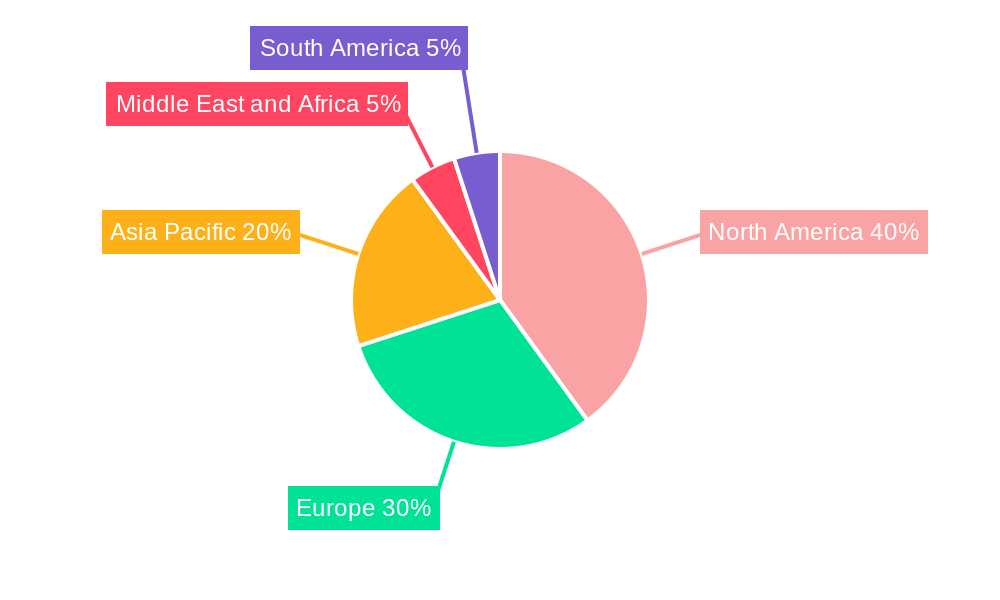
Growth is expected to be particularly strong in regions such as Asia-Pacific, driven by increasing healthcare expenditure, rising awareness of neurological conditions, and a growing elderly population. While North America and Europe maintain a significant market presence due to technological advancements and established healthcare systems, emerging markets in Asia-Pacific and the Middle East & Africa present lucrative opportunities for market expansion. However, high costs associated with advanced EEG systems and the need for skilled professionals to operate and interpret the data represent potential restraints. Nevertheless, the overall market outlook remains positive, with continuous technological innovation and increasing demand expected to drive substantial growth throughout the forecast period. The leading companies, including Cephalon A/S, Medtronic, Natus Medical Inc, and others, are actively engaged in research and development to enhance the capabilities of their EEG systems and expand their market share.
Electroencephalography (EEG) Systems/Devices Market: A Comprehensive Report (2019-2033)
This comprehensive report provides a detailed analysis of the global Electroencephalography (EEG) Systems/Devices market, covering the period 2019-2033. It offers actionable insights into market dynamics, industry trends, leading players, and emerging opportunities, enabling stakeholders to make informed strategic decisions. The report incorporates extensive data analysis, incorporating market size estimations (in Millions), CAGR projections, and detailed segment breakdowns, offering a 360-degree view of this rapidly evolving sector. The base year for this analysis is 2025, with the forecast period spanning 2025-2033 and the historical period covering 2019-2024.
Electroencephalography Systems/Devices Market Dynamics & Concentration
The global EEG systems/devices market exhibits a moderately consolidated structure, with several key players commanding significant market share. Market concentration is influenced by factors including technological advancements, regulatory approvals, and the increasing demand for advanced EEG devices. The market share distribution among leading companies like Medtronic, Natus Medical Inc., and Nihon Kohden Corporation is subject to constant fluctuations due to new product launches, strategic partnerships, and acquisitions. The estimated market share for Medtronic in 2025 is xx%, while Natus Medical Inc. holds approximately xx%, and Nihon Kohden Corporation holds around xx%.
Key Dynamics:
- Innovation Drivers: Continuous technological advancements, such as the integration of artificial intelligence (AI) and machine learning (ML) for improved signal processing and diagnostic accuracy, are driving market growth. Miniaturization and portability of EEG devices are also significant drivers.
- Regulatory Frameworks: Stringent regulatory requirements for medical devices vary across different regions, impacting market access and product approvals. Harmonization of regulatory pathways could potentially accelerate market expansion.
- Product Substitutes: While EEG remains a cornerstone technology, alternative neurodiagnostic methods pose some level of competitive pressure, influencing the market's overall growth trajectory.
- End-User Trends: The increasing prevalence of neurological disorders and rising demand for accurate and timely diagnosis are driving growth in the healthcare sector. The adoption rate of EEG devices is expected to increase across hospitals and diagnostic centers.
- M&A Activities: The number of mergers and acquisitions (M&A) in the EEG market has seen moderate activity in recent years, with xx major deals recorded between 2019 and 2024. Consolidation within the industry is anticipated to reshape the competitive landscape.
Electroencephalography Systems/Devices Market Industry Trends & Analysis
The global EEG systems/devices market is witnessing robust growth, driven by several factors. The market is projected to exhibit a CAGR of xx% during the forecast period (2025-2033). This growth is fueled by a rising prevalence of neurological disorders, technological advancements leading to improved device capabilities and usability, and increased awareness about the importance of early diagnosis and treatment. Moreover, the expanding geriatric population and rising healthcare expenditure are contributing significantly to market expansion. The market penetration of EEG devices in developing economies is still relatively low, presenting a substantial opportunity for future growth. Competitive dynamics are characterized by product innovation, strategic partnerships, and geographic expansion.
Leading Markets & Segments in Electroencephalography Systems/Devices Market
The North American region is currently the leading market for EEG systems and devices, driven by factors such as high healthcare expenditure, advanced medical infrastructure, and the presence of major market players. Within the segment breakdown:
By Type:
- Standalone Devices: This segment dominates the market due to its advanced features and diagnostic capabilities.
- Portable Devices: This segment is experiencing significant growth due to the increasing need for point-of-care diagnostics and home healthcare solutions.
By End User:
- Hospitals: Hospitals account for the largest share, driven by the high volume of neurological procedures performed.
- Diagnostic Centers: This segment demonstrates strong growth potential as these centers play an increasing role in providing specialized neurological diagnostic services.
- Others: This category includes research institutions and ambulatory surgical centers and contributes a significant share to market revenue.
Key Drivers for Dominance:
- North America: Robust healthcare infrastructure, high healthcare spending, early adoption of advanced technologies, and a large pool of skilled professionals.
- Europe: Well-established healthcare systems, increasing prevalence of neurological disorders, and government initiatives promoting healthcare innovation.
- Asia-Pacific: A rapidly growing population, increasing healthcare spending, and a rising incidence of neurological diseases, fostering market expansion in this region.
Electroencephalography Systems/Devices Market Product Developments
Recent product innovations have focused on enhancing diagnostic capabilities, improving user-friendliness, and increasing portability. The integration of AI and machine learning algorithms for automated signal processing and improved diagnostic accuracy is a significant trend. Wireless and portable devices are gaining traction, enabling more convenient and accessible EEG testing. These developments enhance the overall market appeal, leading to broader clinical adoption and improved patient outcomes. Companies are also focusing on developing user-friendly interfaces and sophisticated software for better data analysis and interpretation.
Key Drivers of Electroencephalography Systems/Devices Market Growth
Several factors contribute to the growth of the EEG systems/devices market:
- Technological Advancements: AI-powered EEG systems offering faster, more accurate diagnostics.
- Rising Prevalence of Neurological Disorders: Increased incidence of epilepsy, sleep disorders, and other neurological conditions drives demand.
- Government Initiatives: Increased funding for neurological research and healthcare infrastructure development supports market expansion.
Challenges in the Electroencephalography Systems/Devices Market
Despite the market's growth, certain challenges persist:
- High Costs: The expense of advanced EEG systems can limit accessibility, particularly in resource-constrained settings.
- Regulatory Hurdles: Stringent regulatory approvals can delay product launches and increase development costs.
- Competition: Intense competition among manufacturers necessitates continuous innovation to maintain market share.
Emerging Opportunities in Electroencephalography Systems/Devices Market
Several promising opportunities are shaping the future of the EEG systems/devices market:
- Telemedicine and Remote Monitoring: Expansion into remote patient monitoring using wireless EEG devices is opening new avenues for patient care.
- Integration with other Neurodiagnostic Technologies: Combining EEG with other neuroimaging modalities can provide a more comprehensive diagnostic picture.
- Artificial Intelligence (AI) and Machine Learning (ML) Applications: The use of AI/ML for advanced signal processing and data analytics is transforming the diagnostic capabilities of EEG.
Leading Players in the Electroencephalography Systems/Devices Market Sector
- Cephalon A/S
- Medtronic
- Natus Medical Inc
- Compumedics Limited
- Advanced Brain Monitoring Inc
- Cadwell Industries Inc
- Fresenius SE & Co KGaA
- General Electric Company (GE Healthcare)
- NeuroWave Systems Inc
- Koninklijke Philips N V (Philips Healthcare)
- Nihon Kohden Corporation
Key Milestones in Electroencephalography Systems/Devices Market Industry
- March 2022: Interaxon Inc. launched a VR SDK and a new EEG headband compatible with major VR HMDs. This expands the application of EEG technology beyond traditional clinical settings.
- September 2022: Ceribell, Inc. received FDA Breakthrough Device Designation for its delirium detection system utilizing machine learning to analyze EEG signals. This signifies a significant advancement in early diagnosis and treatment of delirium.
Strategic Outlook for Electroencephalography Systems/Devices Market Market
The future of the EEG systems/devices market appears promising, driven by technological innovation, expanding applications, and an increasing focus on early and accurate diagnosis of neurological disorders. Strategic partnerships and collaborations between technology providers and healthcare institutions will be crucial for driving market growth. The integration of AI and other advanced technologies will further enhance the diagnostic capabilities of EEG systems, leading to improved patient care and outcomes. Companies are expected to prioritize developing portable and user-friendly devices to expand market access and adoption in diverse healthcare settings.
Electroencephalography Systems/Devices Market Segmentation
-
1. Type
- 1.1. Portable Device
- 1.2. Standalone Device
-
2. End User
- 2.1. Hospitals
- 2.2. Diagnostic Centers
- 2.3. Others
Electroencephalography Systems/Devices Market Segmentation By Geography
-
1. North America
- 1.1. United States
- 1.2. Canada
- 1.3. Mexico
-
2. Europe
- 2.1. Germany
- 2.2. United Kingdom
- 2.3. France
- 2.4. Italy
- 2.5. Spain
- 2.6. Rest of Europe
-
3. Asia Pacific
- 3.1. China
- 3.2. Japan
- 3.3. India
- 3.4. Australia
- 3.5. South Korea
- 3.6. Rest of Asia Pacific
-
4. Middle East and Africa
- 4.1. GCC
- 4.2. South Africa
- 4.3. Rest of Middle East and Africa
-
5. South America
- 5.1. Brazil
- 5.2. Argentina
- 5.3. Rest of South America
Electroencephalography Systems/Devices Market REPORT HIGHLIGHTS
| Aspects | Details |
|---|---|
| Study Period | 2019-2033 |
| Base Year | 2024 |
| Estimated Year | 2025 |
| Forecast Period | 2025-2033 |
| Historical Period | 2019-2024 |
| Growth Rate | CAGR of 8.00% from 2019-2033 |
| Segmentation |
|
Table of Contents
- 1. Introduction
- 1.1. Research Scope
- 1.2. Market Segmentation
- 1.3. Research Methodology
- 1.4. Definitions and Assumptions
- 2. Executive Summary
- 2.1. Introduction
- 3. Market Dynamics
- 3.1. Introduction
- 3.2. Market Drivers
- 3.2.1. Rising R&D Expenditure; Increasing Prevalence of Neurological Disorders
- 3.3. Market Restrains
- 3.3.1. Limitation of Electroencephalography System
- 3.4. Market Trends
- 3.4.1. Standalone Electroencephalography System is Expected to Witness a Healthy Growth in Future
- 4. Market Factor Analysis
- 4.1. Porters Five Forces
- 4.2. Supply/Value Chain
- 4.3. PESTEL analysis
- 4.4. Market Entropy
- 4.5. Patent/Trademark Analysis
- 5. Global Electroencephalography Systems/Devices Market Analysis, Insights and Forecast, 2019-2031
- 5.1. Market Analysis, Insights and Forecast - by Type
- 5.1.1. Portable Device
- 5.1.2. Standalone Device
- 5.2. Market Analysis, Insights and Forecast - by End User
- 5.2.1. Hospitals
- 5.2.2. Diagnostic Centers
- 5.2.3. Others
- 5.3. Market Analysis, Insights and Forecast - by Region
- 5.3.1. North America
- 5.3.2. Europe
- 5.3.3. Asia Pacific
- 5.3.4. Middle East and Africa
- 5.3.5. South America
- 5.1. Market Analysis, Insights and Forecast - by Type
- 6. North America Electroencephalography Systems/Devices Market Analysis, Insights and Forecast, 2019-2031
- 6.1. Market Analysis, Insights and Forecast - by Type
- 6.1.1. Portable Device
- 6.1.2. Standalone Device
- 6.2. Market Analysis, Insights and Forecast - by End User
- 6.2.1. Hospitals
- 6.2.2. Diagnostic Centers
- 6.2.3. Others
- 6.1. Market Analysis, Insights and Forecast - by Type
- 7. Europe Electroencephalography Systems/Devices Market Analysis, Insights and Forecast, 2019-2031
- 7.1. Market Analysis, Insights and Forecast - by Type
- 7.1.1. Portable Device
- 7.1.2. Standalone Device
- 7.2. Market Analysis, Insights and Forecast - by End User
- 7.2.1. Hospitals
- 7.2.2. Diagnostic Centers
- 7.2.3. Others
- 7.1. Market Analysis, Insights and Forecast - by Type
- 8. Asia Pacific Electroencephalography Systems/Devices Market Analysis, Insights and Forecast, 2019-2031
- 8.1. Market Analysis, Insights and Forecast - by Type
- 8.1.1. Portable Device
- 8.1.2. Standalone Device
- 8.2. Market Analysis, Insights and Forecast - by End User
- 8.2.1. Hospitals
- 8.2.2. Diagnostic Centers
- 8.2.3. Others
- 8.1. Market Analysis, Insights and Forecast - by Type
- 9. Middle East and Africa Electroencephalography Systems/Devices Market Analysis, Insights and Forecast, 2019-2031
- 9.1. Market Analysis, Insights and Forecast - by Type
- 9.1.1. Portable Device
- 9.1.2. Standalone Device
- 9.2. Market Analysis, Insights and Forecast - by End User
- 9.2.1. Hospitals
- 9.2.2. Diagnostic Centers
- 9.2.3. Others
- 9.1. Market Analysis, Insights and Forecast - by Type
- 10. South America Electroencephalography Systems/Devices Market Analysis, Insights and Forecast, 2019-2031
- 10.1. Market Analysis, Insights and Forecast - by Type
- 10.1.1. Portable Device
- 10.1.2. Standalone Device
- 10.2. Market Analysis, Insights and Forecast - by End User
- 10.2.1. Hospitals
- 10.2.2. Diagnostic Centers
- 10.2.3. Others
- 10.1. Market Analysis, Insights and Forecast - by Type
- 11. North America Electroencephalography Systems/Devices Market Analysis, Insights and Forecast, 2019-2031
- 11.1. Market Analysis, Insights and Forecast - By Country/Sub-region
- 11.1.1 United States
- 11.1.2 Canada
- 11.1.3 Mexico
- 12. Europe Electroencephalography Systems/Devices Market Analysis, Insights and Forecast, 2019-2031
- 12.1. Market Analysis, Insights and Forecast - By Country/Sub-region
- 12.1.1 Germany
- 12.1.2 United Kingdom
- 12.1.3 France
- 12.1.4 Italy
- 12.1.5 Spain
- 12.1.6 Rest of Europe
- 13. Asia Pacific Electroencephalography Systems/Devices Market Analysis, Insights and Forecast, 2019-2031
- 13.1. Market Analysis, Insights and Forecast - By Country/Sub-region
- 13.1.1 China
- 13.1.2 Japan
- 13.1.3 India
- 13.1.4 Australia
- 13.1.5 South Korea
- 13.1.6 Rest of Asia Pacific
- 14. Middle East and Africa Electroencephalography Systems/Devices Market Analysis, Insights and Forecast, 2019-2031
- 14.1. Market Analysis, Insights and Forecast - By Country/Sub-region
- 14.1.1 GCC
- 14.1.2 South Africa
- 14.1.3 Rest of Middle East and Africa
- 15. South America Electroencephalography Systems/Devices Market Analysis, Insights and Forecast, 2019-2031
- 15.1. Market Analysis, Insights and Forecast - By Country/Sub-region
- 15.1.1 Brazil
- 15.1.2 Argentina
- 15.1.3 Rest of South America
- 16. Competitive Analysis
- 16.1. Global Market Share Analysis 2024
- 16.2. Company Profiles
- 16.2.1 Cephalon A/S
- 16.2.1.1. Overview
- 16.2.1.2. Products
- 16.2.1.3. SWOT Analysis
- 16.2.1.4. Recent Developments
- 16.2.1.5. Financials (Based on Availability)
- 16.2.2 Medtronic
- 16.2.2.1. Overview
- 16.2.2.2. Products
- 16.2.2.3. SWOT Analysis
- 16.2.2.4. Recent Developments
- 16.2.2.5. Financials (Based on Availability)
- 16.2.3 Natus Medical Inc
- 16.2.3.1. Overview
- 16.2.3.2. Products
- 16.2.3.3. SWOT Analysis
- 16.2.3.4. Recent Developments
- 16.2.3.5. Financials (Based on Availability)
- 16.2.4 Compumedics Limited
- 16.2.4.1. Overview
- 16.2.4.2. Products
- 16.2.4.3. SWOT Analysis
- 16.2.4.4. Recent Developments
- 16.2.4.5. Financials (Based on Availability)
- 16.2.5 Advanced Brain Monitoring Inc
- 16.2.5.1. Overview
- 16.2.5.2. Products
- 16.2.5.3. SWOT Analysis
- 16.2.5.4. Recent Developments
- 16.2.5.5. Financials (Based on Availability)
- 16.2.6 Cadwell Industries Inc
- 16.2.6.1. Overview
- 16.2.6.2. Products
- 16.2.6.3. SWOT Analysis
- 16.2.6.4. Recent Developments
- 16.2.6.5. Financials (Based on Availability)
- 16.2.7 Fresenius SE & Co KGaA
- 16.2.7.1. Overview
- 16.2.7.2. Products
- 16.2.7.3. SWOT Analysis
- 16.2.7.4. Recent Developments
- 16.2.7.5. Financials (Based on Availability)
- 16.2.8 General Electric Company (GE Healthcare)
- 16.2.8.1. Overview
- 16.2.8.2. Products
- 16.2.8.3. SWOT Analysis
- 16.2.8.4. Recent Developments
- 16.2.8.5. Financials (Based on Availability)
- 16.2.9 NeuroWave Systems Inc
- 16.2.9.1. Overview
- 16.2.9.2. Products
- 16.2.9.3. SWOT Analysis
- 16.2.9.4. Recent Developments
- 16.2.9.5. Financials (Based on Availability)
- 16.2.10 Koninklijke Philips N V (Philips Healthcare)
- 16.2.10.1. Overview
- 16.2.10.2. Products
- 16.2.10.3. SWOT Analysis
- 16.2.10.4. Recent Developments
- 16.2.10.5. Financials (Based on Availability)
- 16.2.11 Nihon Kohden Corporation
- 16.2.11.1. Overview
- 16.2.11.2. Products
- 16.2.11.3. SWOT Analysis
- 16.2.11.4. Recent Developments
- 16.2.11.5. Financials (Based on Availability)
- 16.2.1 Cephalon A/S
List of Figures
- Figure 1: Global Electroencephalography Systems/Devices Market Revenue Breakdown (Million, %) by Region 2024 & 2032
- Figure 2: Global Electroencephalography Systems/Devices Market Volume Breakdown (K Unit, %) by Region 2024 & 2032
- Figure 3: North America Electroencephalography Systems/Devices Market Revenue (Million), by Country 2024 & 2032
- Figure 4: North America Electroencephalography Systems/Devices Market Volume (K Unit), by Country 2024 & 2032
- Figure 5: North America Electroencephalography Systems/Devices Market Revenue Share (%), by Country 2024 & 2032
- Figure 6: North America Electroencephalography Systems/Devices Market Volume Share (%), by Country 2024 & 2032
- Figure 7: Europe Electroencephalography Systems/Devices Market Revenue (Million), by Country 2024 & 2032
- Figure 8: Europe Electroencephalography Systems/Devices Market Volume (K Unit), by Country 2024 & 2032
- Figure 9: Europe Electroencephalography Systems/Devices Market Revenue Share (%), by Country 2024 & 2032
- Figure 10: Europe Electroencephalography Systems/Devices Market Volume Share (%), by Country 2024 & 2032
- Figure 11: Asia Pacific Electroencephalography Systems/Devices Market Revenue (Million), by Country 2024 & 2032
- Figure 12: Asia Pacific Electroencephalography Systems/Devices Market Volume (K Unit), by Country 2024 & 2032
- Figure 13: Asia Pacific Electroencephalography Systems/Devices Market Revenue Share (%), by Country 2024 & 2032
- Figure 14: Asia Pacific Electroencephalography Systems/Devices Market Volume Share (%), by Country 2024 & 2032
- Figure 15: Middle East and Africa Electroencephalography Systems/Devices Market Revenue (Million), by Country 2024 & 2032
- Figure 16: Middle East and Africa Electroencephalography Systems/Devices Market Volume (K Unit), by Country 2024 & 2032
- Figure 17: Middle East and Africa Electroencephalography Systems/Devices Market Revenue Share (%), by Country 2024 & 2032
- Figure 18: Middle East and Africa Electroencephalography Systems/Devices Market Volume Share (%), by Country 2024 & 2032
- Figure 19: South America Electroencephalography Systems/Devices Market Revenue (Million), by Country 2024 & 2032
- Figure 20: South America Electroencephalography Systems/Devices Market Volume (K Unit), by Country 2024 & 2032
- Figure 21: South America Electroencephalography Systems/Devices Market Revenue Share (%), by Country 2024 & 2032
- Figure 22: South America Electroencephalography Systems/Devices Market Volume Share (%), by Country 2024 & 2032
- Figure 23: North America Electroencephalography Systems/Devices Market Revenue (Million), by Type 2024 & 2032
- Figure 24: North America Electroencephalography Systems/Devices Market Volume (K Unit), by Type 2024 & 2032
- Figure 25: North America Electroencephalography Systems/Devices Market Revenue Share (%), by Type 2024 & 2032
- Figure 26: North America Electroencephalography Systems/Devices Market Volume Share (%), by Type 2024 & 2032
- Figure 27: North America Electroencephalography Systems/Devices Market Revenue (Million), by End User 2024 & 2032
- Figure 28: North America Electroencephalography Systems/Devices Market Volume (K Unit), by End User 2024 & 2032
- Figure 29: North America Electroencephalography Systems/Devices Market Revenue Share (%), by End User 2024 & 2032
- Figure 30: North America Electroencephalography Systems/Devices Market Volume Share (%), by End User 2024 & 2032
- Figure 31: North America Electroencephalography Systems/Devices Market Revenue (Million), by Country 2024 & 2032
- Figure 32: North America Electroencephalography Systems/Devices Market Volume (K Unit), by Country 2024 & 2032
- Figure 33: North America Electroencephalography Systems/Devices Market Revenue Share (%), by Country 2024 & 2032
- Figure 34: North America Electroencephalography Systems/Devices Market Volume Share (%), by Country 2024 & 2032
- Figure 35: Europe Electroencephalography Systems/Devices Market Revenue (Million), by Type 2024 & 2032
- Figure 36: Europe Electroencephalography Systems/Devices Market Volume (K Unit), by Type 2024 & 2032
- Figure 37: Europe Electroencephalography Systems/Devices Market Revenue Share (%), by Type 2024 & 2032
- Figure 38: Europe Electroencephalography Systems/Devices Market Volume Share (%), by Type 2024 & 2032
- Figure 39: Europe Electroencephalography Systems/Devices Market Revenue (Million), by End User 2024 & 2032
- Figure 40: Europe Electroencephalography Systems/Devices Market Volume (K Unit), by End User 2024 & 2032
- Figure 41: Europe Electroencephalography Systems/Devices Market Revenue Share (%), by End User 2024 & 2032
- Figure 42: Europe Electroencephalography Systems/Devices Market Volume Share (%), by End User 2024 & 2032
- Figure 43: Europe Electroencephalography Systems/Devices Market Revenue (Million), by Country 2024 & 2032
- Figure 44: Europe Electroencephalography Systems/Devices Market Volume (K Unit), by Country 2024 & 2032
- Figure 45: Europe Electroencephalography Systems/Devices Market Revenue Share (%), by Country 2024 & 2032
- Figure 46: Europe Electroencephalography Systems/Devices Market Volume Share (%), by Country 2024 & 2032
- Figure 47: Asia Pacific Electroencephalography Systems/Devices Market Revenue (Million), by Type 2024 & 2032
- Figure 48: Asia Pacific Electroencephalography Systems/Devices Market Volume (K Unit), by Type 2024 & 2032
- Figure 49: Asia Pacific Electroencephalography Systems/Devices Market Revenue Share (%), by Type 2024 & 2032
- Figure 50: Asia Pacific Electroencephalography Systems/Devices Market Volume Share (%), by Type 2024 & 2032
- Figure 51: Asia Pacific Electroencephalography Systems/Devices Market Revenue (Million), by End User 2024 & 2032
- Figure 52: Asia Pacific Electroencephalography Systems/Devices Market Volume (K Unit), by End User 2024 & 2032
- Figure 53: Asia Pacific Electroencephalography Systems/Devices Market Revenue Share (%), by End User 2024 & 2032
- Figure 54: Asia Pacific Electroencephalography Systems/Devices Market Volume Share (%), by End User 2024 & 2032
- Figure 55: Asia Pacific Electroencephalography Systems/Devices Market Revenue (Million), by Country 2024 & 2032
- Figure 56: Asia Pacific Electroencephalography Systems/Devices Market Volume (K Unit), by Country 2024 & 2032
- Figure 57: Asia Pacific Electroencephalography Systems/Devices Market Revenue Share (%), by Country 2024 & 2032
- Figure 58: Asia Pacific Electroencephalography Systems/Devices Market Volume Share (%), by Country 2024 & 2032
- Figure 59: Middle East and Africa Electroencephalography Systems/Devices Market Revenue (Million), by Type 2024 & 2032
- Figure 60: Middle East and Africa Electroencephalography Systems/Devices Market Volume (K Unit), by Type 2024 & 2032
- Figure 61: Middle East and Africa Electroencephalography Systems/Devices Market Revenue Share (%), by Type 2024 & 2032
- Figure 62: Middle East and Africa Electroencephalography Systems/Devices Market Volume Share (%), by Type 2024 & 2032
- Figure 63: Middle East and Africa Electroencephalography Systems/Devices Market Revenue (Million), by End User 2024 & 2032
- Figure 64: Middle East and Africa Electroencephalography Systems/Devices Market Volume (K Unit), by End User 2024 & 2032
- Figure 65: Middle East and Africa Electroencephalography Systems/Devices Market Revenue Share (%), by End User 2024 & 2032
- Figure 66: Middle East and Africa Electroencephalography Systems/Devices Market Volume Share (%), by End User 2024 & 2032
- Figure 67: Middle East and Africa Electroencephalography Systems/Devices Market Revenue (Million), by Country 2024 & 2032
- Figure 68: Middle East and Africa Electroencephalography Systems/Devices Market Volume (K Unit), by Country 2024 & 2032
- Figure 69: Middle East and Africa Electroencephalography Systems/Devices Market Revenue Share (%), by Country 2024 & 2032
- Figure 70: Middle East and Africa Electroencephalography Systems/Devices Market Volume Share (%), by Country 2024 & 2032
- Figure 71: South America Electroencephalography Systems/Devices Market Revenue (Million), by Type 2024 & 2032
- Figure 72: South America Electroencephalography Systems/Devices Market Volume (K Unit), by Type 2024 & 2032
- Figure 73: South America Electroencephalography Systems/Devices Market Revenue Share (%), by Type 2024 & 2032
- Figure 74: South America Electroencephalography Systems/Devices Market Volume Share (%), by Type 2024 & 2032
- Figure 75: South America Electroencephalography Systems/Devices Market Revenue (Million), by End User 2024 & 2032
- Figure 76: South America Electroencephalography Systems/Devices Market Volume (K Unit), by End User 2024 & 2032
- Figure 77: South America Electroencephalography Systems/Devices Market Revenue Share (%), by End User 2024 & 2032
- Figure 78: South America Electroencephalography Systems/Devices Market Volume Share (%), by End User 2024 & 2032
- Figure 79: South America Electroencephalography Systems/Devices Market Revenue (Million), by Country 2024 & 2032
- Figure 80: South America Electroencephalography Systems/Devices Market Volume (K Unit), by Country 2024 & 2032
- Figure 81: South America Electroencephalography Systems/Devices Market Revenue Share (%), by Country 2024 & 2032
- Figure 82: South America Electroencephalography Systems/Devices Market Volume Share (%), by Country 2024 & 2032
List of Tables
- Table 1: Global Electroencephalography Systems/Devices Market Revenue Million Forecast, by Region 2019 & 2032
- Table 2: Global Electroencephalography Systems/Devices Market Volume K Unit Forecast, by Region 2019 & 2032
- Table 3: Global Electroencephalography Systems/Devices Market Revenue Million Forecast, by Type 2019 & 2032
- Table 4: Global Electroencephalography Systems/Devices Market Volume K Unit Forecast, by Type 2019 & 2032
- Table 5: Global Electroencephalography Systems/Devices Market Revenue Million Forecast, by End User 2019 & 2032
- Table 6: Global Electroencephalography Systems/Devices Market Volume K Unit Forecast, by End User 2019 & 2032
- Table 7: Global Electroencephalography Systems/Devices Market Revenue Million Forecast, by Region 2019 & 2032
- Table 8: Global Electroencephalography Systems/Devices Market Volume K Unit Forecast, by Region 2019 & 2032
- Table 9: Global Electroencephalography Systems/Devices Market Revenue Million Forecast, by Country 2019 & 2032
- Table 10: Global Electroencephalography Systems/Devices Market Volume K Unit Forecast, by Country 2019 & 2032
- Table 11: United States Electroencephalography Systems/Devices Market Revenue (Million) Forecast, by Application 2019 & 2032
- Table 12: United States Electroencephalography Systems/Devices Market Volume (K Unit) Forecast, by Application 2019 & 2032
- Table 13: Canada Electroencephalography Systems/Devices Market Revenue (Million) Forecast, by Application 2019 & 2032
- Table 14: Canada Electroencephalography Systems/Devices Market Volume (K Unit) Forecast, by Application 2019 & 2032
- Table 15: Mexico Electroencephalography Systems/Devices Market Revenue (Million) Forecast, by Application 2019 & 2032
- Table 16: Mexico Electroencephalography Systems/Devices Market Volume (K Unit) Forecast, by Application 2019 & 2032
- Table 17: Global Electroencephalography Systems/Devices Market Revenue Million Forecast, by Country 2019 & 2032
- Table 18: Global Electroencephalography Systems/Devices Market Volume K Unit Forecast, by Country 2019 & 2032
- Table 19: Germany Electroencephalography Systems/Devices Market Revenue (Million) Forecast, by Application 2019 & 2032
- Table 20: Germany Electroencephalography Systems/Devices Market Volume (K Unit) Forecast, by Application 2019 & 2032
- Table 21: United Kingdom Electroencephalography Systems/Devices Market Revenue (Million) Forecast, by Application 2019 & 2032
- Table 22: United Kingdom Electroencephalography Systems/Devices Market Volume (K Unit) Forecast, by Application 2019 & 2032
- Table 23: France Electroencephalography Systems/Devices Market Revenue (Million) Forecast, by Application 2019 & 2032
- Table 24: France Electroencephalography Systems/Devices Market Volume (K Unit) Forecast, by Application 2019 & 2032
- Table 25: Italy Electroencephalography Systems/Devices Market Revenue (Million) Forecast, by Application 2019 & 2032
- Table 26: Italy Electroencephalography Systems/Devices Market Volume (K Unit) Forecast, by Application 2019 & 2032
- Table 27: Spain Electroencephalography Systems/Devices Market Revenue (Million) Forecast, by Application 2019 & 2032
- Table 28: Spain Electroencephalography Systems/Devices Market Volume (K Unit) Forecast, by Application 2019 & 2032
- Table 29: Rest of Europe Electroencephalography Systems/Devices Market Revenue (Million) Forecast, by Application 2019 & 2032
- Table 30: Rest of Europe Electroencephalography Systems/Devices Market Volume (K Unit) Forecast, by Application 2019 & 2032
- Table 31: Global Electroencephalography Systems/Devices Market Revenue Million Forecast, by Country 2019 & 2032
- Table 32: Global Electroencephalography Systems/Devices Market Volume K Unit Forecast, by Country 2019 & 2032
- Table 33: China Electroencephalography Systems/Devices Market Revenue (Million) Forecast, by Application 2019 & 2032
- Table 34: China Electroencephalography Systems/Devices Market Volume (K Unit) Forecast, by Application 2019 & 2032
- Table 35: Japan Electroencephalography Systems/Devices Market Revenue (Million) Forecast, by Application 2019 & 2032
- Table 36: Japan Electroencephalography Systems/Devices Market Volume (K Unit) Forecast, by Application 2019 & 2032
- Table 37: India Electroencephalography Systems/Devices Market Revenue (Million) Forecast, by Application 2019 & 2032
- Table 38: India Electroencephalography Systems/Devices Market Volume (K Unit) Forecast, by Application 2019 & 2032
- Table 39: Australia Electroencephalography Systems/Devices Market Revenue (Million) Forecast, by Application 2019 & 2032
- Table 40: Australia Electroencephalography Systems/Devices Market Volume (K Unit) Forecast, by Application 2019 & 2032
- Table 41: South Korea Electroencephalography Systems/Devices Market Revenue (Million) Forecast, by Application 2019 & 2032
- Table 42: South Korea Electroencephalography Systems/Devices Market Volume (K Unit) Forecast, by Application 2019 & 2032
- Table 43: Rest of Asia Pacific Electroencephalography Systems/Devices Market Revenue (Million) Forecast, by Application 2019 & 2032
- Table 44: Rest of Asia Pacific Electroencephalography Systems/Devices Market Volume (K Unit) Forecast, by Application 2019 & 2032
- Table 45: Global Electroencephalography Systems/Devices Market Revenue Million Forecast, by Country 2019 & 2032
- Table 46: Global Electroencephalography Systems/Devices Market Volume K Unit Forecast, by Country 2019 & 2032
- Table 47: GCC Electroencephalography Systems/Devices Market Revenue (Million) Forecast, by Application 2019 & 2032
- Table 48: GCC Electroencephalography Systems/Devices Market Volume (K Unit) Forecast, by Application 2019 & 2032
- Table 49: South Africa Electroencephalography Systems/Devices Market Revenue (Million) Forecast, by Application 2019 & 2032
- Table 50: South Africa Electroencephalography Systems/Devices Market Volume (K Unit) Forecast, by Application 2019 & 2032
- Table 51: Rest of Middle East and Africa Electroencephalography Systems/Devices Market Revenue (Million) Forecast, by Application 2019 & 2032
- Table 52: Rest of Middle East and Africa Electroencephalography Systems/Devices Market Volume (K Unit) Forecast, by Application 2019 & 2032
- Table 53: Global Electroencephalography Systems/Devices Market Revenue Million Forecast, by Country 2019 & 2032
- Table 54: Global Electroencephalography Systems/Devices Market Volume K Unit Forecast, by Country 2019 & 2032
- Table 55: Brazil Electroencephalography Systems/Devices Market Revenue (Million) Forecast, by Application 2019 & 2032
- Table 56: Brazil Electroencephalography Systems/Devices Market Volume (K Unit) Forecast, by Application 2019 & 2032
- Table 57: Argentina Electroencephalography Systems/Devices Market Revenue (Million) Forecast, by Application 2019 & 2032
- Table 58: Argentina Electroencephalography Systems/Devices Market Volume (K Unit) Forecast, by Application 2019 & 2032
- Table 59: Rest of South America Electroencephalography Systems/Devices Market Revenue (Million) Forecast, by Application 2019 & 2032
- Table 60: Rest of South America Electroencephalography Systems/Devices Market Volume (K Unit) Forecast, by Application 2019 & 2032
- Table 61: Global Electroencephalography Systems/Devices Market Revenue Million Forecast, by Type 2019 & 2032
- Table 62: Global Electroencephalography Systems/Devices Market Volume K Unit Forecast, by Type 2019 & 2032
- Table 63: Global Electroencephalography Systems/Devices Market Revenue Million Forecast, by End User 2019 & 2032
- Table 64: Global Electroencephalography Systems/Devices Market Volume K Unit Forecast, by End User 2019 & 2032
- Table 65: Global Electroencephalography Systems/Devices Market Revenue Million Forecast, by Country 2019 & 2032
- Table 66: Global Electroencephalography Systems/Devices Market Volume K Unit Forecast, by Country 2019 & 2032
- Table 67: United States Electroencephalography Systems/Devices Market Revenue (Million) Forecast, by Application 2019 & 2032
- Table 68: United States Electroencephalography Systems/Devices Market Volume (K Unit) Forecast, by Application 2019 & 2032
- Table 69: Canada Electroencephalography Systems/Devices Market Revenue (Million) Forecast, by Application 2019 & 2032
- Table 70: Canada Electroencephalography Systems/Devices Market Volume (K Unit) Forecast, by Application 2019 & 2032
- Table 71: Mexico Electroencephalography Systems/Devices Market Revenue (Million) Forecast, by Application 2019 & 2032
- Table 72: Mexico Electroencephalography Systems/Devices Market Volume (K Unit) Forecast, by Application 2019 & 2032
- Table 73: Global Electroencephalography Systems/Devices Market Revenue Million Forecast, by Type 2019 & 2032
- Table 74: Global Electroencephalography Systems/Devices Market Volume K Unit Forecast, by Type 2019 & 2032
- Table 75: Global Electroencephalography Systems/Devices Market Revenue Million Forecast, by End User 2019 & 2032
- Table 76: Global Electroencephalography Systems/Devices Market Volume K Unit Forecast, by End User 2019 & 2032
- Table 77: Global Electroencephalography Systems/Devices Market Revenue Million Forecast, by Country 2019 & 2032
- Table 78: Global Electroencephalography Systems/Devices Market Volume K Unit Forecast, by Country 2019 & 2032
- Table 79: Germany Electroencephalography Systems/Devices Market Revenue (Million) Forecast, by Application 2019 & 2032
- Table 80: Germany Electroencephalography Systems/Devices Market Volume (K Unit) Forecast, by Application 2019 & 2032
- Table 81: United Kingdom Electroencephalography Systems/Devices Market Revenue (Million) Forecast, by Application 2019 & 2032
- Table 82: United Kingdom Electroencephalography Systems/Devices Market Volume (K Unit) Forecast, by Application 2019 & 2032
- Table 83: France Electroencephalography Systems/Devices Market Revenue (Million) Forecast, by Application 2019 & 2032
- Table 84: France Electroencephalography Systems/Devices Market Volume (K Unit) Forecast, by Application 2019 & 2032
- Table 85: Italy Electroencephalography Systems/Devices Market Revenue (Million) Forecast, by Application 2019 & 2032
- Table 86: Italy Electroencephalography Systems/Devices Market Volume (K Unit) Forecast, by Application 2019 & 2032
- Table 87: Spain Electroencephalography Systems/Devices Market Revenue (Million) Forecast, by Application 2019 & 2032
- Table 88: Spain Electroencephalography Systems/Devices Market Volume (K Unit) Forecast, by Application 2019 & 2032
- Table 89: Rest of Europe Electroencephalography Systems/Devices Market Revenue (Million) Forecast, by Application 2019 & 2032
- Table 90: Rest of Europe Electroencephalography Systems/Devices Market Volume (K Unit) Forecast, by Application 2019 & 2032
- Table 91: Global Electroencephalography Systems/Devices Market Revenue Million Forecast, by Type 2019 & 2032
- Table 92: Global Electroencephalography Systems/Devices Market Volume K Unit Forecast, by Type 2019 & 2032
- Table 93: Global Electroencephalography Systems/Devices Market Revenue Million Forecast, by End User 2019 & 2032
- Table 94: Global Electroencephalography Systems/Devices Market Volume K Unit Forecast, by End User 2019 & 2032
- Table 95: Global Electroencephalography Systems/Devices Market Revenue Million Forecast, by Country 2019 & 2032
- Table 96: Global Electroencephalography Systems/Devices Market Volume K Unit Forecast, by Country 2019 & 2032
- Table 97: China Electroencephalography Systems/Devices Market Revenue (Million) Forecast, by Application 2019 & 2032
- Table 98: China Electroencephalography Systems/Devices Market Volume (K Unit) Forecast, by Application 2019 & 2032
- Table 99: Japan Electroencephalography Systems/Devices Market Revenue (Million) Forecast, by Application 2019 & 2032
- Table 100: Japan Electroencephalography Systems/Devices Market Volume (K Unit) Forecast, by Application 2019 & 2032
- Table 101: India Electroencephalography Systems/Devices Market Revenue (Million) Forecast, by Application 2019 & 2032
- Table 102: India Electroencephalography Systems/Devices Market Volume (K Unit) Forecast, by Application 2019 & 2032
- Table 103: Australia Electroencephalography Systems/Devices Market Revenue (Million) Forecast, by Application 2019 & 2032
- Table 104: Australia Electroencephalography Systems/Devices Market Volume (K Unit) Forecast, by Application 2019 & 2032
- Table 105: South Korea Electroencephalography Systems/Devices Market Revenue (Million) Forecast, by Application 2019 & 2032
- Table 106: South Korea Electroencephalography Systems/Devices Market Volume (K Unit) Forecast, by Application 2019 & 2032
- Table 107: Rest of Asia Pacific Electroencephalography Systems/Devices Market Revenue (Million) Forecast, by Application 2019 & 2032
- Table 108: Rest of Asia Pacific Electroencephalography Systems/Devices Market Volume (K Unit) Forecast, by Application 2019 & 2032
- Table 109: Global Electroencephalography Systems/Devices Market Revenue Million Forecast, by Type 2019 & 2032
- Table 110: Global Electroencephalography Systems/Devices Market Volume K Unit Forecast, by Type 2019 & 2032
- Table 111: Global Electroencephalography Systems/Devices Market Revenue Million Forecast, by End User 2019 & 2032
- Table 112: Global Electroencephalography Systems/Devices Market Volume K Unit Forecast, by End User 2019 & 2032
- Table 113: Global Electroencephalography Systems/Devices Market Revenue Million Forecast, by Country 2019 & 2032
- Table 114: Global Electroencephalography Systems/Devices Market Volume K Unit Forecast, by Country 2019 & 2032
- Table 115: GCC Electroencephalography Systems/Devices Market Revenue (Million) Forecast, by Application 2019 & 2032
- Table 116: GCC Electroencephalography Systems/Devices Market Volume (K Unit) Forecast, by Application 2019 & 2032
- Table 117: South Africa Electroencephalography Systems/Devices Market Revenue (Million) Forecast, by Application 2019 & 2032
- Table 118: South Africa Electroencephalography Systems/Devices Market Volume (K Unit) Forecast, by Application 2019 & 2032
- Table 119: Rest of Middle East and Africa Electroencephalography Systems/Devices Market Revenue (Million) Forecast, by Application 2019 & 2032
- Table 120: Rest of Middle East and Africa Electroencephalography Systems/Devices Market Volume (K Unit) Forecast, by Application 2019 & 2032
- Table 121: Global Electroencephalography Systems/Devices Market Revenue Million Forecast, by Type 2019 & 2032
- Table 122: Global Electroencephalography Systems/Devices Market Volume K Unit Forecast, by Type 2019 & 2032
- Table 123: Global Electroencephalography Systems/Devices Market Revenue Million Forecast, by End User 2019 & 2032
- Table 124: Global Electroencephalography Systems/Devices Market Volume K Unit Forecast, by End User 2019 & 2032
- Table 125: Global Electroencephalography Systems/Devices Market Revenue Million Forecast, by Country 2019 & 2032
- Table 126: Global Electroencephalography Systems/Devices Market Volume K Unit Forecast, by Country 2019 & 2032
- Table 127: Brazil Electroencephalography Systems/Devices Market Revenue (Million) Forecast, by Application 2019 & 2032
- Table 128: Brazil Electroencephalography Systems/Devices Market Volume (K Unit) Forecast, by Application 2019 & 2032
- Table 129: Argentina Electroencephalography Systems/Devices Market Revenue (Million) Forecast, by Application 2019 & 2032
- Table 130: Argentina Electroencephalography Systems/Devices Market Volume (K Unit) Forecast, by Application 2019 & 2032
- Table 131: Rest of South America Electroencephalography Systems/Devices Market Revenue (Million) Forecast, by Application 2019 & 2032
- Table 132: Rest of South America Electroencephalography Systems/Devices Market Volume (K Unit) Forecast, by Application 2019 & 2032
Frequently Asked Questions
1. What is the projected Compound Annual Growth Rate (CAGR) of the Electroencephalography Systems/Devices Market?
The projected CAGR is approximately 8.00%.
2. Which companies are prominent players in the Electroencephalography Systems/Devices Market?
Key companies in the market include Cephalon A/S, Medtronic, Natus Medical Inc, Compumedics Limited, Advanced Brain Monitoring Inc, Cadwell Industries Inc, Fresenius SE & Co KGaA, General Electric Company (GE Healthcare), NeuroWave Systems Inc, Koninklijke Philips N V (Philips Healthcare), Nihon Kohden Corporation.
3. What are the main segments of the Electroencephalography Systems/Devices Market?
The market segments include Type, End User.
4. Can you provide details about the market size?
The market size is estimated to be USD XX Million as of 2022.
5. What are some drivers contributing to market growth?
Rising R&D Expenditure; Increasing Prevalence of Neurological Disorders.
6. What are the notable trends driving market growth?
Standalone Electroencephalography System is Expected to Witness a Healthy Growth in Future.
7. Are there any restraints impacting market growth?
Limitation of Electroencephalography System.
8. Can you provide examples of recent developments in the market?
In March 2022, Interaxon Inc. launched VR Software Development Kit (SDK) alongside a new EEG headband compatible with all major VR head-mounted displays (HMDs), building off Interaxon's second-generation EEG meditation and sleep headband.
9. What pricing options are available for accessing the report?
Pricing options include single-user, multi-user, and enterprise licenses priced at USD 4750, USD 5250, and USD 8750 respectively.
10. Is the market size provided in terms of value or volume?
The market size is provided in terms of value, measured in Million and volume, measured in K Unit.
11. Are there any specific market keywords associated with the report?
Yes, the market keyword associated with the report is "Electroencephalography Systems/Devices Market," which aids in identifying and referencing the specific market segment covered.
12. How do I determine which pricing option suits my needs best?
The pricing options vary based on user requirements and access needs. Individual users may opt for single-user licenses, while businesses requiring broader access may choose multi-user or enterprise licenses for cost-effective access to the report.
13. Are there any additional resources or data provided in the Electroencephalography Systems/Devices Market report?
While the report offers comprehensive insights, it's advisable to review the specific contents or supplementary materials provided to ascertain if additional resources or data are available.
14. How can I stay updated on further developments or reports in the Electroencephalography Systems/Devices Market?
To stay informed about further developments, trends, and reports in the Electroencephalography Systems/Devices Market, consider subscribing to industry newsletters, following relevant companies and organizations, or regularly checking reputable industry news sources and publications.
Methodology
Step 1 - Identification of Relevant Samples Size from Population Database


Step 2 - Approaches for Defining Global Market Size (Value, Volume* & Price*)

Note*: In applicable scenarios
Step 3 - Data Sources
Primary Research
- Web Analytics
- Survey Reports
- Research Institute
- Latest Research Reports
- Opinion Leaders
Secondary Research
- Annual Reports
- White Paper
- Latest Press Release
- Industry Association
- Paid Database
- Investor Presentations

Step 4 - Data Triangulation
Involves using different sources of information in order to increase the validity of a study
These sources are likely to be stakeholders in a program - participants, other researchers, program staff, other community members, and so on.
Then we put all data in single framework & apply various statistical tools to find out the dynamic on the market.
During the analysis stage, feedback from the stakeholder groups would be compared to determine areas of agreement as well as areas of divergence
