

Key Insights
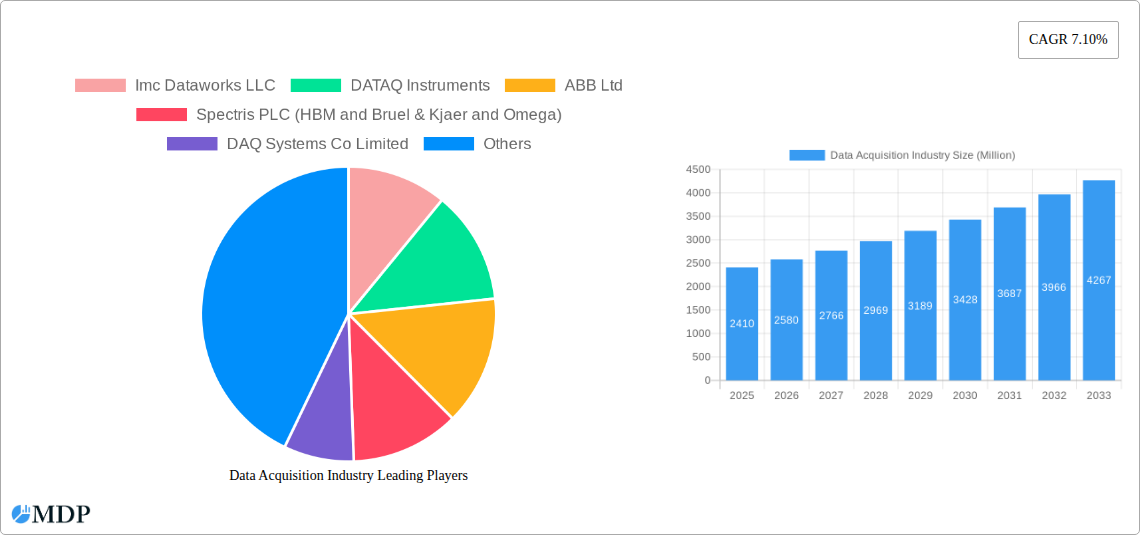
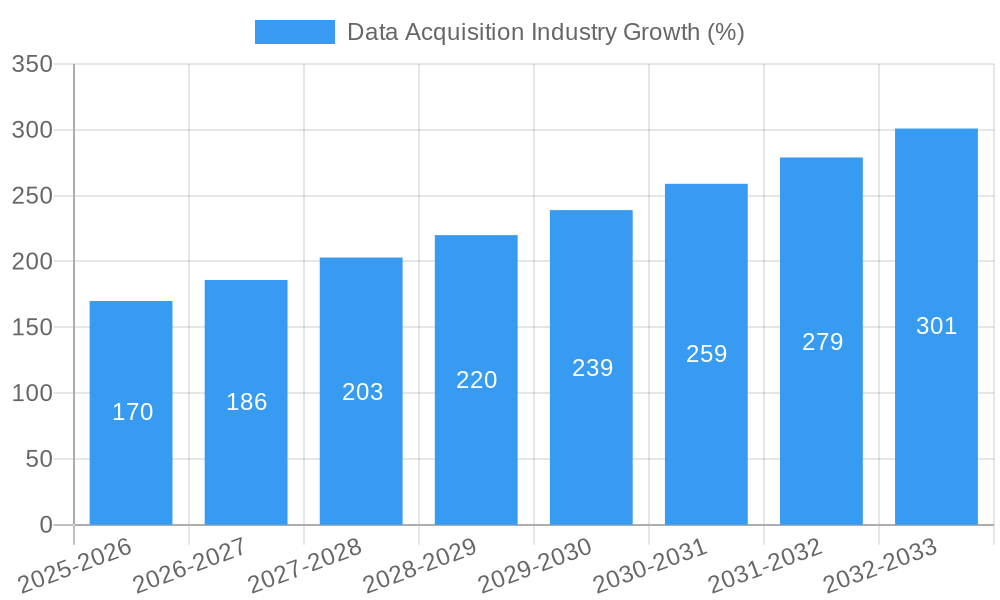
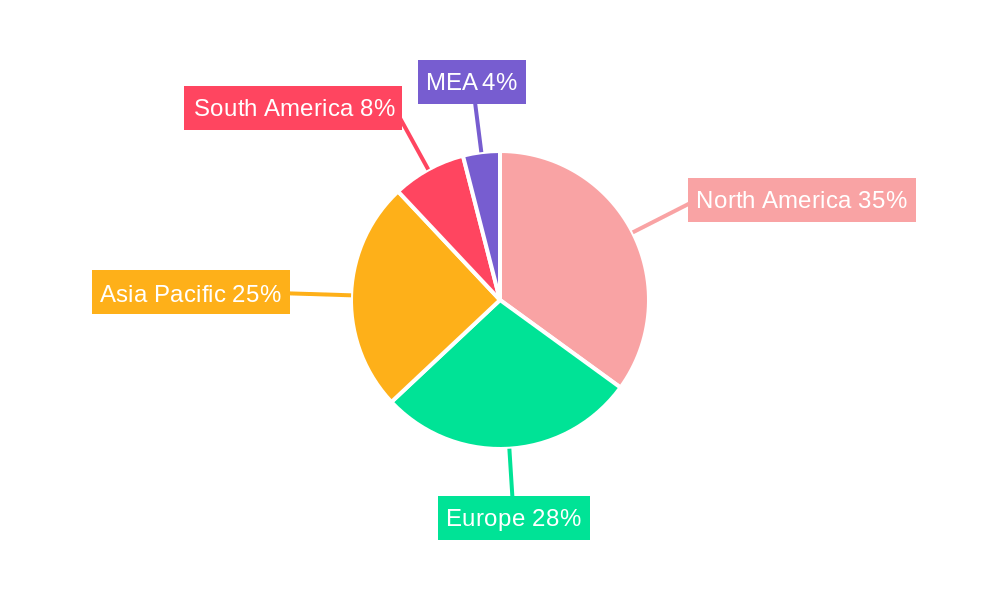
The global data acquisition (DAQ) market, valued at $2.41 billion in 2025, is projected to experience robust growth, driven by increasing automation across various industries and the burgeoning demand for real-time data analysis. The Compound Annual Growth Rate (CAGR) of 7.10% from 2025 to 2033 indicates a significant expansion of this market. Key drivers include the proliferation of smart devices and IoT applications, the rise of Industry 4.0 initiatives emphasizing data-driven decision-making, and the expanding need for precise and reliable data measurement in sectors like automotive, energy, and healthcare. Furthermore, advancements in sensor technology, providing more accurate and diverse data streams, are fueling market growth. The hardware segment currently dominates the market, but the software segment is anticipated to witness faster growth due to the increasing sophistication of data analysis tools and software solutions. Geographically, North America is expected to hold a significant market share owing to established industrial infrastructure and technological advancements. However, Asia-Pacific is projected to exhibit higher growth rates fueled by rapid industrialization and increasing adoption of DAQ systems in emerging economies.
Challenges faced by the DAQ industry include the high initial investment costs associated with implementing DAQ systems, the complexities involved in data integration and management, and the need for skilled professionals to operate and maintain these systems. Despite these restraints, the market is expected to remain resilient due to the increasing benefits offered by DAQ solutions in terms of enhanced operational efficiency, improved product quality, and reduced operational costs. The growing emphasis on data security and privacy will also influence market growth, driving demand for robust and secure DAQ systems. Competitive landscape analysis reveals the presence of both established players like National Instruments, Keysight Technologies, and Siemens, and emerging technology providers, indicating a dynamic and innovative market environment. The continuing expansion of various industry verticals and the increasing focus on data-driven decision-making are poised to propel the global data acquisition market to significant heights in the coming years.
Data Acquisition Industry Market Report: 2019-2033
This comprehensive report provides an in-depth analysis of the Data Acquisition (DAQ) industry, offering invaluable insights for stakeholders seeking to navigate this dynamic market. With a study period spanning 2019-2033, a base year of 2025, and a forecast period from 2025-2033, this report unveils crucial market trends, competitive landscapes, and future growth opportunities. The market is projected to reach xx Million by 2033, exhibiting a robust CAGR of xx% during the forecast period.
Data Acquisition Industry Market Dynamics & Concentration
The global data acquisition market is characterized by a moderately concentrated landscape, with several key players holding significant market share. The market share of the top 5 players is estimated to be around xx%, with the remaining share distributed among numerous smaller companies and niche players. Innovation is a key driver, with continuous advancements in sensor technology, data processing capabilities, and connectivity solutions shaping the industry's evolution. Stringent regulatory frameworks, particularly concerning data security and privacy, are influencing market dynamics. Product substitutes, such as cloud-based data analytics platforms, pose a competitive threat, although the advantages of dedicated DAQ systems in certain applications remain significant.
End-user trends are heavily influencing market growth, with increasing demand from sectors like automotive, aerospace, and renewable energy. Mergers and acquisitions (M&A) activity within the DAQ industry has been moderate in recent years, with an estimated xx M&A deals recorded between 2019 and 2024. These activities have primarily focused on expanding product portfolios, enhancing technological capabilities, and entering new markets.
- Market Concentration: Top 5 players hold approximately xx% market share.
- Innovation Drivers: Advancements in sensor technology, data processing, and connectivity.
- Regulatory Frameworks: Data security and privacy regulations impact market strategies.
- M&A Activity: Approximately xx deals between 2019 and 2024.
Data Acquisition Industry Industry Trends & Analysis
The Data Acquisition market is witnessing significant growth, driven by the increasing adoption of automation and digitization across various industries. The rising demand for real-time data analysis, coupled with the proliferation of IoT devices and advanced analytics, is fueling market expansion. Technological disruptions, such as the development of advanced sensor technologies and AI-powered data analysis tools, are reshaping the competitive landscape. Consumer preferences are shifting towards more versatile, scalable, and user-friendly DAQ solutions. Competitive dynamics are intensifying, with players focusing on product innovation, strategic partnerships, and geographic expansion to gain a competitive edge. The global market is projected to achieve xx Million by 2033, reflecting a strong CAGR of xx% during the forecast period. Market penetration is expanding rapidly in developing economies, driven by industrialization and infrastructure development.
Leading Markets & Segments in Data Acquisition Industry
The North American region currently dominates the data acquisition market, followed by Europe and Asia-Pacific. Within the channel segment, the “Greater than 32” channel holds the largest market share, driven by the requirements of large-scale industrial applications. Hardware remains the dominant product type, accounting for approximately xx% of the market, while the software segment is growing steadily, driven by the increasing demand for advanced data analytics capabilities. The power & energy sector is the leading end-user vertical, benefiting from the growth in renewable energy and smart grid initiatives.
Key Drivers:
- North America: Strong industrial base, advanced technology adoption, robust R&D spending.
- Europe: High automation rates in manufacturing and process industries.
- Asia-Pacific: Rapid industrialization, growing infrastructure investment.
- Power & Energy: Demand for smart grid technologies and renewable energy monitoring.
- Automotive: Increased use of ADAS and autonomous driving technologies.
Dominance Analysis: North America leads due to high technological maturity and strong industrial presence. The "Greater than 32" channel dominates due to the requirements of large scale applications. The Hardware segment is prominent due to its inherent capabilities for data acquisition in varied applications.
Data Acquisition Industry Product Developments
Recent product innovations in the DAQ industry have focused on enhancing connectivity, data processing capabilities, and user-friendliness. Wireless DAQ systems are gaining popularity for their flexibility and ease of deployment, while cloud-based solutions are enabling remote monitoring and data analysis. The integration of AI and machine learning algorithms is improving data analysis capabilities and enabling predictive maintenance. These advancements are improving the market fit of DAQ systems across diverse applications, contributing to higher market penetration and growth.
Key Drivers of Data Acquisition Industry Growth
Several factors are driving the growth of the DAQ market:
- Technological Advancements: Miniaturization of sensors, improved data processing capabilities, and advancements in wireless communication technologies are key drivers.
- Economic Growth: Increased industrialization and infrastructure development in developing economies are boosting demand.
- Regulatory Mandates: Governments are increasingly mandating the adoption of data acquisition systems for environmental monitoring and safety compliance. For example, stricter emissions regulations in various countries encourage the adoption of DAQ systems in the automotive and manufacturing sectors.
Challenges in the Data Acquisition Industry Market
The DAQ market faces several challenges, including:
- Supply Chain Disruptions: Global supply chain disruptions can impact the availability of key components and increase production costs. This issue has been particularly visible in recent years, resulting in xx% increase in prices for specific DAQ components.
- Cybersecurity Concerns: The increasing reliance on networked DAQ systems raises concerns about data security and cyberattacks. This has led to increased demand for security-enhanced DAQ systems, impacting overall market costs.
- Competitive Pressure: The market is characterized by intense competition, requiring companies to constantly innovate and offer competitive pricing to maintain market share.
Emerging Opportunities in Data Acquisition Industry
The DAQ market presents several compelling opportunities for future growth:
The increasing adoption of IoT and the development of advanced analytics capabilities are opening new avenues for data acquisition and analysis. Strategic partnerships and collaborations between DAQ providers and software companies are enhancing the value proposition of DAQ systems. Market expansion into emerging economies and new application areas will create significant opportunities for growth. The integration of DAQ systems into other technologies (e.g., cloud platforms) is driving market expansion and revenue growth.
Leading Players in the Data Acquisition Industry Sector
- Imc Dataworks LLC
- DATAQ Instruments
- ABB Ltd
- Spectris PLC (HBM and Bruel & Kjaer and Omega)
- DAQ Systems Co Limited
- Keysight Technologies
- National Instruments Corporation
- Yokogawa Electric Co
- Emerson Electric Co
- Siemens AG
- Schneider Electric SE
- Omron Corporation
- General Electric Ltd
- Honeywell International
- Beijing GEMOTECH Intelligent Technology
- ADLINK Technology Inc
- Advantech Co Ltd
- Rockwell Automation Inc
- Curtiss-Wright Corporation
- Tektronix
- Bustec
- AMETEK (VTI Instruments)
Key Milestones in Data Acquisition Industry Industry
- December 2021: ABB India partnered with Indore smart city development to deploy digital technology enabling continuous electricity supply, showcasing the role of DAQ in smart city initiatives.
- June 2022: Advantech launched the iDAQ series of modular DAQ modules and chassis, signifying advancements in modularity and scalability of DAQ systems.
Strategic Outlook for Data Acquisition Industry Market
The future of the Data Acquisition market is bright, driven by ongoing technological advancements, increasing demand for real-time data analysis across various industries, and the growth of IoT. Strategic partnerships, investments in R&D, and expansion into new markets are expected to be key growth accelerators. Companies focusing on developing innovative and user-friendly solutions with enhanced data security features will be well-positioned to capitalize on the significant growth potential in this market.
Data Acquisition Industry Segmentation
-
1. Channel
- 1.1. Less than 32
- 1.2. 32-128
- 1.3. Greater than 128
-
2. Type
- 2.1. Hardware
- 2.2. Software
-
3. End-User Vertical
- 3.1. Water and Waste Treatment
- 3.2. Power & Energy
- 3.3. Automotive
- 3.4. Education and Research
- 3.5. Aerospace & Defense
- 3.6. Paper and Pulp
- 3.7. Chemicals
- 3.8. Other End-Users
Data Acquisition Industry Segmentation By Geography
- 1. North America
- 2. Europe
- 3. Asia Pacific
- 4. Rest of the World
Data Acquisition Industry REPORT HIGHLIGHTS
| Aspects | Details |
|---|---|
| Study Period | 2019-2033 |
| Base Year | 2024 |
| Estimated Year | 2025 |
| Forecast Period | 2025-2033 |
| Historical Period | 2019-2024 |
| Growth Rate | CAGR of 7.10% from 2019-2033 |
| Segmentation |
|
Table of Contents
- 1. Introduction
- 1.1. Research Scope
- 1.2. Market Segmentation
- 1.3. Research Methodology
- 1.4. Definitions and Assumptions
- 2. Executive Summary
- 2.1. Introduction
- 3. Market Dynamics
- 3.1. Introduction
- 3.2. Market Drivers
- 3.2.1. Growing Adoption of Industrial Ethernet Solutions; Increasing Complexity in Manufacturing Establishments is Driving Operators Towards Adoption of DAQ for Design Validation and Testing; Technological Advancements Such as Edge Computing and TSN
- 3.3. Market Restrains
- 3.3.1. Cost Implications and Saturation in Key Markets Could Hinder Growth Over the Forecast Period
- 3.4. Market Trends
- 3.4.1. Aerospace and Defense Accounts for Significant Share in the Market
- 4. Market Factor Analysis
- 4.1. Porters Five Forces
- 4.2. Supply/Value Chain
- 4.3. PESTEL analysis
- 4.4. Market Entropy
- 4.5. Patent/Trademark Analysis
- 5. Global Data Acquisition Industry Analysis, Insights and Forecast, 2019-2031
- 5.1. Market Analysis, Insights and Forecast - by Channel
- 5.1.1. Less than 32
- 5.1.2. 32-128
- 5.1.3. Greater than 128
- 5.2. Market Analysis, Insights and Forecast - by Type
- 5.2.1. Hardware
- 5.2.2. Software
- 5.3. Market Analysis, Insights and Forecast - by End-User Vertical
- 5.3.1. Water and Waste Treatment
- 5.3.2. Power & Energy
- 5.3.3. Automotive
- 5.3.4. Education and Research
- 5.3.5. Aerospace & Defense
- 5.3.6. Paper and Pulp
- 5.3.7. Chemicals
- 5.3.8. Other End-Users
- 5.4. Market Analysis, Insights and Forecast - by Region
- 5.4.1. North America
- 5.4.2. Europe
- 5.4.3. Asia Pacific
- 5.4.4. Rest of the World
- 5.1. Market Analysis, Insights and Forecast - by Channel
- 6. North America Data Acquisition Industry Analysis, Insights and Forecast, 2019-2031
- 6.1. Market Analysis, Insights and Forecast - by Channel
- 6.1.1. Less than 32
- 6.1.2. 32-128
- 6.1.3. Greater than 128
- 6.2. Market Analysis, Insights and Forecast - by Type
- 6.2.1. Hardware
- 6.2.2. Software
- 6.3. Market Analysis, Insights and Forecast - by End-User Vertical
- 6.3.1. Water and Waste Treatment
- 6.3.2. Power & Energy
- 6.3.3. Automotive
- 6.3.4. Education and Research
- 6.3.5. Aerospace & Defense
- 6.3.6. Paper and Pulp
- 6.3.7. Chemicals
- 6.3.8. Other End-Users
- 6.1. Market Analysis, Insights and Forecast - by Channel
- 7. Europe Data Acquisition Industry Analysis, Insights and Forecast, 2019-2031
- 7.1. Market Analysis, Insights and Forecast - by Channel
- 7.1.1. Less than 32
- 7.1.2. 32-128
- 7.1.3. Greater than 128
- 7.2. Market Analysis, Insights and Forecast - by Type
- 7.2.1. Hardware
- 7.2.2. Software
- 7.3. Market Analysis, Insights and Forecast - by End-User Vertical
- 7.3.1. Water and Waste Treatment
- 7.3.2. Power & Energy
- 7.3.3. Automotive
- 7.3.4. Education and Research
- 7.3.5. Aerospace & Defense
- 7.3.6. Paper and Pulp
- 7.3.7. Chemicals
- 7.3.8. Other End-Users
- 7.1. Market Analysis, Insights and Forecast - by Channel
- 8. Asia Pacific Data Acquisition Industry Analysis, Insights and Forecast, 2019-2031
- 8.1. Market Analysis, Insights and Forecast - by Channel
- 8.1.1. Less than 32
- 8.1.2. 32-128
- 8.1.3. Greater than 128
- 8.2. Market Analysis, Insights and Forecast - by Type
- 8.2.1. Hardware
- 8.2.2. Software
- 8.3. Market Analysis, Insights and Forecast - by End-User Vertical
- 8.3.1. Water and Waste Treatment
- 8.3.2. Power & Energy
- 8.3.3. Automotive
- 8.3.4. Education and Research
- 8.3.5. Aerospace & Defense
- 8.3.6. Paper and Pulp
- 8.3.7. Chemicals
- 8.3.8. Other End-Users
- 8.1. Market Analysis, Insights and Forecast - by Channel
- 9. Rest of the World Data Acquisition Industry Analysis, Insights and Forecast, 2019-2031
- 9.1. Market Analysis, Insights and Forecast - by Channel
- 9.1.1. Less than 32
- 9.1.2. 32-128
- 9.1.3. Greater than 128
- 9.2. Market Analysis, Insights and Forecast - by Type
- 9.2.1. Hardware
- 9.2.2. Software
- 9.3. Market Analysis, Insights and Forecast - by End-User Vertical
- 9.3.1. Water and Waste Treatment
- 9.3.2. Power & Energy
- 9.3.3. Automotive
- 9.3.4. Education and Research
- 9.3.5. Aerospace & Defense
- 9.3.6. Paper and Pulp
- 9.3.7. Chemicals
- 9.3.8. Other End-Users
- 9.1. Market Analysis, Insights and Forecast - by Channel
- 10. North America Data Acquisition Industry Analysis, Insights and Forecast, 2019-2031
- 10.1. Market Analysis, Insights and Forecast - By Country/Sub-region
- 10.1.1 United States
- 10.1.2 Canada
- 10.1.3 Mexico
- 11. Europe Data Acquisition Industry Analysis, Insights and Forecast, 2019-2031
- 11.1. Market Analysis, Insights and Forecast - By Country/Sub-region
- 11.1.1 Germany
- 11.1.2 United Kingdom
- 11.1.3 France
- 11.1.4 Spain
- 11.1.5 Italy
- 11.1.6 Spain
- 11.1.7 Belgium
- 11.1.8 Netherland
- 11.1.9 Nordics
- 11.1.10 Rest of Europe
- 12. Asia Pacific Data Acquisition Industry Analysis, Insights and Forecast, 2019-2031
- 12.1. Market Analysis, Insights and Forecast - By Country/Sub-region
- 12.1.1 China
- 12.1.2 Japan
- 12.1.3 India
- 12.1.4 South Korea
- 12.1.5 Southeast Asia
- 12.1.6 Australia
- 12.1.7 Indonesia
- 12.1.8 Phillipes
- 12.1.9 Singapore
- 12.1.10 Thailandc
- 12.1.11 Rest of Asia Pacific
- 13. South America Data Acquisition Industry Analysis, Insights and Forecast, 2019-2031
- 13.1. Market Analysis, Insights and Forecast - By Country/Sub-region
- 13.1.1 Brazil
- 13.1.2 Argentina
- 13.1.3 Peru
- 13.1.4 Chile
- 13.1.5 Colombia
- 13.1.6 Ecuador
- 13.1.7 Venezuela
- 13.1.8 Rest of South America
- 14. North America Data Acquisition Industry Analysis, Insights and Forecast, 2019-2031
- 14.1. Market Analysis, Insights and Forecast - By Country/Sub-region
- 14.1.1 United States
- 14.1.2 Canada
- 14.1.3 Mexico
- 15. MEA Data Acquisition Industry Analysis, Insights and Forecast, 2019-2031
- 15.1. Market Analysis, Insights and Forecast - By Country/Sub-region
- 15.1.1 United Arab Emirates
- 15.1.2 Saudi Arabia
- 15.1.3 South Africa
- 15.1.4 Rest of Middle East and Africa
- 16. Competitive Analysis
- 16.1. Global Market Share Analysis 2024
- 16.2. Company Profiles
- 16.2.1 Imc Dataworks LLC
- 16.2.1.1. Overview
- 16.2.1.2. Products
- 16.2.1.3. SWOT Analysis
- 16.2.1.4. Recent Developments
- 16.2.1.5. Financials (Based on Availability)
- 16.2.2 DATAQ Instruments
- 16.2.2.1. Overview
- 16.2.2.2. Products
- 16.2.2.3. SWOT Analysis
- 16.2.2.4. Recent Developments
- 16.2.2.5. Financials (Based on Availability)
- 16.2.3 ABB Ltd
- 16.2.3.1. Overview
- 16.2.3.2. Products
- 16.2.3.3. SWOT Analysis
- 16.2.3.4. Recent Developments
- 16.2.3.5. Financials (Based on Availability)
- 16.2.4 Spectris PLC (HBM and Bruel & Kjaer and Omega)
- 16.2.4.1. Overview
- 16.2.4.2. Products
- 16.2.4.3. SWOT Analysis
- 16.2.4.4. Recent Developments
- 16.2.4.5. Financials (Based on Availability)
- 16.2.5 DAQ Systems Co Limited
- 16.2.5.1. Overview
- 16.2.5.2. Products
- 16.2.5.3. SWOT Analysis
- 16.2.5.4. Recent Developments
- 16.2.5.5. Financials (Based on Availability)
- 16.2.6 Keysight Technologies
- 16.2.6.1. Overview
- 16.2.6.2. Products
- 16.2.6.3. SWOT Analysis
- 16.2.6.4. Recent Developments
- 16.2.6.5. Financials (Based on Availability)
- 16.2.7 National Instruments Corporation
- 16.2.7.1. Overview
- 16.2.7.2. Products
- 16.2.7.3. SWOT Analysis
- 16.2.7.4. Recent Developments
- 16.2.7.5. Financials (Based on Availability)
- 16.2.8 Yokogawa Electric Co
- 16.2.8.1. Overview
- 16.2.8.2. Products
- 16.2.8.3. SWOT Analysis
- 16.2.8.4. Recent Developments
- 16.2.8.5. Financials (Based on Availability)
- 16.2.9 Emerson Electric Co
- 16.2.9.1. Overview
- 16.2.9.2. Products
- 16.2.9.3. SWOT Analysis
- 16.2.9.4. Recent Developments
- 16.2.9.5. Financials (Based on Availability)
- 16.2.10 Siemens AG
- 16.2.10.1. Overview
- 16.2.10.2. Products
- 16.2.10.3. SWOT Analysis
- 16.2.10.4. Recent Developments
- 16.2.10.5. Financials (Based on Availability)
- 16.2.11 Schneider Electric SE
- 16.2.11.1. Overview
- 16.2.11.2. Products
- 16.2.11.3. SWOT Analysis
- 16.2.11.4. Recent Developments
- 16.2.11.5. Financials (Based on Availability)
- 16.2.12 Omron Corporation
- 16.2.12.1. Overview
- 16.2.12.2. Products
- 16.2.12.3. SWOT Analysis
- 16.2.12.4. Recent Developments
- 16.2.12.5. Financials (Based on Availability)
- 16.2.13 General Electric Ltd
- 16.2.13.1. Overview
- 16.2.13.2. Products
- 16.2.13.3. SWOT Analysis
- 16.2.13.4. Recent Developments
- 16.2.13.5. Financials (Based on Availability)
- 16.2.14 Honeywell International
- 16.2.14.1. Overview
- 16.2.14.2. Products
- 16.2.14.3. SWOT Analysis
- 16.2.14.4. Recent Developments
- 16.2.14.5. Financials (Based on Availability)
- 16.2.15 Beijing GEMOTECH Intelligent Technology
- 16.2.15.1. Overview
- 16.2.15.2. Products
- 16.2.15.3. SWOT Analysis
- 16.2.15.4. Recent Developments
- 16.2.15.5. Financials (Based on Availability)
- 16.2.16 ADLINK Technology Inc
- 16.2.16.1. Overview
- 16.2.16.2. Products
- 16.2.16.3. SWOT Analysis
- 16.2.16.4. Recent Developments
- 16.2.16.5. Financials (Based on Availability)
- 16.2.17 Advantech Co Ltd
- 16.2.17.1. Overview
- 16.2.17.2. Products
- 16.2.17.3. SWOT Analysis
- 16.2.17.4. Recent Developments
- 16.2.17.5. Financials (Based on Availability)
- 16.2.18 Rockwell Automation Inc
- 16.2.18.1. Overview
- 16.2.18.2. Products
- 16.2.18.3. SWOT Analysis
- 16.2.18.4. Recent Developments
- 16.2.18.5. Financials (Based on Availability)
- 16.2.19 Curtiss-Wright Corporation
- 16.2.19.1. Overview
- 16.2.19.2. Products
- 16.2.19.3. SWOT Analysis
- 16.2.19.4. Recent Developments
- 16.2.19.5. Financials (Based on Availability)
- 16.2.20 Tektronix
- 16.2.20.1. Overview
- 16.2.20.2. Products
- 16.2.20.3. SWOT Analysis
- 16.2.20.4. Recent Developments
- 16.2.20.5. Financials (Based on Availability)
- 16.2.21 Bustec
- 16.2.21.1. Overview
- 16.2.21.2. Products
- 16.2.21.3. SWOT Analysis
- 16.2.21.4. Recent Developments
- 16.2.21.5. Financials (Based on Availability)
- 16.2.22 AMETEK (VTI Instruments)
- 16.2.22.1. Overview
- 16.2.22.2. Products
- 16.2.22.3. SWOT Analysis
- 16.2.22.4. Recent Developments
- 16.2.22.5. Financials (Based on Availability)
- 16.2.1 Imc Dataworks LLC
List of Figures
- Figure 1: Global Data Acquisition Industry Revenue Breakdown (Million, %) by Region 2024 & 2032
- Figure 2: Global Data Acquisition Industry Volume Breakdown (K Unit, %) by Region 2024 & 2032
- Figure 3: North America Data Acquisition Industry Revenue (Million), by Country 2024 & 2032
- Figure 4: North America Data Acquisition Industry Volume (K Unit), by Country 2024 & 2032
- Figure 5: North America Data Acquisition Industry Revenue Share (%), by Country 2024 & 2032
- Figure 6: North America Data Acquisition Industry Volume Share (%), by Country 2024 & 2032
- Figure 7: Europe Data Acquisition Industry Revenue (Million), by Country 2024 & 2032
- Figure 8: Europe Data Acquisition Industry Volume (K Unit), by Country 2024 & 2032
- Figure 9: Europe Data Acquisition Industry Revenue Share (%), by Country 2024 & 2032
- Figure 10: Europe Data Acquisition Industry Volume Share (%), by Country 2024 & 2032
- Figure 11: Asia Pacific Data Acquisition Industry Revenue (Million), by Country 2024 & 2032
- Figure 12: Asia Pacific Data Acquisition Industry Volume (K Unit), by Country 2024 & 2032
- Figure 13: Asia Pacific Data Acquisition Industry Revenue Share (%), by Country 2024 & 2032
- Figure 14: Asia Pacific Data Acquisition Industry Volume Share (%), by Country 2024 & 2032
- Figure 15: South America Data Acquisition Industry Revenue (Million), by Country 2024 & 2032
- Figure 16: South America Data Acquisition Industry Volume (K Unit), by Country 2024 & 2032
- Figure 17: South America Data Acquisition Industry Revenue Share (%), by Country 2024 & 2032
- Figure 18: South America Data Acquisition Industry Volume Share (%), by Country 2024 & 2032
- Figure 19: North America Data Acquisition Industry Revenue (Million), by Country 2024 & 2032
- Figure 20: North America Data Acquisition Industry Volume (K Unit), by Country 2024 & 2032
- Figure 21: North America Data Acquisition Industry Revenue Share (%), by Country 2024 & 2032
- Figure 22: North America Data Acquisition Industry Volume Share (%), by Country 2024 & 2032
- Figure 23: MEA Data Acquisition Industry Revenue (Million), by Country 2024 & 2032
- Figure 24: MEA Data Acquisition Industry Volume (K Unit), by Country 2024 & 2032
- Figure 25: MEA Data Acquisition Industry Revenue Share (%), by Country 2024 & 2032
- Figure 26: MEA Data Acquisition Industry Volume Share (%), by Country 2024 & 2032
- Figure 27: North America Data Acquisition Industry Revenue (Million), by Channel 2024 & 2032
- Figure 28: North America Data Acquisition Industry Volume (K Unit), by Channel 2024 & 2032
- Figure 29: North America Data Acquisition Industry Revenue Share (%), by Channel 2024 & 2032
- Figure 30: North America Data Acquisition Industry Volume Share (%), by Channel 2024 & 2032
- Figure 31: North America Data Acquisition Industry Revenue (Million), by Type 2024 & 2032
- Figure 32: North America Data Acquisition Industry Volume (K Unit), by Type 2024 & 2032
- Figure 33: North America Data Acquisition Industry Revenue Share (%), by Type 2024 & 2032
- Figure 34: North America Data Acquisition Industry Volume Share (%), by Type 2024 & 2032
- Figure 35: North America Data Acquisition Industry Revenue (Million), by End-User Vertical 2024 & 2032
- Figure 36: North America Data Acquisition Industry Volume (K Unit), by End-User Vertical 2024 & 2032
- Figure 37: North America Data Acquisition Industry Revenue Share (%), by End-User Vertical 2024 & 2032
- Figure 38: North America Data Acquisition Industry Volume Share (%), by End-User Vertical 2024 & 2032
- Figure 39: North America Data Acquisition Industry Revenue (Million), by Country 2024 & 2032
- Figure 40: North America Data Acquisition Industry Volume (K Unit), by Country 2024 & 2032
- Figure 41: North America Data Acquisition Industry Revenue Share (%), by Country 2024 & 2032
- Figure 42: North America Data Acquisition Industry Volume Share (%), by Country 2024 & 2032
- Figure 43: Europe Data Acquisition Industry Revenue (Million), by Channel 2024 & 2032
- Figure 44: Europe Data Acquisition Industry Volume (K Unit), by Channel 2024 & 2032
- Figure 45: Europe Data Acquisition Industry Revenue Share (%), by Channel 2024 & 2032
- Figure 46: Europe Data Acquisition Industry Volume Share (%), by Channel 2024 & 2032
- Figure 47: Europe Data Acquisition Industry Revenue (Million), by Type 2024 & 2032
- Figure 48: Europe Data Acquisition Industry Volume (K Unit), by Type 2024 & 2032
- Figure 49: Europe Data Acquisition Industry Revenue Share (%), by Type 2024 & 2032
- Figure 50: Europe Data Acquisition Industry Volume Share (%), by Type 2024 & 2032
- Figure 51: Europe Data Acquisition Industry Revenue (Million), by End-User Vertical 2024 & 2032
- Figure 52: Europe Data Acquisition Industry Volume (K Unit), by End-User Vertical 2024 & 2032
- Figure 53: Europe Data Acquisition Industry Revenue Share (%), by End-User Vertical 2024 & 2032
- Figure 54: Europe Data Acquisition Industry Volume Share (%), by End-User Vertical 2024 & 2032
- Figure 55: Europe Data Acquisition Industry Revenue (Million), by Country 2024 & 2032
- Figure 56: Europe Data Acquisition Industry Volume (K Unit), by Country 2024 & 2032
- Figure 57: Europe Data Acquisition Industry Revenue Share (%), by Country 2024 & 2032
- Figure 58: Europe Data Acquisition Industry Volume Share (%), by Country 2024 & 2032
- Figure 59: Asia Pacific Data Acquisition Industry Revenue (Million), by Channel 2024 & 2032
- Figure 60: Asia Pacific Data Acquisition Industry Volume (K Unit), by Channel 2024 & 2032
- Figure 61: Asia Pacific Data Acquisition Industry Revenue Share (%), by Channel 2024 & 2032
- Figure 62: Asia Pacific Data Acquisition Industry Volume Share (%), by Channel 2024 & 2032
- Figure 63: Asia Pacific Data Acquisition Industry Revenue (Million), by Type 2024 & 2032
- Figure 64: Asia Pacific Data Acquisition Industry Volume (K Unit), by Type 2024 & 2032
- Figure 65: Asia Pacific Data Acquisition Industry Revenue Share (%), by Type 2024 & 2032
- Figure 66: Asia Pacific Data Acquisition Industry Volume Share (%), by Type 2024 & 2032
- Figure 67: Asia Pacific Data Acquisition Industry Revenue (Million), by End-User Vertical 2024 & 2032
- Figure 68: Asia Pacific Data Acquisition Industry Volume (K Unit), by End-User Vertical 2024 & 2032
- Figure 69: Asia Pacific Data Acquisition Industry Revenue Share (%), by End-User Vertical 2024 & 2032
- Figure 70: Asia Pacific Data Acquisition Industry Volume Share (%), by End-User Vertical 2024 & 2032
- Figure 71: Asia Pacific Data Acquisition Industry Revenue (Million), by Country 2024 & 2032
- Figure 72: Asia Pacific Data Acquisition Industry Volume (K Unit), by Country 2024 & 2032
- Figure 73: Asia Pacific Data Acquisition Industry Revenue Share (%), by Country 2024 & 2032
- Figure 74: Asia Pacific Data Acquisition Industry Volume Share (%), by Country 2024 & 2032
- Figure 75: Rest of the World Data Acquisition Industry Revenue (Million), by Channel 2024 & 2032
- Figure 76: Rest of the World Data Acquisition Industry Volume (K Unit), by Channel 2024 & 2032
- Figure 77: Rest of the World Data Acquisition Industry Revenue Share (%), by Channel 2024 & 2032
- Figure 78: Rest of the World Data Acquisition Industry Volume Share (%), by Channel 2024 & 2032
- Figure 79: Rest of the World Data Acquisition Industry Revenue (Million), by Type 2024 & 2032
- Figure 80: Rest of the World Data Acquisition Industry Volume (K Unit), by Type 2024 & 2032
- Figure 81: Rest of the World Data Acquisition Industry Revenue Share (%), by Type 2024 & 2032
- Figure 82: Rest of the World Data Acquisition Industry Volume Share (%), by Type 2024 & 2032
- Figure 83: Rest of the World Data Acquisition Industry Revenue (Million), by End-User Vertical 2024 & 2032
- Figure 84: Rest of the World Data Acquisition Industry Volume (K Unit), by End-User Vertical 2024 & 2032
- Figure 85: Rest of the World Data Acquisition Industry Revenue Share (%), by End-User Vertical 2024 & 2032
- Figure 86: Rest of the World Data Acquisition Industry Volume Share (%), by End-User Vertical 2024 & 2032
- Figure 87: Rest of the World Data Acquisition Industry Revenue (Million), by Country 2024 & 2032
- Figure 88: Rest of the World Data Acquisition Industry Volume (K Unit), by Country 2024 & 2032
- Figure 89: Rest of the World Data Acquisition Industry Revenue Share (%), by Country 2024 & 2032
- Figure 90: Rest of the World Data Acquisition Industry Volume Share (%), by Country 2024 & 2032
List of Tables
- Table 1: Global Data Acquisition Industry Revenue Million Forecast, by Region 2019 & 2032
- Table 2: Global Data Acquisition Industry Volume K Unit Forecast, by Region 2019 & 2032
- Table 3: Global Data Acquisition Industry Revenue Million Forecast, by Channel 2019 & 2032
- Table 4: Global Data Acquisition Industry Volume K Unit Forecast, by Channel 2019 & 2032
- Table 5: Global Data Acquisition Industry Revenue Million Forecast, by Type 2019 & 2032
- Table 6: Global Data Acquisition Industry Volume K Unit Forecast, by Type 2019 & 2032
- Table 7: Global Data Acquisition Industry Revenue Million Forecast, by End-User Vertical 2019 & 2032
- Table 8: Global Data Acquisition Industry Volume K Unit Forecast, by End-User Vertical 2019 & 2032
- Table 9: Global Data Acquisition Industry Revenue Million Forecast, by Region 2019 & 2032
- Table 10: Global Data Acquisition Industry Volume K Unit Forecast, by Region 2019 & 2032
- Table 11: Global Data Acquisition Industry Revenue Million Forecast, by Country 2019 & 2032
- Table 12: Global Data Acquisition Industry Volume K Unit Forecast, by Country 2019 & 2032
- Table 13: United States Data Acquisition Industry Revenue (Million) Forecast, by Application 2019 & 2032
- Table 14: United States Data Acquisition Industry Volume (K Unit) Forecast, by Application 2019 & 2032
- Table 15: Canada Data Acquisition Industry Revenue (Million) Forecast, by Application 2019 & 2032
- Table 16: Canada Data Acquisition Industry Volume (K Unit) Forecast, by Application 2019 & 2032
- Table 17: Mexico Data Acquisition Industry Revenue (Million) Forecast, by Application 2019 & 2032
- Table 18: Mexico Data Acquisition Industry Volume (K Unit) Forecast, by Application 2019 & 2032
- Table 19: Global Data Acquisition Industry Revenue Million Forecast, by Country 2019 & 2032
- Table 20: Global Data Acquisition Industry Volume K Unit Forecast, by Country 2019 & 2032
- Table 21: Germany Data Acquisition Industry Revenue (Million) Forecast, by Application 2019 & 2032
- Table 22: Germany Data Acquisition Industry Volume (K Unit) Forecast, by Application 2019 & 2032
- Table 23: United Kingdom Data Acquisition Industry Revenue (Million) Forecast, by Application 2019 & 2032
- Table 24: United Kingdom Data Acquisition Industry Volume (K Unit) Forecast, by Application 2019 & 2032
- Table 25: France Data Acquisition Industry Revenue (Million) Forecast, by Application 2019 & 2032
- Table 26: France Data Acquisition Industry Volume (K Unit) Forecast, by Application 2019 & 2032
- Table 27: Spain Data Acquisition Industry Revenue (Million) Forecast, by Application 2019 & 2032
- Table 28: Spain Data Acquisition Industry Volume (K Unit) Forecast, by Application 2019 & 2032
- Table 29: Italy Data Acquisition Industry Revenue (Million) Forecast, by Application 2019 & 2032
- Table 30: Italy Data Acquisition Industry Volume (K Unit) Forecast, by Application 2019 & 2032
- Table 31: Spain Data Acquisition Industry Revenue (Million) Forecast, by Application 2019 & 2032
- Table 32: Spain Data Acquisition Industry Volume (K Unit) Forecast, by Application 2019 & 2032
- Table 33: Belgium Data Acquisition Industry Revenue (Million) Forecast, by Application 2019 & 2032
- Table 34: Belgium Data Acquisition Industry Volume (K Unit) Forecast, by Application 2019 & 2032
- Table 35: Netherland Data Acquisition Industry Revenue (Million) Forecast, by Application 2019 & 2032
- Table 36: Netherland Data Acquisition Industry Volume (K Unit) Forecast, by Application 2019 & 2032
- Table 37: Nordics Data Acquisition Industry Revenue (Million) Forecast, by Application 2019 & 2032
- Table 38: Nordics Data Acquisition Industry Volume (K Unit) Forecast, by Application 2019 & 2032
- Table 39: Rest of Europe Data Acquisition Industry Revenue (Million) Forecast, by Application 2019 & 2032
- Table 40: Rest of Europe Data Acquisition Industry Volume (K Unit) Forecast, by Application 2019 & 2032
- Table 41: Global Data Acquisition Industry Revenue Million Forecast, by Country 2019 & 2032
- Table 42: Global Data Acquisition Industry Volume K Unit Forecast, by Country 2019 & 2032
- Table 43: China Data Acquisition Industry Revenue (Million) Forecast, by Application 2019 & 2032
- Table 44: China Data Acquisition Industry Volume (K Unit) Forecast, by Application 2019 & 2032
- Table 45: Japan Data Acquisition Industry Revenue (Million) Forecast, by Application 2019 & 2032
- Table 46: Japan Data Acquisition Industry Volume (K Unit) Forecast, by Application 2019 & 2032
- Table 47: India Data Acquisition Industry Revenue (Million) Forecast, by Application 2019 & 2032
- Table 48: India Data Acquisition Industry Volume (K Unit) Forecast, by Application 2019 & 2032
- Table 49: South Korea Data Acquisition Industry Revenue (Million) Forecast, by Application 2019 & 2032
- Table 50: South Korea Data Acquisition Industry Volume (K Unit) Forecast, by Application 2019 & 2032
- Table 51: Southeast Asia Data Acquisition Industry Revenue (Million) Forecast, by Application 2019 & 2032
- Table 52: Southeast Asia Data Acquisition Industry Volume (K Unit) Forecast, by Application 2019 & 2032
- Table 53: Australia Data Acquisition Industry Revenue (Million) Forecast, by Application 2019 & 2032
- Table 54: Australia Data Acquisition Industry Volume (K Unit) Forecast, by Application 2019 & 2032
- Table 55: Indonesia Data Acquisition Industry Revenue (Million) Forecast, by Application 2019 & 2032
- Table 56: Indonesia Data Acquisition Industry Volume (K Unit) Forecast, by Application 2019 & 2032
- Table 57: Phillipes Data Acquisition Industry Revenue (Million) Forecast, by Application 2019 & 2032
- Table 58: Phillipes Data Acquisition Industry Volume (K Unit) Forecast, by Application 2019 & 2032
- Table 59: Singapore Data Acquisition Industry Revenue (Million) Forecast, by Application 2019 & 2032
- Table 60: Singapore Data Acquisition Industry Volume (K Unit) Forecast, by Application 2019 & 2032
- Table 61: Thailandc Data Acquisition Industry Revenue (Million) Forecast, by Application 2019 & 2032
- Table 62: Thailandc Data Acquisition Industry Volume (K Unit) Forecast, by Application 2019 & 2032
- Table 63: Rest of Asia Pacific Data Acquisition Industry Revenue (Million) Forecast, by Application 2019 & 2032
- Table 64: Rest of Asia Pacific Data Acquisition Industry Volume (K Unit) Forecast, by Application 2019 & 2032
- Table 65: Global Data Acquisition Industry Revenue Million Forecast, by Country 2019 & 2032
- Table 66: Global Data Acquisition Industry Volume K Unit Forecast, by Country 2019 & 2032
- Table 67: Brazil Data Acquisition Industry Revenue (Million) Forecast, by Application 2019 & 2032
- Table 68: Brazil Data Acquisition Industry Volume (K Unit) Forecast, by Application 2019 & 2032
- Table 69: Argentina Data Acquisition Industry Revenue (Million) Forecast, by Application 2019 & 2032
- Table 70: Argentina Data Acquisition Industry Volume (K Unit) Forecast, by Application 2019 & 2032
- Table 71: Peru Data Acquisition Industry Revenue (Million) Forecast, by Application 2019 & 2032
- Table 72: Peru Data Acquisition Industry Volume (K Unit) Forecast, by Application 2019 & 2032
- Table 73: Chile Data Acquisition Industry Revenue (Million) Forecast, by Application 2019 & 2032
- Table 74: Chile Data Acquisition Industry Volume (K Unit) Forecast, by Application 2019 & 2032
- Table 75: Colombia Data Acquisition Industry Revenue (Million) Forecast, by Application 2019 & 2032
- Table 76: Colombia Data Acquisition Industry Volume (K Unit) Forecast, by Application 2019 & 2032
- Table 77: Ecuador Data Acquisition Industry Revenue (Million) Forecast, by Application 2019 & 2032
- Table 78: Ecuador Data Acquisition Industry Volume (K Unit) Forecast, by Application 2019 & 2032
- Table 79: Venezuela Data Acquisition Industry Revenue (Million) Forecast, by Application 2019 & 2032
- Table 80: Venezuela Data Acquisition Industry Volume (K Unit) Forecast, by Application 2019 & 2032
- Table 81: Rest of South America Data Acquisition Industry Revenue (Million) Forecast, by Application 2019 & 2032
- Table 82: Rest of South America Data Acquisition Industry Volume (K Unit) Forecast, by Application 2019 & 2032
- Table 83: Global Data Acquisition Industry Revenue Million Forecast, by Country 2019 & 2032
- Table 84: Global Data Acquisition Industry Volume K Unit Forecast, by Country 2019 & 2032
- Table 85: United States Data Acquisition Industry Revenue (Million) Forecast, by Application 2019 & 2032
- Table 86: United States Data Acquisition Industry Volume (K Unit) Forecast, by Application 2019 & 2032
- Table 87: Canada Data Acquisition Industry Revenue (Million) Forecast, by Application 2019 & 2032
- Table 88: Canada Data Acquisition Industry Volume (K Unit) Forecast, by Application 2019 & 2032
- Table 89: Mexico Data Acquisition Industry Revenue (Million) Forecast, by Application 2019 & 2032
- Table 90: Mexico Data Acquisition Industry Volume (K Unit) Forecast, by Application 2019 & 2032
- Table 91: Global Data Acquisition Industry Revenue Million Forecast, by Country 2019 & 2032
- Table 92: Global Data Acquisition Industry Volume K Unit Forecast, by Country 2019 & 2032
- Table 93: United Arab Emirates Data Acquisition Industry Revenue (Million) Forecast, by Application 2019 & 2032
- Table 94: United Arab Emirates Data Acquisition Industry Volume (K Unit) Forecast, by Application 2019 & 2032
- Table 95: Saudi Arabia Data Acquisition Industry Revenue (Million) Forecast, by Application 2019 & 2032
- Table 96: Saudi Arabia Data Acquisition Industry Volume (K Unit) Forecast, by Application 2019 & 2032
- Table 97: South Africa Data Acquisition Industry Revenue (Million) Forecast, by Application 2019 & 2032
- Table 98: South Africa Data Acquisition Industry Volume (K Unit) Forecast, by Application 2019 & 2032
- Table 99: Rest of Middle East and Africa Data Acquisition Industry Revenue (Million) Forecast, by Application 2019 & 2032
- Table 100: Rest of Middle East and Africa Data Acquisition Industry Volume (K Unit) Forecast, by Application 2019 & 2032
- Table 101: Global Data Acquisition Industry Revenue Million Forecast, by Channel 2019 & 2032
- Table 102: Global Data Acquisition Industry Volume K Unit Forecast, by Channel 2019 & 2032
- Table 103: Global Data Acquisition Industry Revenue Million Forecast, by Type 2019 & 2032
- Table 104: Global Data Acquisition Industry Volume K Unit Forecast, by Type 2019 & 2032
- Table 105: Global Data Acquisition Industry Revenue Million Forecast, by End-User Vertical 2019 & 2032
- Table 106: Global Data Acquisition Industry Volume K Unit Forecast, by End-User Vertical 2019 & 2032
- Table 107: Global Data Acquisition Industry Revenue Million Forecast, by Country 2019 & 2032
- Table 108: Global Data Acquisition Industry Volume K Unit Forecast, by Country 2019 & 2032
- Table 109: Global Data Acquisition Industry Revenue Million Forecast, by Channel 2019 & 2032
- Table 110: Global Data Acquisition Industry Volume K Unit Forecast, by Channel 2019 & 2032
- Table 111: Global Data Acquisition Industry Revenue Million Forecast, by Type 2019 & 2032
- Table 112: Global Data Acquisition Industry Volume K Unit Forecast, by Type 2019 & 2032
- Table 113: Global Data Acquisition Industry Revenue Million Forecast, by End-User Vertical 2019 & 2032
- Table 114: Global Data Acquisition Industry Volume K Unit Forecast, by End-User Vertical 2019 & 2032
- Table 115: Global Data Acquisition Industry Revenue Million Forecast, by Country 2019 & 2032
- Table 116: Global Data Acquisition Industry Volume K Unit Forecast, by Country 2019 & 2032
- Table 117: Global Data Acquisition Industry Revenue Million Forecast, by Channel 2019 & 2032
- Table 118: Global Data Acquisition Industry Volume K Unit Forecast, by Channel 2019 & 2032
- Table 119: Global Data Acquisition Industry Revenue Million Forecast, by Type 2019 & 2032
- Table 120: Global Data Acquisition Industry Volume K Unit Forecast, by Type 2019 & 2032
- Table 121: Global Data Acquisition Industry Revenue Million Forecast, by End-User Vertical 2019 & 2032
- Table 122: Global Data Acquisition Industry Volume K Unit Forecast, by End-User Vertical 2019 & 2032
- Table 123: Global Data Acquisition Industry Revenue Million Forecast, by Country 2019 & 2032
- Table 124: Global Data Acquisition Industry Volume K Unit Forecast, by Country 2019 & 2032
- Table 125: Global Data Acquisition Industry Revenue Million Forecast, by Channel 2019 & 2032
- Table 126: Global Data Acquisition Industry Volume K Unit Forecast, by Channel 2019 & 2032
- Table 127: Global Data Acquisition Industry Revenue Million Forecast, by Type 2019 & 2032
- Table 128: Global Data Acquisition Industry Volume K Unit Forecast, by Type 2019 & 2032
- Table 129: Global Data Acquisition Industry Revenue Million Forecast, by End-User Vertical 2019 & 2032
- Table 130: Global Data Acquisition Industry Volume K Unit Forecast, by End-User Vertical 2019 & 2032
- Table 131: Global Data Acquisition Industry Revenue Million Forecast, by Country 2019 & 2032
- Table 132: Global Data Acquisition Industry Volume K Unit Forecast, by Country 2019 & 2032
Frequently Asked Questions
1. What is the projected Compound Annual Growth Rate (CAGR) of the Data Acquisition Industry?
The projected CAGR is approximately 7.10%.
2. Which companies are prominent players in the Data Acquisition Industry?
Key companies in the market include Imc Dataworks LLC, DATAQ Instruments, ABB Ltd, Spectris PLC (HBM and Bruel & Kjaer and Omega), DAQ Systems Co Limited, Keysight Technologies, National Instruments Corporation, Yokogawa Electric Co, Emerson Electric Co, Siemens AG, Schneider Electric SE, Omron Corporation, General Electric Ltd, Honeywell International, Beijing GEMOTECH Intelligent Technology, ADLINK Technology Inc, Advantech Co Ltd, Rockwell Automation Inc, Curtiss-Wright Corporation, Tektronix, Bustec, AMETEK (VTI Instruments).
3. What are the main segments of the Data Acquisition Industry?
The market segments include Channel, Type, End-User Vertical.
4. Can you provide details about the market size?
The market size is estimated to be USD 2.41 Million as of 2022.
5. What are some drivers contributing to market growth?
Growing Adoption of Industrial Ethernet Solutions; Increasing Complexity in Manufacturing Establishments is Driving Operators Towards Adoption of DAQ for Design Validation and Testing; Technological Advancements Such as Edge Computing and TSN.
6. What are the notable trends driving market growth?
Aerospace and Defense Accounts for Significant Share in the Market.
7. Are there any restraints impacting market growth?
Cost Implications and Saturation in Key Markets Could Hinder Growth Over the Forecast Period.
8. Can you provide examples of recent developments in the market?
June 2022 - Advantech announced the launch of a new series of data acquisition modules - iDAQ series. The iDAQ series is a new series of modular DAQ modules and chassis, including the iDAQ-900 series chassis and iDAQ-700 and 800 series DAQ modules.
9. What pricing options are available for accessing the report?
Pricing options include single-user, multi-user, and enterprise licenses priced at USD 4750, USD 5250, and USD 8750 respectively.
10. Is the market size provided in terms of value or volume?
The market size is provided in terms of value, measured in Million and volume, measured in K Unit.
11. Are there any specific market keywords associated with the report?
Yes, the market keyword associated with the report is "Data Acquisition Industry," which aids in identifying and referencing the specific market segment covered.
12. How do I determine which pricing option suits my needs best?
The pricing options vary based on user requirements and access needs. Individual users may opt for single-user licenses, while businesses requiring broader access may choose multi-user or enterprise licenses for cost-effective access to the report.
13. Are there any additional resources or data provided in the Data Acquisition Industry report?
While the report offers comprehensive insights, it's advisable to review the specific contents or supplementary materials provided to ascertain if additional resources or data are available.
14. How can I stay updated on further developments or reports in the Data Acquisition Industry?
To stay informed about further developments, trends, and reports in the Data Acquisition Industry, consider subscribing to industry newsletters, following relevant companies and organizations, or regularly checking reputable industry news sources and publications.
Methodology
Step 1 - Identification of Relevant Samples Size from Population Database


Step 2 - Approaches for Defining Global Market Size (Value, Volume* & Price*)

Note*: In applicable scenarios
Step 3 - Data Sources
Primary Research
- Web Analytics
- Survey Reports
- Research Institute
- Latest Research Reports
- Opinion Leaders
Secondary Research
- Annual Reports
- White Paper
- Latest Press Release
- Industry Association
- Paid Database
- Investor Presentations

Step 4 - Data Triangulation
Involves using different sources of information in order to increase the validity of a study
These sources are likely to be stakeholders in a program - participants, other researchers, program staff, other community members, and so on.
Then we put all data in single framework & apply various statistical tools to find out the dynamic on the market.
During the analysis stage, feedback from the stakeholder groups would be compared to determine areas of agreement as well as areas of divergence
