

Key Insights
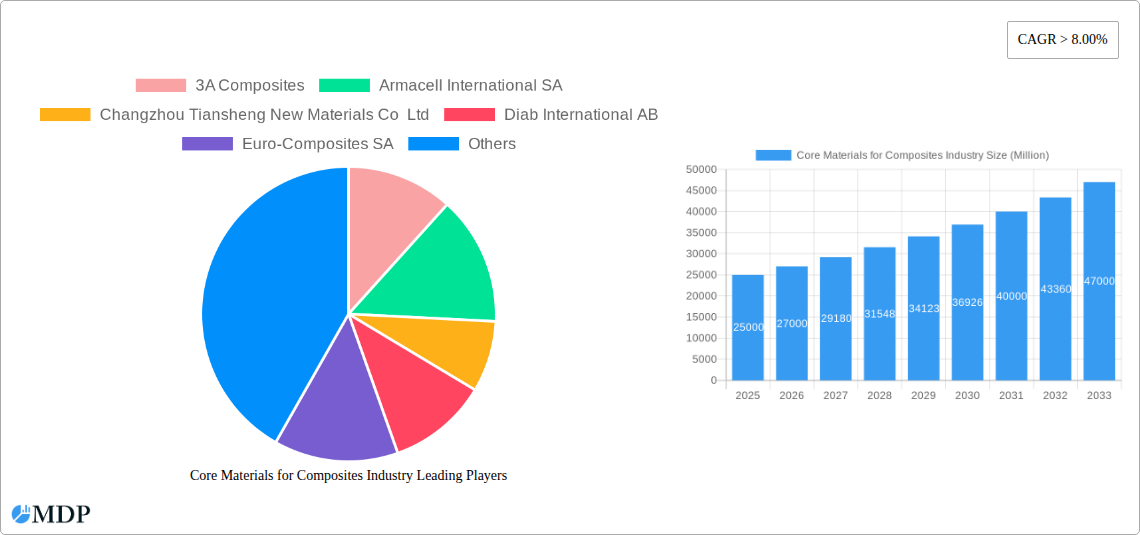
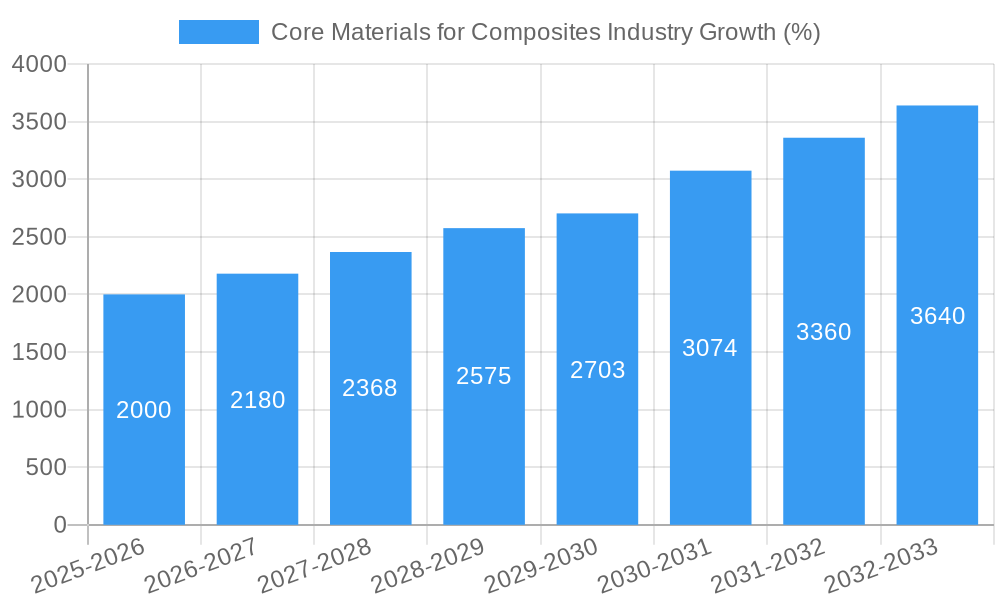
The core materials for composites market is experiencing robust growth, driven by increasing demand across diverse sectors like aerospace, automotive, wind energy, and construction. A compound annual growth rate (CAGR) exceeding 8% from 2019 to 2033 indicates a significant expansion, fueled by the inherent advantages of composite materials – namely, their high strength-to-weight ratio, durability, and design flexibility. The market's expansion is further propelled by ongoing advancements in material science, leading to the development of lighter, stronger, and more cost-effective composite materials. This innovation is particularly impactful in the aerospace and automotive industries, where weight reduction directly translates to fuel efficiency and improved performance. Growing investments in renewable energy infrastructure, particularly wind turbines, are also creating substantial demand for composite materials, given their suitability for large-scale structures. While challenges exist, such as the relatively high cost of some composite materials and concerns about their recyclability, ongoing research and development efforts are actively addressing these limitations, paving the way for wider adoption across various applications.
The market is segmented by material type (e.g., fiber-reinforced polymers, carbon fiber, glass fiber, aramid fiber), application (aerospace, automotive, wind energy, construction, marine), and region (North America, Europe, Asia-Pacific, etc.). Major players like 3A Composites, Armacell, and Hexcel are actively shaping the market landscape through strategic partnerships, acquisitions, and continuous product innovation. Competition is intense, emphasizing the need for companies to differentiate themselves through technological advancements, cost optimization, and a strong focus on sustainable practices. The forecast period of 2025-2033 shows significant potential for growth, with the market expected to surpass previous growth levels due to a combination of factors including sustained economic growth in key regions and increased adoption of composite materials in emerging applications. The market’s trajectory indicates a promising future for companies involved in the production and supply of core materials for composites.
Core Materials for Composites Industry: A Comprehensive Market Report (2019-2033)
This in-depth report provides a comprehensive analysis of the Core Materials for Composites Industry, offering valuable insights for stakeholders, investors, and industry professionals. With a study period spanning 2019-2033, a base year of 2025, and a forecast period of 2025-2033, this report leverages rigorous data analysis to illuminate market dynamics, trends, and future opportunities. The market size is projected to reach xx Million by 2033, exhibiting a significant CAGR. This report covers key players including 3A Composites, Armacell International SA, Changzhou Tiansheng New Materials Co Ltd, Diab International AB, Euro-Composites SA, Evonik Industries AG, Gurit Holding AG, Hexcel Corporation, Plascore Incorporated, Saertex GmbH & Co KG, and The Gill Corporation, among others.
Core Materials for Composites Industry Market Dynamics & Concentration
The Core Materials for Composites Industry is characterized by a moderately concentrated market structure, with several key players holding significant market share. Market concentration is influenced by factors such as economies of scale, technological advancements, and intense competition. Innovation plays a crucial role, driving the development of high-performance materials with enhanced properties like strength-to-weight ratio and durability. Regulatory frameworks, particularly concerning environmental regulations and safety standards, significantly impact material choices and manufacturing processes. The emergence of bio-based and recycled materials is presenting viable substitutes, challenging the dominance of traditional materials. End-user trends, especially in the aerospace, automotive, and wind energy sectors, influence demand for specific composite materials with tailored properties. M&A activities have been relatively frequent, with xx major deals recorded between 2019 and 2024, primarily driven by strategic acquisitions aimed at expanding market reach and technological capabilities.
- Market Share: Top 5 players hold approximately xx% of the market share in 2025.
- M&A Activity: An average of xx M&A deals per year were recorded during the historical period (2019-2024).
- Innovation Drivers: Focus on lightweighting, improved durability, and sustainability is driving innovation.
- Regulatory Impact: Stringent environmental regulations influence material selection and manufacturing processes.
Core Materials for Composites Industry Industry Trends & Analysis
The Core Materials for Composites Industry is experiencing robust growth, driven by several key factors. The increasing demand for lightweight yet high-strength materials across various industries, such as aerospace, automotive, and construction, is a significant driver. Technological advancements, including the development of advanced fiber reinforcement and resin systems, are leading to the creation of composites with superior properties. Consumer preferences for fuel-efficient vehicles and sustainable products are further propelling market expansion. Intense competition among manufacturers necessitates continuous innovation and cost optimization strategies. The market is witnessing increased adoption of automation and digital technologies across the value chain. The industry CAGR for the forecast period is projected to be xx%, with a market penetration rate of xx% in key segments by 2033.
Leading Markets & Segments in Core Materials for Composites Industry
The Asia-Pacific region is expected to maintain its dominance in the Core Materials for Composites Industry throughout the forecast period. China, in particular, is a key growth driver due to substantial infrastructure development and a burgeoning automotive sector. The strong economic growth and favorable government policies in the region are contributing factors. Within the segments, fiber-reinforced polymers (FRP) represent a significant share of the market, driven by their versatility and high-performance characteristics.
Key Drivers for Asia-Pacific Dominance:
- Rapid infrastructure development
- Strong economic growth
- Favorable government policies supporting manufacturing
- Growing automotive and wind energy sectors
Dominance Analysis: The Asia-Pacific region accounts for approximately xx% of the global market share, a figure projected to increase to xx% by 2033. The dominance is attributed to a combination of factors, including substantial investments in infrastructure projects, a large and growing automotive industry, and supportive government initiatives promoting the adoption of composite materials.
Core Materials for Composites Industry Product Developments
Recent product innovations focus on enhancing material properties such as strength, stiffness, and durability while simultaneously reducing weight and cost. New resin systems offer improved thermal and chemical resistance, expanding the range of applications for composite materials. Nanotechnology is being increasingly applied to enhance material performance. These innovations are driving the adoption of composite materials in new and diverse applications, including advanced aerospace structures, high-performance vehicles, and renewable energy infrastructure. Competitive advantages are gained through superior material properties, cost-effective manufacturing processes, and strong intellectual property portfolios.
Key Drivers of Core Materials for Composites Industry Growth
Several factors are driving the growth of the Core Materials for Composites Industry. Technological advancements in material science are leading to the development of lighter, stronger, and more durable composites. The increasing demand for fuel efficiency in the automotive and aerospace industries is a significant driver. Favorable government regulations and incentives promoting the adoption of sustainable materials also contribute to market growth. Furthermore, the expanding construction and wind energy sectors are creating significant opportunities for the industry.
Challenges in the Core Materials for Composites Industry Market
The Core Materials for Composites Industry faces several challenges. Fluctuating raw material prices, especially for reinforcing fibers, pose a significant threat to profitability. Stringent environmental regulations and the increasing demand for sustainable materials necessitate investments in eco-friendly manufacturing processes. Supply chain disruptions and geopolitical uncertainties can also impact production and availability. Furthermore, intense competition among manufacturers necessitates continuous innovation and cost optimization strategies to maintain market share. The projected negative impact of these challenges on market growth is estimated at approximately xx Million by 2033.
Emerging Opportunities in Core Materials for Composites Industry
The Core Materials for Composites Industry presents numerous emerging opportunities. Technological breakthroughs in material science, including the development of bio-based and recycled composites, are creating new growth avenues. Strategic partnerships and collaborations among industry players are driving innovation and expanding market reach. Expansion into emerging markets, particularly in developing economies, offers significant untapped potential. The growing demand for lightweight and high-performance materials in various sectors will continue to fuel industry growth in the long term.
Leading Players in the Core Materials for Composites Industry Sector
- 3A Composites
- Armacell International SA
- Changzhou Tiansheng New Materials Co Ltd
- Diab International AB
- Euro-Composites SA
- Evonik Industries AG
- Gurit Holding AG
- Hexcel Corporation
- Plascore Incorporated
- Saertex GmbH & Co KG
- The Gill Corporation
Key Milestones in Core Materials for Composites Industry Industry
- 2020: Introduction of a new bio-based resin system by Evonik Industries AG.
- 2021: Merger between two major players in the carbon fiber market.
- 2022: Launch of a new high-strength, lightweight composite material by Hexcel Corporation.
- 2023: Significant investment in R&D for recycled composite materials by Gurit Holding AG.
- 2024: New regulations on the use of certain composite materials in the automotive industry implemented in Europe.
Strategic Outlook for Core Materials for Composites Industry Market
The future of the Core Materials for Composites Industry looks promising, with significant growth potential driven by technological advancements, increasing demand from diverse sectors, and supportive government policies. Strategic partnerships, focused R&D investments, and expansion into new markets will be crucial for success. The industry is expected to witness continued innovation in materials science, leading to even lighter, stronger, and more sustainable composite materials. Companies that effectively adapt to changing consumer preferences and technological advancements are likely to experience significant growth in the coming years.
Core Materials for Composites Industry Segmentation
-
1. Type
-
1.1. Foam Core
- 1.1.1. PVC Foam
- 1.1.2. Polystyrene Foam
- 1.1.3. Polyurethane Foam
- 1.1.4. PMMA Foam
- 1.1.5. SAN Co-polymer Foam
- 1.1.6. Other Thermoplastics
-
1.2. Honeycomb
- 1.2.1. Aluminum Honeycomb
- 1.2.2. Nomex Honeycomb
- 1.2.3. Thermoplastic Honeycomb
-
1.3. Wood
- 1.3.1. Balsa
- 1.3.2. Other Woods
-
1.1. Foam Core
-
2. End-user Industry
- 2.1. Aerospace and Defense
- 2.2. Marine
- 2.3. Construction
- 2.4. Wind Energy
- 2.5. Automotive
- 2.6. Consumer Goods
- 2.7. Other End-user Industries
Core Materials for Composites Industry Segmentation By Geography
-
1. Asia Pacific
- 1.1. China
- 1.2. India
- 1.3. Japan
- 1.4. South Korea
- 1.5. ASEAN Countries
- 1.6. Rest of Asia Pacific
-
2. North America
- 2.1. United States
- 2.2. Canada
- 2.3. Mexico
-
3. Europe
- 3.1. Germany
- 3.2. United Kingdom
- 3.3. Italy
- 3.4. France
- 3.5. Spain
- 3.6. Rest of Europe
-
4. South America
- 4.1. Brazil
- 4.2. Argentina
- 4.3. Rest of South America
- 5. Middle East
-
6. Saudi Arabia
- 6.1. South Africa
- 6.2. Rest of Middle East

Core Materials for Composites Industry REPORT HIGHLIGHTS
| Aspects | Details |
|---|---|
| Study Period | 2019-2033 |
| Base Year | 2024 |
| Estimated Year | 2025 |
| Forecast Period | 2025-2033 |
| Historical Period | 2019-2024 |
| Growth Rate | CAGR of > 8.00% from 2019-2033 |
| Segmentation |
|
Table of Contents
- 1. Introduction
- 1.1. Research Scope
- 1.2. Market Segmentation
- 1.3. Research Methodology
- 1.4. Definitions and Assumptions
- 2. Executive Summary
- 2.1. Introduction
- 3. Market Dynamics
- 3.1. Introduction
- 3.2. Market Drivers
- 3.2.1. ; Increasing Demand from the Wind Energy Domain; Increasing Use of Composites in the Aerospace Industry; Emerging Applications in the Automotive Market
- 3.3. Market Restrains
- 3.3.1. ; Increasing Demand from the Wind Energy Domain; Increasing Use of Composites in the Aerospace Industry; Emerging Applications in the Automotive Market
- 3.4. Market Trends
- 3.4.1. Growing Usage in Aerospace and Defense Sector
- 4. Market Factor Analysis
- 4.1. Porters Five Forces
- 4.2. Supply/Value Chain
- 4.3. PESTEL analysis
- 4.4. Market Entropy
- 4.5. Patent/Trademark Analysis
- 5. Global Core Materials for Composites Industry Analysis, Insights and Forecast, 2019-2031
- 5.1. Market Analysis, Insights and Forecast - by Type
- 5.1.1. Foam Core
- 5.1.1.1. PVC Foam
- 5.1.1.2. Polystyrene Foam
- 5.1.1.3. Polyurethane Foam
- 5.1.1.4. PMMA Foam
- 5.1.1.5. SAN Co-polymer Foam
- 5.1.1.6. Other Thermoplastics
- 5.1.2. Honeycomb
- 5.1.2.1. Aluminum Honeycomb
- 5.1.2.2. Nomex Honeycomb
- 5.1.2.3. Thermoplastic Honeycomb
- 5.1.3. Wood
- 5.1.3.1. Balsa
- 5.1.3.2. Other Woods
- 5.1.1. Foam Core
- 5.2. Market Analysis, Insights and Forecast - by End-user Industry
- 5.2.1. Aerospace and Defense
- 5.2.2. Marine
- 5.2.3. Construction
- 5.2.4. Wind Energy
- 5.2.5. Automotive
- 5.2.6. Consumer Goods
- 5.2.7. Other End-user Industries
- 5.3. Market Analysis, Insights and Forecast - by Region
- 5.3.1. Asia Pacific
- 5.3.2. North America
- 5.3.3. Europe
- 5.3.4. South America
- 5.3.5. Middle East
- 5.3.6. Saudi Arabia
- 5.1. Market Analysis, Insights and Forecast - by Type
- 6. Asia Pacific Core Materials for Composites Industry Analysis, Insights and Forecast, 2019-2031
- 6.1. Market Analysis, Insights and Forecast - by Type
- 6.1.1. Foam Core
- 6.1.1.1. PVC Foam
- 6.1.1.2. Polystyrene Foam
- 6.1.1.3. Polyurethane Foam
- 6.1.1.4. PMMA Foam
- 6.1.1.5. SAN Co-polymer Foam
- 6.1.1.6. Other Thermoplastics
- 6.1.2. Honeycomb
- 6.1.2.1. Aluminum Honeycomb
- 6.1.2.2. Nomex Honeycomb
- 6.1.2.3. Thermoplastic Honeycomb
- 6.1.3. Wood
- 6.1.3.1. Balsa
- 6.1.3.2. Other Woods
- 6.1.1. Foam Core
- 6.2. Market Analysis, Insights and Forecast - by End-user Industry
- 6.2.1. Aerospace and Defense
- 6.2.2. Marine
- 6.2.3. Construction
- 6.2.4. Wind Energy
- 6.2.5. Automotive
- 6.2.6. Consumer Goods
- 6.2.7. Other End-user Industries
- 6.1. Market Analysis, Insights and Forecast - by Type
- 7. North America Core Materials for Composites Industry Analysis, Insights and Forecast, 2019-2031
- 7.1. Market Analysis, Insights and Forecast - by Type
- 7.1.1. Foam Core
- 7.1.1.1. PVC Foam
- 7.1.1.2. Polystyrene Foam
- 7.1.1.3. Polyurethane Foam
- 7.1.1.4. PMMA Foam
- 7.1.1.5. SAN Co-polymer Foam
- 7.1.1.6. Other Thermoplastics
- 7.1.2. Honeycomb
- 7.1.2.1. Aluminum Honeycomb
- 7.1.2.2. Nomex Honeycomb
- 7.1.2.3. Thermoplastic Honeycomb
- 7.1.3. Wood
- 7.1.3.1. Balsa
- 7.1.3.2. Other Woods
- 7.1.1. Foam Core
- 7.2. Market Analysis, Insights and Forecast - by End-user Industry
- 7.2.1. Aerospace and Defense
- 7.2.2. Marine
- 7.2.3. Construction
- 7.2.4. Wind Energy
- 7.2.5. Automotive
- 7.2.6. Consumer Goods
- 7.2.7. Other End-user Industries
- 7.1. Market Analysis, Insights and Forecast - by Type
- 8. Europe Core Materials for Composites Industry Analysis, Insights and Forecast, 2019-2031
- 8.1. Market Analysis, Insights and Forecast - by Type
- 8.1.1. Foam Core
- 8.1.1.1. PVC Foam
- 8.1.1.2. Polystyrene Foam
- 8.1.1.3. Polyurethane Foam
- 8.1.1.4. PMMA Foam
- 8.1.1.5. SAN Co-polymer Foam
- 8.1.1.6. Other Thermoplastics
- 8.1.2. Honeycomb
- 8.1.2.1. Aluminum Honeycomb
- 8.1.2.2. Nomex Honeycomb
- 8.1.2.3. Thermoplastic Honeycomb
- 8.1.3. Wood
- 8.1.3.1. Balsa
- 8.1.3.2. Other Woods
- 8.1.1. Foam Core
- 8.2. Market Analysis, Insights and Forecast - by End-user Industry
- 8.2.1. Aerospace and Defense
- 8.2.2. Marine
- 8.2.3. Construction
- 8.2.4. Wind Energy
- 8.2.5. Automotive
- 8.2.6. Consumer Goods
- 8.2.7. Other End-user Industries
- 8.1. Market Analysis, Insights and Forecast - by Type
- 9. South America Core Materials for Composites Industry Analysis, Insights and Forecast, 2019-2031
- 9.1. Market Analysis, Insights and Forecast - by Type
- 9.1.1. Foam Core
- 9.1.1.1. PVC Foam
- 9.1.1.2. Polystyrene Foam
- 9.1.1.3. Polyurethane Foam
- 9.1.1.4. PMMA Foam
- 9.1.1.5. SAN Co-polymer Foam
- 9.1.1.6. Other Thermoplastics
- 9.1.2. Honeycomb
- 9.1.2.1. Aluminum Honeycomb
- 9.1.2.2. Nomex Honeycomb
- 9.1.2.3. Thermoplastic Honeycomb
- 9.1.3. Wood
- 9.1.3.1. Balsa
- 9.1.3.2. Other Woods
- 9.1.1. Foam Core
- 9.2. Market Analysis, Insights and Forecast - by End-user Industry
- 9.2.1. Aerospace and Defense
- 9.2.2. Marine
- 9.2.3. Construction
- 9.2.4. Wind Energy
- 9.2.5. Automotive
- 9.2.6. Consumer Goods
- 9.2.7. Other End-user Industries
- 9.1. Market Analysis, Insights and Forecast - by Type
- 10. Middle East Core Materials for Composites Industry Analysis, Insights and Forecast, 2019-2031
- 10.1. Market Analysis, Insights and Forecast - by Type
- 10.1.1. Foam Core
- 10.1.1.1. PVC Foam
- 10.1.1.2. Polystyrene Foam
- 10.1.1.3. Polyurethane Foam
- 10.1.1.4. PMMA Foam
- 10.1.1.5. SAN Co-polymer Foam
- 10.1.1.6. Other Thermoplastics
- 10.1.2. Honeycomb
- 10.1.2.1. Aluminum Honeycomb
- 10.1.2.2. Nomex Honeycomb
- 10.1.2.3. Thermoplastic Honeycomb
- 10.1.3. Wood
- 10.1.3.1. Balsa
- 10.1.3.2. Other Woods
- 10.1.1. Foam Core
- 10.2. Market Analysis, Insights and Forecast - by End-user Industry
- 10.2.1. Aerospace and Defense
- 10.2.2. Marine
- 10.2.3. Construction
- 10.2.4. Wind Energy
- 10.2.5. Automotive
- 10.2.6. Consumer Goods
- 10.2.7. Other End-user Industries
- 10.1. Market Analysis, Insights and Forecast - by Type
- 11. Saudi Arabia Core Materials for Composites Industry Analysis, Insights and Forecast, 2019-2031
- 11.1. Market Analysis, Insights and Forecast - by Type
- 11.1.1. Foam Core
- 11.1.1.1. PVC Foam
- 11.1.1.2. Polystyrene Foam
- 11.1.1.3. Polyurethane Foam
- 11.1.1.4. PMMA Foam
- 11.1.1.5. SAN Co-polymer Foam
- 11.1.1.6. Other Thermoplastics
- 11.1.2. Honeycomb
- 11.1.2.1. Aluminum Honeycomb
- 11.1.2.2. Nomex Honeycomb
- 11.1.2.3. Thermoplastic Honeycomb
- 11.1.3. Wood
- 11.1.3.1. Balsa
- 11.1.3.2. Other Woods
- 11.1.1. Foam Core
- 11.2. Market Analysis, Insights and Forecast - by End-user Industry
- 11.2.1. Aerospace and Defense
- 11.2.2. Marine
- 11.2.3. Construction
- 11.2.4. Wind Energy
- 11.2.5. Automotive
- 11.2.6. Consumer Goods
- 11.2.7. Other End-user Industries
- 11.1. Market Analysis, Insights and Forecast - by Type
- 12. Competitive Analysis
- 12.1. Global Market Share Analysis 2024
- 12.2. Company Profiles
- 12.2.1 3A Composites
- 12.2.1.1. Overview
- 12.2.1.2. Products
- 12.2.1.3. SWOT Analysis
- 12.2.1.4. Recent Developments
- 12.2.1.5. Financials (Based on Availability)
- 12.2.2 Armacell International SA
- 12.2.2.1. Overview
- 12.2.2.2. Products
- 12.2.2.3. SWOT Analysis
- 12.2.2.4. Recent Developments
- 12.2.2.5. Financials (Based on Availability)
- 12.2.3 Changzhou Tiansheng New Materials Co Ltd
- 12.2.3.1. Overview
- 12.2.3.2. Products
- 12.2.3.3. SWOT Analysis
- 12.2.3.4. Recent Developments
- 12.2.3.5. Financials (Based on Availability)
- 12.2.4 Diab International AB
- 12.2.4.1. Overview
- 12.2.4.2. Products
- 12.2.4.3. SWOT Analysis
- 12.2.4.4. Recent Developments
- 12.2.4.5. Financials (Based on Availability)
- 12.2.5 Euro-Composites SA
- 12.2.5.1. Overview
- 12.2.5.2. Products
- 12.2.5.3. SWOT Analysis
- 12.2.5.4. Recent Developments
- 12.2.5.5. Financials (Based on Availability)
- 12.2.6 Evonik Industries AG
- 12.2.6.1. Overview
- 12.2.6.2. Products
- 12.2.6.3. SWOT Analysis
- 12.2.6.4. Recent Developments
- 12.2.6.5. Financials (Based on Availability)
- 12.2.7 Gurit Holding AG
- 12.2.7.1. Overview
- 12.2.7.2. Products
- 12.2.7.3. SWOT Analysis
- 12.2.7.4. Recent Developments
- 12.2.7.5. Financials (Based on Availability)
- 12.2.8 Hexcel Corporation
- 12.2.8.1. Overview
- 12.2.8.2. Products
- 12.2.8.3. SWOT Analysis
- 12.2.8.4. Recent Developments
- 12.2.8.5. Financials (Based on Availability)
- 12.2.9 Plascore Incorporated
- 12.2.9.1. Overview
- 12.2.9.2. Products
- 12.2.9.3. SWOT Analysis
- 12.2.9.4. Recent Developments
- 12.2.9.5. Financials (Based on Availability)
- 12.2.10 Saertex GmbH & Co KG
- 12.2.10.1. Overview
- 12.2.10.2. Products
- 12.2.10.3. SWOT Analysis
- 12.2.10.4. Recent Developments
- 12.2.10.5. Financials (Based on Availability)
- 12.2.11 The Gill Corporation*List Not Exhaustive
- 12.2.11.1. Overview
- 12.2.11.2. Products
- 12.2.11.3. SWOT Analysis
- 12.2.11.4. Recent Developments
- 12.2.11.5. Financials (Based on Availability)
- 12.2.1 3A Composites
List of Figures
- Figure 1: Global Core Materials for Composites Industry Revenue Breakdown (Million, %) by Region 2024 & 2032
- Figure 2: Asia Pacific Core Materials for Composites Industry Revenue (Million), by Type 2024 & 2032
- Figure 3: Asia Pacific Core Materials for Composites Industry Revenue Share (%), by Type 2024 & 2032
- Figure 4: Asia Pacific Core Materials for Composites Industry Revenue (Million), by End-user Industry 2024 & 2032
- Figure 5: Asia Pacific Core Materials for Composites Industry Revenue Share (%), by End-user Industry 2024 & 2032
- Figure 6: Asia Pacific Core Materials for Composites Industry Revenue (Million), by Country 2024 & 2032
- Figure 7: Asia Pacific Core Materials for Composites Industry Revenue Share (%), by Country 2024 & 2032
- Figure 8: North America Core Materials for Composites Industry Revenue (Million), by Type 2024 & 2032
- Figure 9: North America Core Materials for Composites Industry Revenue Share (%), by Type 2024 & 2032
- Figure 10: North America Core Materials for Composites Industry Revenue (Million), by End-user Industry 2024 & 2032
- Figure 11: North America Core Materials for Composites Industry Revenue Share (%), by End-user Industry 2024 & 2032
- Figure 12: North America Core Materials for Composites Industry Revenue (Million), by Country 2024 & 2032
- Figure 13: North America Core Materials for Composites Industry Revenue Share (%), by Country 2024 & 2032
- Figure 14: Europe Core Materials for Composites Industry Revenue (Million), by Type 2024 & 2032
- Figure 15: Europe Core Materials for Composites Industry Revenue Share (%), by Type 2024 & 2032
- Figure 16: Europe Core Materials for Composites Industry Revenue (Million), by End-user Industry 2024 & 2032
- Figure 17: Europe Core Materials for Composites Industry Revenue Share (%), by End-user Industry 2024 & 2032
- Figure 18: Europe Core Materials for Composites Industry Revenue (Million), by Country 2024 & 2032
- Figure 19: Europe Core Materials for Composites Industry Revenue Share (%), by Country 2024 & 2032
- Figure 20: South America Core Materials for Composites Industry Revenue (Million), by Type 2024 & 2032
- Figure 21: South America Core Materials for Composites Industry Revenue Share (%), by Type 2024 & 2032
- Figure 22: South America Core Materials for Composites Industry Revenue (Million), by End-user Industry 2024 & 2032
- Figure 23: South America Core Materials for Composites Industry Revenue Share (%), by End-user Industry 2024 & 2032
- Figure 24: South America Core Materials for Composites Industry Revenue (Million), by Country 2024 & 2032
- Figure 25: South America Core Materials for Composites Industry Revenue Share (%), by Country 2024 & 2032
- Figure 26: Middle East Core Materials for Composites Industry Revenue (Million), by Type 2024 & 2032
- Figure 27: Middle East Core Materials for Composites Industry Revenue Share (%), by Type 2024 & 2032
- Figure 28: Middle East Core Materials for Composites Industry Revenue (Million), by End-user Industry 2024 & 2032
- Figure 29: Middle East Core Materials for Composites Industry Revenue Share (%), by End-user Industry 2024 & 2032
- Figure 30: Middle East Core Materials for Composites Industry Revenue (Million), by Country 2024 & 2032
- Figure 31: Middle East Core Materials for Composites Industry Revenue Share (%), by Country 2024 & 2032
- Figure 32: Saudi Arabia Core Materials for Composites Industry Revenue (Million), by Type 2024 & 2032
- Figure 33: Saudi Arabia Core Materials for Composites Industry Revenue Share (%), by Type 2024 & 2032
- Figure 34: Saudi Arabia Core Materials for Composites Industry Revenue (Million), by End-user Industry 2024 & 2032
- Figure 35: Saudi Arabia Core Materials for Composites Industry Revenue Share (%), by End-user Industry 2024 & 2032
- Figure 36: Saudi Arabia Core Materials for Composites Industry Revenue (Million), by Country 2024 & 2032
- Figure 37: Saudi Arabia Core Materials for Composites Industry Revenue Share (%), by Country 2024 & 2032
List of Tables
- Table 1: Global Core Materials for Composites Industry Revenue Million Forecast, by Region 2019 & 2032
- Table 2: Global Core Materials for Composites Industry Revenue Million Forecast, by Type 2019 & 2032
- Table 3: Global Core Materials for Composites Industry Revenue Million Forecast, by End-user Industry 2019 & 2032
- Table 4: Global Core Materials for Composites Industry Revenue Million Forecast, by Region 2019 & 2032
- Table 5: Global Core Materials for Composites Industry Revenue Million Forecast, by Type 2019 & 2032
- Table 6: Global Core Materials for Composites Industry Revenue Million Forecast, by End-user Industry 2019 & 2032
- Table 7: Global Core Materials for Composites Industry Revenue Million Forecast, by Country 2019 & 2032
- Table 8: China Core Materials for Composites Industry Revenue (Million) Forecast, by Application 2019 & 2032
- Table 9: India Core Materials for Composites Industry Revenue (Million) Forecast, by Application 2019 & 2032
- Table 10: Japan Core Materials for Composites Industry Revenue (Million) Forecast, by Application 2019 & 2032
- Table 11: South Korea Core Materials for Composites Industry Revenue (Million) Forecast, by Application 2019 & 2032
- Table 12: ASEAN Countries Core Materials for Composites Industry Revenue (Million) Forecast, by Application 2019 & 2032
- Table 13: Rest of Asia Pacific Core Materials for Composites Industry Revenue (Million) Forecast, by Application 2019 & 2032
- Table 14: Global Core Materials for Composites Industry Revenue Million Forecast, by Type 2019 & 2032
- Table 15: Global Core Materials for Composites Industry Revenue Million Forecast, by End-user Industry 2019 & 2032
- Table 16: Global Core Materials for Composites Industry Revenue Million Forecast, by Country 2019 & 2032
- Table 17: United States Core Materials for Composites Industry Revenue (Million) Forecast, by Application 2019 & 2032
- Table 18: Canada Core Materials for Composites Industry Revenue (Million) Forecast, by Application 2019 & 2032
- Table 19: Mexico Core Materials for Composites Industry Revenue (Million) Forecast, by Application 2019 & 2032
- Table 20: Global Core Materials for Composites Industry Revenue Million Forecast, by Type 2019 & 2032
- Table 21: Global Core Materials for Composites Industry Revenue Million Forecast, by End-user Industry 2019 & 2032
- Table 22: Global Core Materials for Composites Industry Revenue Million Forecast, by Country 2019 & 2032
- Table 23: Germany Core Materials for Composites Industry Revenue (Million) Forecast, by Application 2019 & 2032
- Table 24: United Kingdom Core Materials for Composites Industry Revenue (Million) Forecast, by Application 2019 & 2032
- Table 25: Italy Core Materials for Composites Industry Revenue (Million) Forecast, by Application 2019 & 2032
- Table 26: France Core Materials for Composites Industry Revenue (Million) Forecast, by Application 2019 & 2032
- Table 27: Spain Core Materials for Composites Industry Revenue (Million) Forecast, by Application 2019 & 2032
- Table 28: Rest of Europe Core Materials for Composites Industry Revenue (Million) Forecast, by Application 2019 & 2032
- Table 29: Global Core Materials for Composites Industry Revenue Million Forecast, by Type 2019 & 2032
- Table 30: Global Core Materials for Composites Industry Revenue Million Forecast, by End-user Industry 2019 & 2032
- Table 31: Global Core Materials for Composites Industry Revenue Million Forecast, by Country 2019 & 2032
- Table 32: Brazil Core Materials for Composites Industry Revenue (Million) Forecast, by Application 2019 & 2032
- Table 33: Argentina Core Materials for Composites Industry Revenue (Million) Forecast, by Application 2019 & 2032
- Table 34: Rest of South America Core Materials for Composites Industry Revenue (Million) Forecast, by Application 2019 & 2032
- Table 35: Global Core Materials for Composites Industry Revenue Million Forecast, by Type 2019 & 2032
- Table 36: Global Core Materials for Composites Industry Revenue Million Forecast, by End-user Industry 2019 & 2032
- Table 37: Global Core Materials for Composites Industry Revenue Million Forecast, by Country 2019 & 2032
- Table 38: Global Core Materials for Composites Industry Revenue Million Forecast, by Type 2019 & 2032
- Table 39: Global Core Materials for Composites Industry Revenue Million Forecast, by End-user Industry 2019 & 2032
- Table 40: Global Core Materials for Composites Industry Revenue Million Forecast, by Country 2019 & 2032
- Table 41: South Africa Core Materials for Composites Industry Revenue (Million) Forecast, by Application 2019 & 2032
- Table 42: Rest of Middle East Core Materials for Composites Industry Revenue (Million) Forecast, by Application 2019 & 2032
Frequently Asked Questions
1. What is the projected Compound Annual Growth Rate (CAGR) of the Core Materials for Composites Industry?
The projected CAGR is approximately > 8.00%.
2. Which companies are prominent players in the Core Materials for Composites Industry?
Key companies in the market include 3A Composites, Armacell International SA, Changzhou Tiansheng New Materials Co Ltd, Diab International AB, Euro-Composites SA, Evonik Industries AG, Gurit Holding AG, Hexcel Corporation, Plascore Incorporated, Saertex GmbH & Co KG, The Gill Corporation*List Not Exhaustive.
3. What are the main segments of the Core Materials for Composites Industry?
The market segments include Type, End-user Industry.
4. Can you provide details about the market size?
The market size is estimated to be USD XX Million as of 2022.
5. What are some drivers contributing to market growth?
; Increasing Demand from the Wind Energy Domain; Increasing Use of Composites in the Aerospace Industry; Emerging Applications in the Automotive Market.
6. What are the notable trends driving market growth?
Growing Usage in Aerospace and Defense Sector.
7. Are there any restraints impacting market growth?
; Increasing Demand from the Wind Energy Domain; Increasing Use of Composites in the Aerospace Industry; Emerging Applications in the Automotive Market.
8. Can you provide examples of recent developments in the market?
N/A
9. What pricing options are available for accessing the report?
Pricing options include single-user, multi-user, and enterprise licenses priced at USD 4750, USD 5250, and USD 8750 respectively.
10. Is the market size provided in terms of value or volume?
The market size is provided in terms of value, measured in Million.
11. Are there any specific market keywords associated with the report?
Yes, the market keyword associated with the report is "Core Materials for Composites Industry," which aids in identifying and referencing the specific market segment covered.
12. How do I determine which pricing option suits my needs best?
The pricing options vary based on user requirements and access needs. Individual users may opt for single-user licenses, while businesses requiring broader access may choose multi-user or enterprise licenses for cost-effective access to the report.
13. Are there any additional resources or data provided in the Core Materials for Composites Industry report?
While the report offers comprehensive insights, it's advisable to review the specific contents or supplementary materials provided to ascertain if additional resources or data are available.
14. How can I stay updated on further developments or reports in the Core Materials for Composites Industry?
To stay informed about further developments, trends, and reports in the Core Materials for Composites Industry, consider subscribing to industry newsletters, following relevant companies and organizations, or regularly checking reputable industry news sources and publications.
Methodology
Step 1 - Identification of Relevant Samples Size from Population Database


Step 2 - Approaches for Defining Global Market Size (Value, Volume* & Price*)

Note*: In applicable scenarios
Step 3 - Data Sources
Primary Research
- Web Analytics
- Survey Reports
- Research Institute
- Latest Research Reports
- Opinion Leaders
Secondary Research
- Annual Reports
- White Paper
- Latest Press Release
- Industry Association
- Paid Database
- Investor Presentations

Step 4 - Data Triangulation
Involves using different sources of information in order to increase the validity of a study
These sources are likely to be stakeholders in a program - participants, other researchers, program staff, other community members, and so on.
Then we put all data in single framework & apply various statistical tools to find out the dynamic on the market.
During the analysis stage, feedback from the stakeholder groups would be compared to determine areas of agreement as well as areas of divergence
