

Key Insights
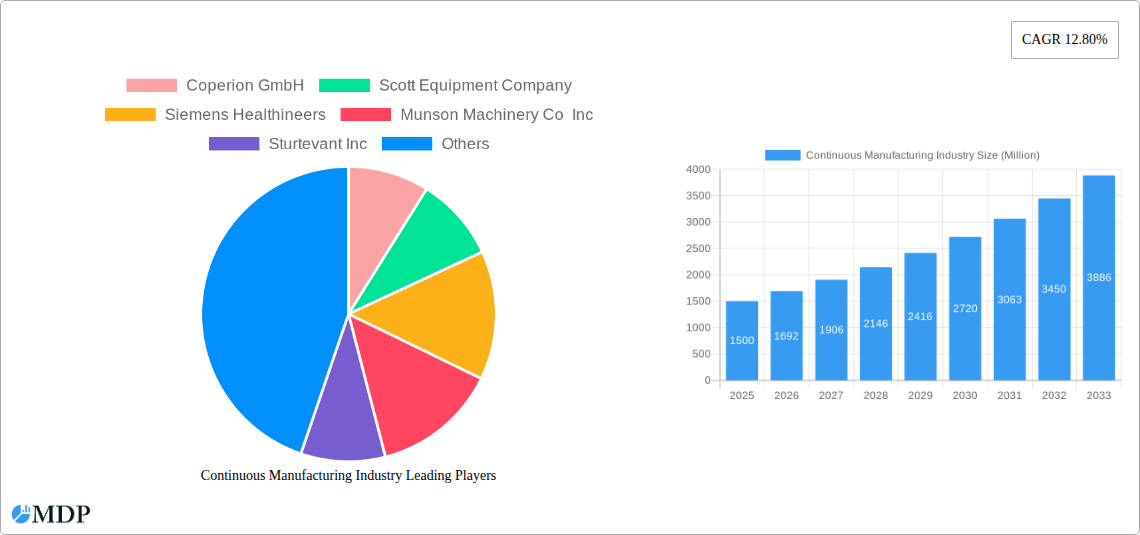
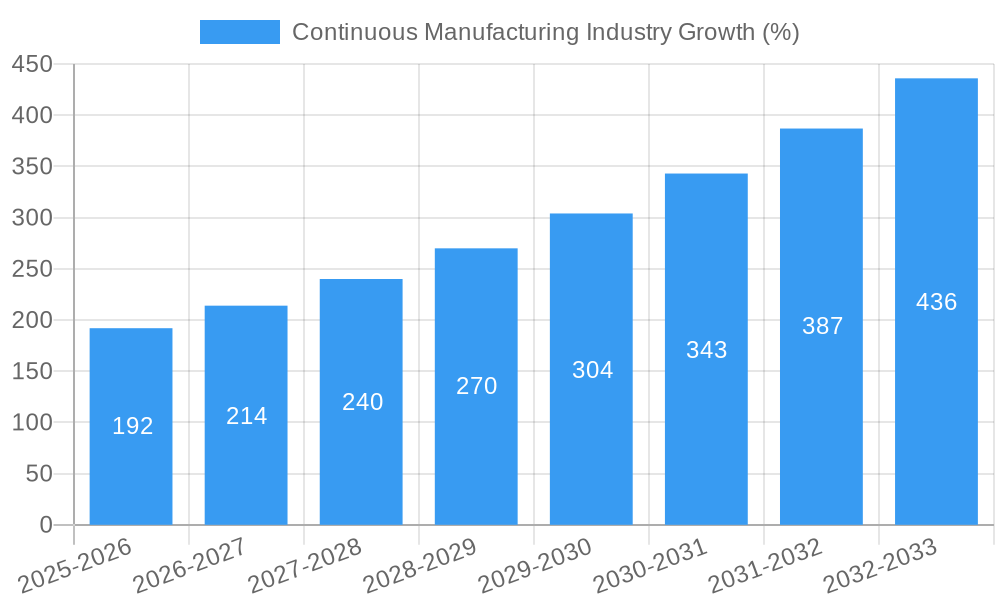
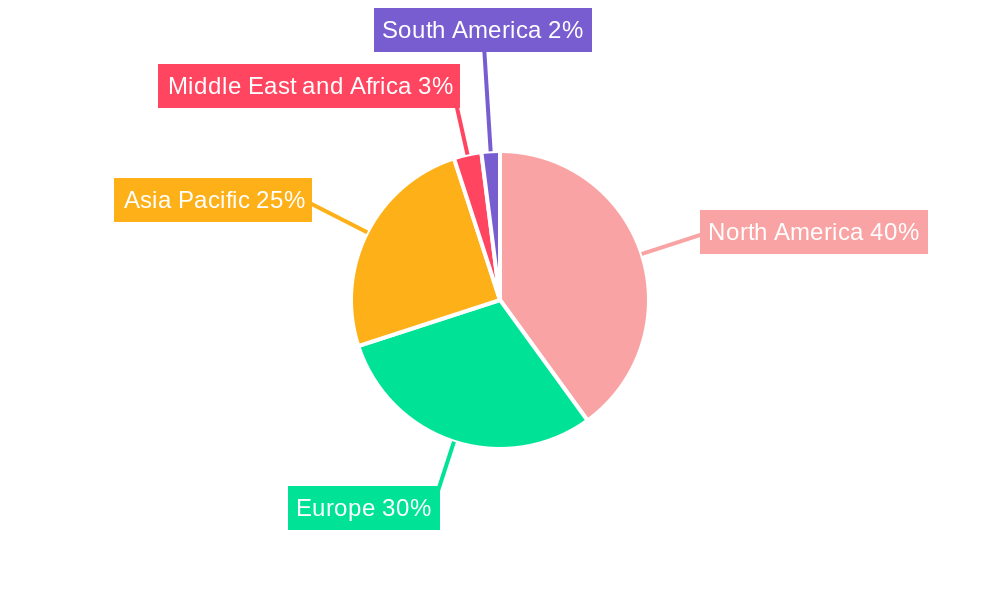
The continuous manufacturing industry is experiencing robust growth, driven by increasing demand for efficient and cost-effective pharmaceutical production. A CAGR of 12.80% from 2019 to 2024 indicates a significant upward trajectory, projected to continue into the forecast period (2025-2033). This expansion is fueled by several key factors. Firstly, the pharmaceutical industry's ongoing push for improved quality control and reduced production variability is a major catalyst. Continuous manufacturing offers superior process control compared to traditional batch methods, leading to higher product consistency and reduced waste. Secondly, the rising adoption of integrated continuous manufacturing systems, offering end-to-end automation and optimization, further accelerates market growth. This trend is particularly prominent in API (Active Pharmaceutical Ingredient) manufacturing, where continuous processes enhance productivity and reduce manufacturing lead times. Finally, the increasing outsourcing of manufacturing activities to contract manufacturers contributes significantly to market expansion. Contract manufacturers are embracing continuous manufacturing technologies to meet the growing demands of pharmaceutical companies while enhancing their competitiveness. The market segmentation reveals a strong preference for integrated systems over semi-continuous ones, reflecting the industry's pursuit of complete process optimization. While North America currently holds a significant market share, the Asia-Pacific region, particularly China and India, is expected to witness rapid growth due to expanding pharmaceutical industries and increasing investments in advanced manufacturing technologies.
Market restraints include the high initial investment costs associated with adopting continuous manufacturing technologies, which can be a barrier for smaller pharmaceutical companies. Furthermore, the need for specialized expertise and skilled labor to operate and maintain these complex systems presents a challenge. However, these challenges are being addressed through increased collaboration between technology providers and pharmaceutical companies, alongside the emergence of training programs that focus on the skills needed for continuous manufacturing. The market is also witnessing a gradual shift towards a higher level of integration within the production process, which in turn boosts efficiency and decreases manufacturing expenses. This trend is expected to continue to drive the adoption of continuous manufacturing technologies and foster further market growth during the forecast period. Geographic expansion, particularly in emerging markets, alongside ongoing technological advancements, will contribute significantly to the market's continued expansion in the coming years.
Continuous Manufacturing Industry: A Comprehensive Market Report (2019-2033)
This comprehensive report provides an in-depth analysis of the Continuous Manufacturing Industry, offering invaluable insights for stakeholders across the value chain. With a study period spanning 2019-2033, a base year of 2025, and a forecast period of 2025-2033, this report leverages historical data (2019-2024) to project future market trends and growth opportunities. The report examines market dynamics, leading players, key segments, and emerging trends, providing actionable intelligence to navigate this rapidly evolving landscape. The market is projected to reach xx Million by 2033.
Continuous Manufacturing Industry Market Dynamics & Concentration
The Continuous Manufacturing Industry is characterized by a moderately concentrated market landscape, with several key players holding significant market share. Innovation, driven by the need for increased efficiency and reduced costs, is a key driver. Stringent regulatory frameworks, particularly within the pharmaceutical sector, heavily influence market dynamics. While limited, product substitutes exist, but the unique advantages of continuous manufacturing often outweigh alternatives. End-user trends show a growing preference for continuous processes due to their improved quality, reduced waste, and increased output. Mergers and acquisitions (M&A) activity is expected to intensify, as larger players seek to consolidate their market position and expand their technological capabilities. For example, in the historical period, an estimated xx M&A deals were recorded, leading to a market concentration of approximately xx%. The projected CAGR from 2025 to 2033 is expected to be xx%.
- Market Concentration: xx% in 2025, projected to reach xx% by 2033.
- M&A Activity: xx deals in the historical period (2019-2024); a projected xx deals from 2025 to 2033.
- Innovation Drivers: Demand for increased efficiency, reduced waste, and improved product quality.
- Regulatory Frameworks: Stringent guidelines from regulatory bodies like the FDA influence adoption rates.
Continuous Manufacturing Industry Industry Trends & Analysis
The Continuous Manufacturing Industry is experiencing robust growth, propelled by several key factors. The increasing demand for high-quality pharmaceuticals and fine chemicals is a major driver, pushing manufacturers to adopt more efficient and cost-effective production methods. Technological advancements, such as advanced process analytics and automation, are further streamlining operations and improving product consistency. Consumer preferences for higher quality and safer products are driving increased demand for continuous manufacturing processes. Competitive dynamics are shaped by innovation, pricing strategies, and the ability to meet stringent regulatory requirements. The market is witnessing a shift towards integrated continuous manufacturing solutions, further enhancing efficiency. The market is experiencing a CAGR of xx% from 2025 to 2033, indicating significant growth potential. Market penetration for continuous manufacturing in the pharmaceutical sector is xx% in 2025 and projected to rise to xx% by 2033.
Leading Markets & Segments in Continuous Manufacturing Industry
The pharmaceutical industry dominates the Continuous Manufacturing Industry, particularly within the API (Active Pharmaceutical Ingredient) manufacturing segment. North America and Europe are currently the leading regions, driven by strong regulatory support, technological advancement, and a large established pharmaceutical sector. Asia-Pacific is expected to witness substantial growth due to increasing investments in pharmaceutical infrastructure and manufacturing.
- Dominant Region: North America
- Dominant Segment (Product): Integrated Continuous Manufacturing
- Dominant Segment (Application): API Manufacturing
- Dominant Segment (End User): Pharmaceutical Companies
Key Drivers by Region/Segment:
- North America: Strong regulatory support, advanced technological infrastructure, high R&D investment.
- Europe: Similar to North America but with potentially stricter regulations driving innovation.
- Asia-Pacific: Significant growth potential due to increasing pharmaceutical manufacturing investments and government support.
- Integrated Continuous Manufacturing: Offers greater efficiency and control over the entire manufacturing process.
- API Manufacturing: High demand for continuous production to improve the efficiency of API creation.
- Pharmaceutical Companies: Largest end-users, driving innovation and demand for advanced solutions.
Continuous Manufacturing Industry Product Developments
Recent advancements in continuous manufacturing include improved process control systems, advanced sensors, and integrated automation. These innovations enhance efficiency, reduce waste, and improve product quality, leading to significant competitive advantages. The focus is on developing more flexible and adaptable systems to cater to the diverse needs of various applications. The integration of digital technologies, such as AI and machine learning, is further enhancing process optimization and predictive maintenance capabilities.
Key Drivers of Continuous Manufacturing Industry Growth
Technological advancements are the primary driver of growth, particularly the adoption of automation, AI, and advanced process analytics. The growing demand for high-quality, cost-effective products, driven by increasing healthcare spending, fuels industry growth. Favorable regulatory frameworks encouraging the adoption of continuous manufacturing also contribute significantly. The need for reduced waste and enhanced environmental sustainability further incentivizes the shift towards continuous manufacturing processes.
Challenges in the Continuous Manufacturing Industry Market
Regulatory hurdles and complexities can be significant barriers to adoption, especially in the pharmaceutical industry. Supply chain disruptions, particularly the availability of specialized equipment and skilled personnel, can impact production. Intense competition, with established players and new entrants, puts pressure on pricing and margins. The high initial investment required for implementing continuous manufacturing can also deter smaller companies. The estimated impact of these challenges is a projected xx Million loss annually in the forecast period.
Emerging Opportunities in Continuous Manufacturing Industry
The increasing adoption of digitalization and Industry 4.0 technologies opens significant opportunities for process optimization and improved efficiency. Strategic partnerships between equipment manufacturers, pharmaceutical companies, and technology providers are creating innovative solutions and accelerating market growth. Expansion into new applications and markets, such as fine chemicals and food processing, presents significant potential for future growth. Further investments in R&D to improve efficiency and reduce waste are also expected to create further opportunities.
Leading Players in the Continuous Manufacturing Industry Sector
- Coperion GmbH
- Scott Equipment Company
- Siemens Healthineers
- Munson Machinery Co Inc
- Sturtevant Inc
- GEA Group AG
- L B Bohle
- Robert Bosch GmbH
- Glatt GmbH
- Thermo Fisher Scientific
- HOSOKAWA MICRON CORP
Key Milestones in Continuous Manufacturing Industry Industry
- March 2022: Phlow Corp establishes alliances with VCU Medicines for All Institute and AMPAC fine chemicals to provide contract continuous manufacturing R&D services. This significantly expands the availability of contract manufacturing expertise for small molecule pharmaceutical products, impacting the competitive landscape and driving market growth.
- March 2022: USP India invests USD 20 Million in a new continuous manufacturing facility in Hyderabad. This investment highlights the growing adoption of continuous manufacturing in emerging markets and showcases a commitment to advanced manufacturing techniques in the pharmaceutical sector, impacting capacity and market share.
Strategic Outlook for Continuous Manufacturing Industry Market
The Continuous Manufacturing Industry is poised for significant growth, driven by technological innovation, increasing demand for high-quality products, and supportive regulatory frameworks. Strategic partnerships and collaborations will play a crucial role in accelerating market expansion. Companies that invest in advanced technologies, develop innovative solutions, and build strong supply chains will be well-positioned to capitalize on the significant opportunities presented by this evolving market. The focus on sustainability and reduced environmental impact will further drive industry growth and attract investment.
Continuous Manufacturing Industry Segmentation
-
1. Product
- 1.1. Integrated Continuous Manufacturing
-
1.2. Semi Continous Manufacturing
- 1.2.1. Continuous Blenders
- 1.2.2. Continuous Granulators
- 1.2.3. Continuos Coaters
- 1.2.4. Continuous Compressors
- 1.2.5. Continuous Dryers
- 1.2.6. Other Semi-continuous Manufacturing Products
-
2. Application
- 2.1. API Manufacturing
- 2.2. End Product Manufacturing
-
3. End User
- 3.1. Contract Manufacturers
- 3.2. Pharmacuitical Companies
- 3.3. Other End Users
Continuous Manufacturing Industry Segmentation By Geography
-
1. North America
- 1.1. United States
- 1.2. Canada
- 1.3. Mexico
-
2. Europe
- 2.1. Germany
- 2.2. United Kingdom
- 2.3. France
- 2.4. Italy
- 2.5. Spain
- 2.6. Rest of Europe
-
3. Asia Pacific
- 3.1. China
- 3.2. Japan
- 3.3. India
- 3.4. Australia
- 3.5. South Korea
- 3.6. Rest of Asia Pacific
-
4. Middle East and Africa
- 4.1. GCC
- 4.2. South Africa
- 4.3. Rest of Middle East and Africa
-
5. South America
- 5.1. Brazil
- 5.2. Argentina
- 5.3. Rest of South America
Continuous Manufacturing Industry REPORT HIGHLIGHTS
| Aspects | Details |
|---|---|
| Study Period | 2019-2033 |
| Base Year | 2024 |
| Estimated Year | 2025 |
| Forecast Period | 2025-2033 |
| Historical Period | 2019-2024 |
| Growth Rate | CAGR of 12.80% from 2019-2033 |
| Segmentation |
|
Table of Contents
- 1. Introduction
- 1.1. Research Scope
- 1.2. Market Segmentation
- 1.3. Research Methodology
- 1.4. Definitions and Assumptions
- 2. Executive Summary
- 2.1. Introduction
- 3. Market Dynamics
- 3.1. Introduction
- 3.2. Market Drivers
- 3.2.1. Less Cost and Better Quality of Production; Support from Regulatory Authorities Around the World
- 3.3. Market Restrains
- 3.3.1. Lack of Regulatory and Technical Clarity; Slow adaptation and Rigidity Among the Industries
- 3.4. Market Trends
- 3.4.1. Integrated Continuous Manufacturing is Projected to Grow at Significant Rate Over the Forecast Period
- 4. Market Factor Analysis
- 4.1. Porters Five Forces
- 4.2. Supply/Value Chain
- 4.3. PESTEL analysis
- 4.4. Market Entropy
- 4.5. Patent/Trademark Analysis
- 5. Global Continuous Manufacturing Industry Analysis, Insights and Forecast, 2019-2031
- 5.1. Market Analysis, Insights and Forecast - by Product
- 5.1.1. Integrated Continuous Manufacturing
- 5.1.2. Semi Continous Manufacturing
- 5.1.2.1. Continuous Blenders
- 5.1.2.2. Continuous Granulators
- 5.1.2.3. Continuos Coaters
- 5.1.2.4. Continuous Compressors
- 5.1.2.5. Continuous Dryers
- 5.1.2.6. Other Semi-continuous Manufacturing Products
- 5.2. Market Analysis, Insights and Forecast - by Application
- 5.2.1. API Manufacturing
- 5.2.2. End Product Manufacturing
- 5.3. Market Analysis, Insights and Forecast - by End User
- 5.3.1. Contract Manufacturers
- 5.3.2. Pharmacuitical Companies
- 5.3.3. Other End Users
- 5.4. Market Analysis, Insights and Forecast - by Region
- 5.4.1. North America
- 5.4.2. Europe
- 5.4.3. Asia Pacific
- 5.4.4. Middle East and Africa
- 5.4.5. South America
- 5.1. Market Analysis, Insights and Forecast - by Product
- 6. North America Continuous Manufacturing Industry Analysis, Insights and Forecast, 2019-2031
- 6.1. Market Analysis, Insights and Forecast - by Product
- 6.1.1. Integrated Continuous Manufacturing
- 6.1.2. Semi Continous Manufacturing
- 6.1.2.1. Continuous Blenders
- 6.1.2.2. Continuous Granulators
- 6.1.2.3. Continuos Coaters
- 6.1.2.4. Continuous Compressors
- 6.1.2.5. Continuous Dryers
- 6.1.2.6. Other Semi-continuous Manufacturing Products
- 6.2. Market Analysis, Insights and Forecast - by Application
- 6.2.1. API Manufacturing
- 6.2.2. End Product Manufacturing
- 6.3. Market Analysis, Insights and Forecast - by End User
- 6.3.1. Contract Manufacturers
- 6.3.2. Pharmacuitical Companies
- 6.3.3. Other End Users
- 6.1. Market Analysis, Insights and Forecast - by Product
- 7. Europe Continuous Manufacturing Industry Analysis, Insights and Forecast, 2019-2031
- 7.1. Market Analysis, Insights and Forecast - by Product
- 7.1.1. Integrated Continuous Manufacturing
- 7.1.2. Semi Continous Manufacturing
- 7.1.2.1. Continuous Blenders
- 7.1.2.2. Continuous Granulators
- 7.1.2.3. Continuos Coaters
- 7.1.2.4. Continuous Compressors
- 7.1.2.5. Continuous Dryers
- 7.1.2.6. Other Semi-continuous Manufacturing Products
- 7.2. Market Analysis, Insights and Forecast - by Application
- 7.2.1. API Manufacturing
- 7.2.2. End Product Manufacturing
- 7.3. Market Analysis, Insights and Forecast - by End User
- 7.3.1. Contract Manufacturers
- 7.3.2. Pharmacuitical Companies
- 7.3.3. Other End Users
- 7.1. Market Analysis, Insights and Forecast - by Product
- 8. Asia Pacific Continuous Manufacturing Industry Analysis, Insights and Forecast, 2019-2031
- 8.1. Market Analysis, Insights and Forecast - by Product
- 8.1.1. Integrated Continuous Manufacturing
- 8.1.2. Semi Continous Manufacturing
- 8.1.2.1. Continuous Blenders
- 8.1.2.2. Continuous Granulators
- 8.1.2.3. Continuos Coaters
- 8.1.2.4. Continuous Compressors
- 8.1.2.5. Continuous Dryers
- 8.1.2.6. Other Semi-continuous Manufacturing Products
- 8.2. Market Analysis, Insights and Forecast - by Application
- 8.2.1. API Manufacturing
- 8.2.2. End Product Manufacturing
- 8.3. Market Analysis, Insights and Forecast - by End User
- 8.3.1. Contract Manufacturers
- 8.3.2. Pharmacuitical Companies
- 8.3.3. Other End Users
- 8.1. Market Analysis, Insights and Forecast - by Product
- 9. Middle East and Africa Continuous Manufacturing Industry Analysis, Insights and Forecast, 2019-2031
- 9.1. Market Analysis, Insights and Forecast - by Product
- 9.1.1. Integrated Continuous Manufacturing
- 9.1.2. Semi Continous Manufacturing
- 9.1.2.1. Continuous Blenders
- 9.1.2.2. Continuous Granulators
- 9.1.2.3. Continuos Coaters
- 9.1.2.4. Continuous Compressors
- 9.1.2.5. Continuous Dryers
- 9.1.2.6. Other Semi-continuous Manufacturing Products
- 9.2. Market Analysis, Insights and Forecast - by Application
- 9.2.1. API Manufacturing
- 9.2.2. End Product Manufacturing
- 9.3. Market Analysis, Insights and Forecast - by End User
- 9.3.1. Contract Manufacturers
- 9.3.2. Pharmacuitical Companies
- 9.3.3. Other End Users
- 9.1. Market Analysis, Insights and Forecast - by Product
- 10. South America Continuous Manufacturing Industry Analysis, Insights and Forecast, 2019-2031
- 10.1. Market Analysis, Insights and Forecast - by Product
- 10.1.1. Integrated Continuous Manufacturing
- 10.1.2. Semi Continous Manufacturing
- 10.1.2.1. Continuous Blenders
- 10.1.2.2. Continuous Granulators
- 10.1.2.3. Continuos Coaters
- 10.1.2.4. Continuous Compressors
- 10.1.2.5. Continuous Dryers
- 10.1.2.6. Other Semi-continuous Manufacturing Products
- 10.2. Market Analysis, Insights and Forecast - by Application
- 10.2.1. API Manufacturing
- 10.2.2. End Product Manufacturing
- 10.3. Market Analysis, Insights and Forecast - by End User
- 10.3.1. Contract Manufacturers
- 10.3.2. Pharmacuitical Companies
- 10.3.3. Other End Users
- 10.1. Market Analysis, Insights and Forecast - by Product
- 11. North America Continuous Manufacturing Industry Analysis, Insights and Forecast, 2019-2031
- 11.1. Market Analysis, Insights and Forecast - By Country/Sub-region
- 11.1.1 United States
- 11.1.2 Canada
- 11.1.3 Mexico
- 12. Europe Continuous Manufacturing Industry Analysis, Insights and Forecast, 2019-2031
- 12.1. Market Analysis, Insights and Forecast - By Country/Sub-region
- 12.1.1 Germany
- 12.1.2 United Kingdom
- 12.1.3 France
- 12.1.4 Italy
- 12.1.5 Spain
- 12.1.6 Rest of Europe
- 13. Asia Pacific Continuous Manufacturing Industry Analysis, Insights and Forecast, 2019-2031
- 13.1. Market Analysis, Insights and Forecast - By Country/Sub-region
- 13.1.1 China
- 13.1.2 Japan
- 13.1.3 India
- 13.1.4 Australia
- 13.1.5 South Korea
- 13.1.6 Rest of Asia Pacific
- 14. Middle East and Africa Continuous Manufacturing Industry Analysis, Insights and Forecast, 2019-2031
- 14.1. Market Analysis, Insights and Forecast - By Country/Sub-region
- 14.1.1 GCC
- 14.1.2 South Africa
- 14.1.3 Rest of Middle East and Africa
- 15. South America Continuous Manufacturing Industry Analysis, Insights and Forecast, 2019-2031
- 15.1. Market Analysis, Insights and Forecast - By Country/Sub-region
- 15.1.1 Brazil
- 15.1.2 Argentina
- 15.1.3 Rest of South America
- 16. Competitive Analysis
- 16.1. Global Market Share Analysis 2024
- 16.2. Company Profiles
- 16.2.1 Coperion GmbH
- 16.2.1.1. Overview
- 16.2.1.2. Products
- 16.2.1.3. SWOT Analysis
- 16.2.1.4. Recent Developments
- 16.2.1.5. Financials (Based on Availability)
- 16.2.2 Scott Equipment Company
- 16.2.2.1. Overview
- 16.2.2.2. Products
- 16.2.2.3. SWOT Analysis
- 16.2.2.4. Recent Developments
- 16.2.2.5. Financials (Based on Availability)
- 16.2.3 Siemens Healthineers
- 16.2.3.1. Overview
- 16.2.3.2. Products
- 16.2.3.3. SWOT Analysis
- 16.2.3.4. Recent Developments
- 16.2.3.5. Financials (Based on Availability)
- 16.2.4 Munson Machinery Co Inc
- 16.2.4.1. Overview
- 16.2.4.2. Products
- 16.2.4.3. SWOT Analysis
- 16.2.4.4. Recent Developments
- 16.2.4.5. Financials (Based on Availability)
- 16.2.5 Sturtevant Inc
- 16.2.5.1. Overview
- 16.2.5.2. Products
- 16.2.5.3. SWOT Analysis
- 16.2.5.4. Recent Developments
- 16.2.5.5. Financials (Based on Availability)
- 16.2.6 GEA Group AG
- 16.2.6.1. Overview
- 16.2.6.2. Products
- 16.2.6.3. SWOT Analysis
- 16.2.6.4. Recent Developments
- 16.2.6.5. Financials (Based on Availability)
- 16.2.7 L B Bohle
- 16.2.7.1. Overview
- 16.2.7.2. Products
- 16.2.7.3. SWOT Analysis
- 16.2.7.4. Recent Developments
- 16.2.7.5. Financials (Based on Availability)
- 16.2.8 Robert Bosch GmbH
- 16.2.8.1. Overview
- 16.2.8.2. Products
- 16.2.8.3. SWOT Analysis
- 16.2.8.4. Recent Developments
- 16.2.8.5. Financials (Based on Availability)
- 16.2.9 Glatt GmbH
- 16.2.9.1. Overview
- 16.2.9.2. Products
- 16.2.9.3. SWOT Analysis
- 16.2.9.4. Recent Developments
- 16.2.9.5. Financials (Based on Availability)
- 16.2.10 Thermo Fisher Scientific
- 16.2.10.1. Overview
- 16.2.10.2. Products
- 16.2.10.3. SWOT Analysis
- 16.2.10.4. Recent Developments
- 16.2.10.5. Financials (Based on Availability)
- 16.2.11 HOSOKAWA MICRON CORP
- 16.2.11.1. Overview
- 16.2.11.2. Products
- 16.2.11.3. SWOT Analysis
- 16.2.11.4. Recent Developments
- 16.2.11.5. Financials (Based on Availability)
- 16.2.1 Coperion GmbH
List of Figures
- Figure 1: Global Continuous Manufacturing Industry Revenue Breakdown (Million, %) by Region 2024 & 2032
- Figure 2: North America Continuous Manufacturing Industry Revenue (Million), by Country 2024 & 2032
- Figure 3: North America Continuous Manufacturing Industry Revenue Share (%), by Country 2024 & 2032
- Figure 4: Europe Continuous Manufacturing Industry Revenue (Million), by Country 2024 & 2032
- Figure 5: Europe Continuous Manufacturing Industry Revenue Share (%), by Country 2024 & 2032
- Figure 6: Asia Pacific Continuous Manufacturing Industry Revenue (Million), by Country 2024 & 2032
- Figure 7: Asia Pacific Continuous Manufacturing Industry Revenue Share (%), by Country 2024 & 2032
- Figure 8: Middle East and Africa Continuous Manufacturing Industry Revenue (Million), by Country 2024 & 2032
- Figure 9: Middle East and Africa Continuous Manufacturing Industry Revenue Share (%), by Country 2024 & 2032
- Figure 10: South America Continuous Manufacturing Industry Revenue (Million), by Country 2024 & 2032
- Figure 11: South America Continuous Manufacturing Industry Revenue Share (%), by Country 2024 & 2032
- Figure 12: North America Continuous Manufacturing Industry Revenue (Million), by Product 2024 & 2032
- Figure 13: North America Continuous Manufacturing Industry Revenue Share (%), by Product 2024 & 2032
- Figure 14: North America Continuous Manufacturing Industry Revenue (Million), by Application 2024 & 2032
- Figure 15: North America Continuous Manufacturing Industry Revenue Share (%), by Application 2024 & 2032
- Figure 16: North America Continuous Manufacturing Industry Revenue (Million), by End User 2024 & 2032
- Figure 17: North America Continuous Manufacturing Industry Revenue Share (%), by End User 2024 & 2032
- Figure 18: North America Continuous Manufacturing Industry Revenue (Million), by Country 2024 & 2032
- Figure 19: North America Continuous Manufacturing Industry Revenue Share (%), by Country 2024 & 2032
- Figure 20: Europe Continuous Manufacturing Industry Revenue (Million), by Product 2024 & 2032
- Figure 21: Europe Continuous Manufacturing Industry Revenue Share (%), by Product 2024 & 2032
- Figure 22: Europe Continuous Manufacturing Industry Revenue (Million), by Application 2024 & 2032
- Figure 23: Europe Continuous Manufacturing Industry Revenue Share (%), by Application 2024 & 2032
- Figure 24: Europe Continuous Manufacturing Industry Revenue (Million), by End User 2024 & 2032
- Figure 25: Europe Continuous Manufacturing Industry Revenue Share (%), by End User 2024 & 2032
- Figure 26: Europe Continuous Manufacturing Industry Revenue (Million), by Country 2024 & 2032
- Figure 27: Europe Continuous Manufacturing Industry Revenue Share (%), by Country 2024 & 2032
- Figure 28: Asia Pacific Continuous Manufacturing Industry Revenue (Million), by Product 2024 & 2032
- Figure 29: Asia Pacific Continuous Manufacturing Industry Revenue Share (%), by Product 2024 & 2032
- Figure 30: Asia Pacific Continuous Manufacturing Industry Revenue (Million), by Application 2024 & 2032
- Figure 31: Asia Pacific Continuous Manufacturing Industry Revenue Share (%), by Application 2024 & 2032
- Figure 32: Asia Pacific Continuous Manufacturing Industry Revenue (Million), by End User 2024 & 2032
- Figure 33: Asia Pacific Continuous Manufacturing Industry Revenue Share (%), by End User 2024 & 2032
- Figure 34: Asia Pacific Continuous Manufacturing Industry Revenue (Million), by Country 2024 & 2032
- Figure 35: Asia Pacific Continuous Manufacturing Industry Revenue Share (%), by Country 2024 & 2032
- Figure 36: Middle East and Africa Continuous Manufacturing Industry Revenue (Million), by Product 2024 & 2032
- Figure 37: Middle East and Africa Continuous Manufacturing Industry Revenue Share (%), by Product 2024 & 2032
- Figure 38: Middle East and Africa Continuous Manufacturing Industry Revenue (Million), by Application 2024 & 2032
- Figure 39: Middle East and Africa Continuous Manufacturing Industry Revenue Share (%), by Application 2024 & 2032
- Figure 40: Middle East and Africa Continuous Manufacturing Industry Revenue (Million), by End User 2024 & 2032
- Figure 41: Middle East and Africa Continuous Manufacturing Industry Revenue Share (%), by End User 2024 & 2032
- Figure 42: Middle East and Africa Continuous Manufacturing Industry Revenue (Million), by Country 2024 & 2032
- Figure 43: Middle East and Africa Continuous Manufacturing Industry Revenue Share (%), by Country 2024 & 2032
- Figure 44: South America Continuous Manufacturing Industry Revenue (Million), by Product 2024 & 2032
- Figure 45: South America Continuous Manufacturing Industry Revenue Share (%), by Product 2024 & 2032
- Figure 46: South America Continuous Manufacturing Industry Revenue (Million), by Application 2024 & 2032
- Figure 47: South America Continuous Manufacturing Industry Revenue Share (%), by Application 2024 & 2032
- Figure 48: South America Continuous Manufacturing Industry Revenue (Million), by End User 2024 & 2032
- Figure 49: South America Continuous Manufacturing Industry Revenue Share (%), by End User 2024 & 2032
- Figure 50: South America Continuous Manufacturing Industry Revenue (Million), by Country 2024 & 2032
- Figure 51: South America Continuous Manufacturing Industry Revenue Share (%), by Country 2024 & 2032
List of Tables
- Table 1: Global Continuous Manufacturing Industry Revenue Million Forecast, by Region 2019 & 2032
- Table 2: Global Continuous Manufacturing Industry Revenue Million Forecast, by Product 2019 & 2032
- Table 3: Global Continuous Manufacturing Industry Revenue Million Forecast, by Application 2019 & 2032
- Table 4: Global Continuous Manufacturing Industry Revenue Million Forecast, by End User 2019 & 2032
- Table 5: Global Continuous Manufacturing Industry Revenue Million Forecast, by Region 2019 & 2032
- Table 6: Global Continuous Manufacturing Industry Revenue Million Forecast, by Country 2019 & 2032
- Table 7: United States Continuous Manufacturing Industry Revenue (Million) Forecast, by Application 2019 & 2032
- Table 8: Canada Continuous Manufacturing Industry Revenue (Million) Forecast, by Application 2019 & 2032
- Table 9: Mexico Continuous Manufacturing Industry Revenue (Million) Forecast, by Application 2019 & 2032
- Table 10: Global Continuous Manufacturing Industry Revenue Million Forecast, by Country 2019 & 2032
- Table 11: Germany Continuous Manufacturing Industry Revenue (Million) Forecast, by Application 2019 & 2032
- Table 12: United Kingdom Continuous Manufacturing Industry Revenue (Million) Forecast, by Application 2019 & 2032
- Table 13: France Continuous Manufacturing Industry Revenue (Million) Forecast, by Application 2019 & 2032
- Table 14: Italy Continuous Manufacturing Industry Revenue (Million) Forecast, by Application 2019 & 2032
- Table 15: Spain Continuous Manufacturing Industry Revenue (Million) Forecast, by Application 2019 & 2032
- Table 16: Rest of Europe Continuous Manufacturing Industry Revenue (Million) Forecast, by Application 2019 & 2032
- Table 17: Global Continuous Manufacturing Industry Revenue Million Forecast, by Country 2019 & 2032
- Table 18: China Continuous Manufacturing Industry Revenue (Million) Forecast, by Application 2019 & 2032
- Table 19: Japan Continuous Manufacturing Industry Revenue (Million) Forecast, by Application 2019 & 2032
- Table 20: India Continuous Manufacturing Industry Revenue (Million) Forecast, by Application 2019 & 2032
- Table 21: Australia Continuous Manufacturing Industry Revenue (Million) Forecast, by Application 2019 & 2032
- Table 22: South Korea Continuous Manufacturing Industry Revenue (Million) Forecast, by Application 2019 & 2032
- Table 23: Rest of Asia Pacific Continuous Manufacturing Industry Revenue (Million) Forecast, by Application 2019 & 2032
- Table 24: Global Continuous Manufacturing Industry Revenue Million Forecast, by Country 2019 & 2032
- Table 25: GCC Continuous Manufacturing Industry Revenue (Million) Forecast, by Application 2019 & 2032
- Table 26: South Africa Continuous Manufacturing Industry Revenue (Million) Forecast, by Application 2019 & 2032
- Table 27: Rest of Middle East and Africa Continuous Manufacturing Industry Revenue (Million) Forecast, by Application 2019 & 2032
- Table 28: Global Continuous Manufacturing Industry Revenue Million Forecast, by Country 2019 & 2032
- Table 29: Brazil Continuous Manufacturing Industry Revenue (Million) Forecast, by Application 2019 & 2032
- Table 30: Argentina Continuous Manufacturing Industry Revenue (Million) Forecast, by Application 2019 & 2032
- Table 31: Rest of South America Continuous Manufacturing Industry Revenue (Million) Forecast, by Application 2019 & 2032
- Table 32: Global Continuous Manufacturing Industry Revenue Million Forecast, by Product 2019 & 2032
- Table 33: Global Continuous Manufacturing Industry Revenue Million Forecast, by Application 2019 & 2032
- Table 34: Global Continuous Manufacturing Industry Revenue Million Forecast, by End User 2019 & 2032
- Table 35: Global Continuous Manufacturing Industry Revenue Million Forecast, by Country 2019 & 2032
- Table 36: United States Continuous Manufacturing Industry Revenue (Million) Forecast, by Application 2019 & 2032
- Table 37: Canada Continuous Manufacturing Industry Revenue (Million) Forecast, by Application 2019 & 2032
- Table 38: Mexico Continuous Manufacturing Industry Revenue (Million) Forecast, by Application 2019 & 2032
- Table 39: Global Continuous Manufacturing Industry Revenue Million Forecast, by Product 2019 & 2032
- Table 40: Global Continuous Manufacturing Industry Revenue Million Forecast, by Application 2019 & 2032
- Table 41: Global Continuous Manufacturing Industry Revenue Million Forecast, by End User 2019 & 2032
- Table 42: Global Continuous Manufacturing Industry Revenue Million Forecast, by Country 2019 & 2032
- Table 43: Germany Continuous Manufacturing Industry Revenue (Million) Forecast, by Application 2019 & 2032
- Table 44: United Kingdom Continuous Manufacturing Industry Revenue (Million) Forecast, by Application 2019 & 2032
- Table 45: France Continuous Manufacturing Industry Revenue (Million) Forecast, by Application 2019 & 2032
- Table 46: Italy Continuous Manufacturing Industry Revenue (Million) Forecast, by Application 2019 & 2032
- Table 47: Spain Continuous Manufacturing Industry Revenue (Million) Forecast, by Application 2019 & 2032
- Table 48: Rest of Europe Continuous Manufacturing Industry Revenue (Million) Forecast, by Application 2019 & 2032
- Table 49: Global Continuous Manufacturing Industry Revenue Million Forecast, by Product 2019 & 2032
- Table 50: Global Continuous Manufacturing Industry Revenue Million Forecast, by Application 2019 & 2032
- Table 51: Global Continuous Manufacturing Industry Revenue Million Forecast, by End User 2019 & 2032
- Table 52: Global Continuous Manufacturing Industry Revenue Million Forecast, by Country 2019 & 2032
- Table 53: China Continuous Manufacturing Industry Revenue (Million) Forecast, by Application 2019 & 2032
- Table 54: Japan Continuous Manufacturing Industry Revenue (Million) Forecast, by Application 2019 & 2032
- Table 55: India Continuous Manufacturing Industry Revenue (Million) Forecast, by Application 2019 & 2032
- Table 56: Australia Continuous Manufacturing Industry Revenue (Million) Forecast, by Application 2019 & 2032
- Table 57: South Korea Continuous Manufacturing Industry Revenue (Million) Forecast, by Application 2019 & 2032
- Table 58: Rest of Asia Pacific Continuous Manufacturing Industry Revenue (Million) Forecast, by Application 2019 & 2032
- Table 59: Global Continuous Manufacturing Industry Revenue Million Forecast, by Product 2019 & 2032
- Table 60: Global Continuous Manufacturing Industry Revenue Million Forecast, by Application 2019 & 2032
- Table 61: Global Continuous Manufacturing Industry Revenue Million Forecast, by End User 2019 & 2032
- Table 62: Global Continuous Manufacturing Industry Revenue Million Forecast, by Country 2019 & 2032
- Table 63: GCC Continuous Manufacturing Industry Revenue (Million) Forecast, by Application 2019 & 2032
- Table 64: South Africa Continuous Manufacturing Industry Revenue (Million) Forecast, by Application 2019 & 2032
- Table 65: Rest of Middle East and Africa Continuous Manufacturing Industry Revenue (Million) Forecast, by Application 2019 & 2032
- Table 66: Global Continuous Manufacturing Industry Revenue Million Forecast, by Product 2019 & 2032
- Table 67: Global Continuous Manufacturing Industry Revenue Million Forecast, by Application 2019 & 2032
- Table 68: Global Continuous Manufacturing Industry Revenue Million Forecast, by End User 2019 & 2032
- Table 69: Global Continuous Manufacturing Industry Revenue Million Forecast, by Country 2019 & 2032
- Table 70: Brazil Continuous Manufacturing Industry Revenue (Million) Forecast, by Application 2019 & 2032
- Table 71: Argentina Continuous Manufacturing Industry Revenue (Million) Forecast, by Application 2019 & 2032
- Table 72: Rest of South America Continuous Manufacturing Industry Revenue (Million) Forecast, by Application 2019 & 2032
Frequently Asked Questions
1. What is the projected Compound Annual Growth Rate (CAGR) of the Continuous Manufacturing Industry?
The projected CAGR is approximately 12.80%.
2. Which companies are prominent players in the Continuous Manufacturing Industry?
Key companies in the market include Coperion GmbH, Scott Equipment Company, Siemens Healthineers, Munson Machinery Co Inc, Sturtevant Inc, GEA Group AG, L B Bohle, Robert Bosch GmbH, Glatt GmbH, Thermo Fisher Scientific, HOSOKAWA MICRON CORP.
3. What are the main segments of the Continuous Manufacturing Industry?
The market segments include Product, Application, End User.
4. Can you provide details about the market size?
The market size is estimated to be USD XX Million as of 2022.
5. What are some drivers contributing to market growth?
Less Cost and Better Quality of Production; Support from Regulatory Authorities Around the World.
6. What are the notable trends driving market growth?
Integrated Continuous Manufacturing is Projected to Grow at Significant Rate Over the Forecast Period.
7. Are there any restraints impacting market growth?
Lack of Regulatory and Technical Clarity; Slow adaptation and Rigidity Among the Industries.
8. Can you provide examples of recent developments in the market?
In March 2022, Phlow Corp, a United States essential medicines public benefit company entered alliances with both Virginia Commonwealth University (VCU) Medicines for All institute and AMPAC fine chemicals to provide contract continuous manufacturing research and development services for small molecule pharmaceutical products.
9. What pricing options are available for accessing the report?
Pricing options include single-user, multi-user, and enterprise licenses priced at USD 4750, USD 5250, and USD 8750 respectively.
10. Is the market size provided in terms of value or volume?
The market size is provided in terms of value, measured in Million.
11. Are there any specific market keywords associated with the report?
Yes, the market keyword associated with the report is "Continuous Manufacturing Industry," which aids in identifying and referencing the specific market segment covered.
12. How do I determine which pricing option suits my needs best?
The pricing options vary based on user requirements and access needs. Individual users may opt for single-user licenses, while businesses requiring broader access may choose multi-user or enterprise licenses for cost-effective access to the report.
13. Are there any additional resources or data provided in the Continuous Manufacturing Industry report?
While the report offers comprehensive insights, it's advisable to review the specific contents or supplementary materials provided to ascertain if additional resources or data are available.
14. How can I stay updated on further developments or reports in the Continuous Manufacturing Industry?
To stay informed about further developments, trends, and reports in the Continuous Manufacturing Industry, consider subscribing to industry newsletters, following relevant companies and organizations, or regularly checking reputable industry news sources and publications.
Methodology
Step 1 - Identification of Relevant Samples Size from Population Database


Step 2 - Approaches for Defining Global Market Size (Value, Volume* & Price*)

Note*: In applicable scenarios
Step 3 - Data Sources
Primary Research
- Web Analytics
- Survey Reports
- Research Institute
- Latest Research Reports
- Opinion Leaders
Secondary Research
- Annual Reports
- White Paper
- Latest Press Release
- Industry Association
- Paid Database
- Investor Presentations

Step 4 - Data Triangulation
Involves using different sources of information in order to increase the validity of a study
These sources are likely to be stakeholders in a program - participants, other researchers, program staff, other community members, and so on.
Then we put all data in single framework & apply various statistical tools to find out the dynamic on the market.
During the analysis stage, feedback from the stakeholder groups would be compared to determine areas of agreement as well as areas of divergence
