

Key Insights
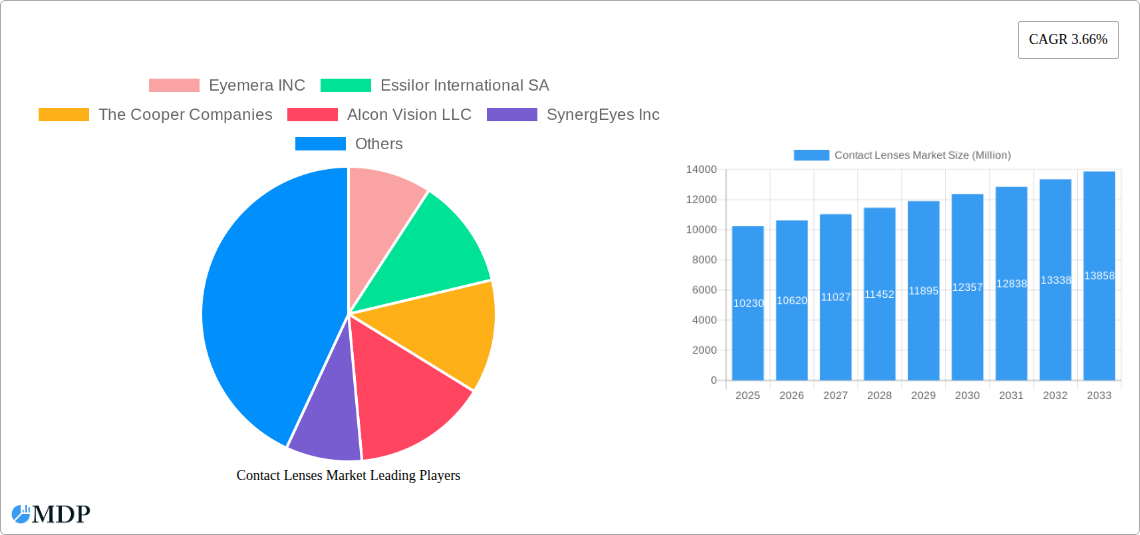
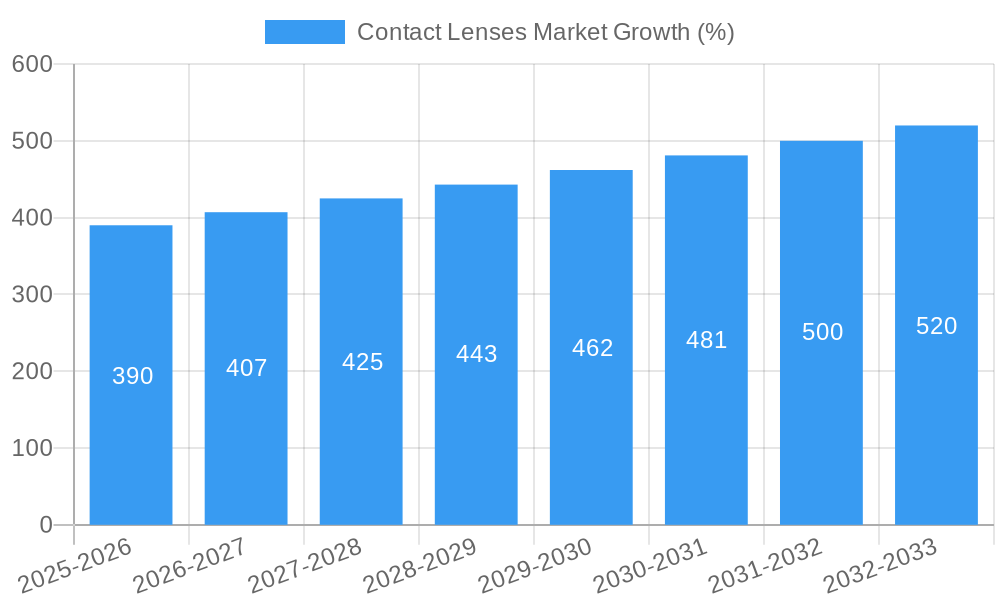
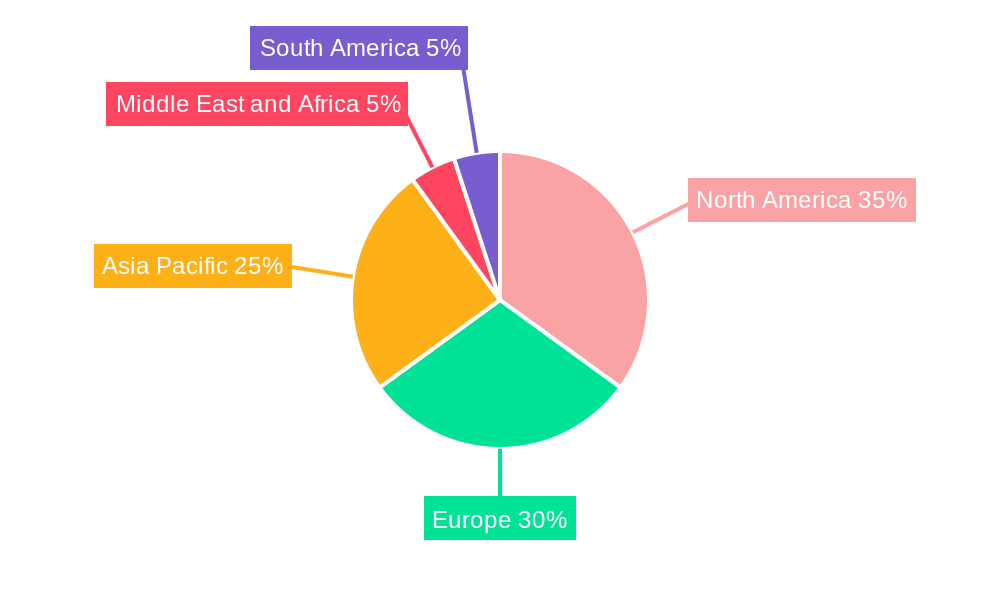
The global contact lenses market, valued at $10.23 billion in 2025, is projected to experience steady growth, driven by increasing myopia prevalence, rising disposable income, and advancements in lens technology. The Compound Annual Growth Rate (CAGR) of 3.66% from 2025 to 2033 indicates a substantial market expansion, exceeding $14 billion by the end of the forecast period. Key growth drivers include the increasing adoption of disposable contact lenses due to convenience and hygiene, along with the rising demand for specialized lenses such as multifocal and toric lenses catering to presbyopia and astigmatism, respectively. The market is segmented by usage (corrective, therapeutic, cosmetic, prosthetic), modality (conventional, disposable), design (spherical, toric, multifocal), and product type (soft, hybrid, rigid gas permeable). The soft contact lens segment currently dominates, propelled by comfort and ease of use, but rigid gas permeable (RGP) lenses are witnessing growth due to their superior oxygen permeability and suitability for specific eye conditions. Technological advancements such as silicone hydrogel lenses with enhanced oxygen transmissibility and smart lenses with integrated functionalities are further fueling market expansion. Geographic analysis reveals strong market presence in North America and Europe, driven by high awareness and disposable incomes. However, Asia Pacific shows significant growth potential, given its large and rapidly growing population base. Competition in the market is fierce, with established players such as Johnson & Johnson Vision Care, Alcon, Essilor, and CooperVision leading the way while smaller niche players focusing on specialized lenses are also gaining traction.
The market faces challenges including potential risks associated with contact lens use, stringent regulatory frameworks, and the high cost of advanced lens technologies. Nevertheless, the ongoing research and development efforts in improving lens materials, designs, and manufacturing processes are expected to overcome these challenges and sustain market growth. The increasing prevalence of vision correction needs in younger populations, coupled with rising awareness of contact lens benefits and the availability of wider product choices, contribute to a positive outlook for the contact lenses market over the next decade. Furthermore, the growing preference for minimally invasive vision correction methods over traditional eyeglasses contributes to the ongoing market expansion. Strategic partnerships, collaborations, and product innovations by key players will continue to shape market dynamics and competitive landscape in the coming years.
Contact Lenses Market: A Comprehensive Report (2019-2033)
This in-depth report provides a comprehensive analysis of the global Contact Lenses Market, offering invaluable insights for industry stakeholders, investors, and strategic decision-makers. Covering the period from 2019 to 2033, with a focus on 2025, this report meticulously examines market dynamics, trends, leading players, and future growth opportunities within the multi-billion dollar contact lens sector. The report leverages extensive market research and data analysis to present a detailed overview of the market's current state and future trajectory. Expect precise figures and actionable recommendations to navigate this rapidly evolving landscape.
Contact Lenses Market Market Dynamics & Concentration
The global contact lenses market, valued at xx Million in 2025, is characterized by a moderately concentrated landscape with a few dominant players and several smaller, niche players. Market concentration is influenced by factors such as brand recognition, research and development capabilities, and global distribution networks. Innovation, particularly in materials science and lens design, is a key driver, pushing the boundaries of comfort, vision correction, and health benefits. Stringent regulatory frameworks regarding safety and efficacy significantly impact market access and product development. The market also witnesses continuous innovation in materials (like silicone hydrogel), lens designs (multifocal, toric), and dispensing methods (online platforms). Substitutes, primarily eyeglasses, compete for market share, while trends such as increased disposable lens preference and rising awareness of eye health drive demand. M&A activity has been moderate, with xx major deals recorded between 2019 and 2024, primarily focused on strengthening market position and expanding product portfolios. Major players are continually engaging in strategic partnerships to expand their reach and distribution networks.
- Market Share: Top 5 players hold approximately xx% of the market share.
- M&A Activity: xx major mergers and acquisitions between 2019 and 2024.
- Innovation Drivers: Silicone hydrogel technology, advanced lens designs, and personalized lens options.
- Regulatory Landscape: Stringent FDA and other global regulations governing contact lens manufacturing and distribution.
Contact Lenses Market Industry Trends & Analysis
The Contact Lenses Market is experiencing robust growth, projected to achieve a CAGR of xx% during the forecast period (2025-2033). Several key factors contribute to this expansion. The rising prevalence of refractive errors globally, coupled with increasing disposable income and consumer preference for convenience, drives significant demand for contact lenses. Technological advancements such as improved materials, designs (multifocal and toric lenses for astigmatism and presbyopia) and improved lens hygiene solutions are expanding the addressable market. The growing popularity of online contact lens sales channels further facilitates market accessibility and penetration. Furthermore, the increasing awareness of eye health and the desire for improved vision correction fuels market growth. However, competitive pressure from established players and the entry of new entrants continually shapes market dynamics. The market penetration of disposable contact lenses, particularly daily disposables, is significantly increasing, as they offer convenience and hygiene advantages.
Leading Markets & Segments in Contact Lenses Market
North America currently holds the largest market share, driven by high healthcare expenditure, advanced technological adoption, and strong consumer preference for contact lenses. Within product segments, Corrective Contact Lenses dominate, representing approximately xx% of the market in 2025. Disposable modality accounts for the largest share of the market owing to its convenience, hygiene and affordability. Spherical contact lenses currently hold the highest share in the design segment but the toric and multifocal segments are witnessing substantial growth. Soft Contact Lenses maintain the largest share within the product type segment due to their comfort and ease of use.
- Key Drivers for North America: High disposable incomes, technologically advanced healthcare infrastructure, and strong brand presence.
- Corrective Contact Lenses: High prevalence of refractive errors and increasing awareness of vision correction options.
- Disposable Modality: Convenience, hygiene, and reduced risk of infection.
- Soft Contact Lenses: Superior comfort and ease of use compared to rigid lenses.
Contact Lenses Market Product Developments
The contact lens market is witnessing rapid innovation, with a focus on enhanced material properties, improved lens designs, and more sophisticated manufacturing processes. Recent advancements include the development of silicone hydrogel lenses that offer superior oxygen permeability for improved eye health. Moreover, manufacturers are focusing on developing lenses with advanced features, such as UV protection and toric designs for astigmatism correction. The introduction of daily disposable lenses has revolutionized the market by offering greater convenience and improved hygiene. These innovations are addressing unmet clinical needs and expanding the market towards higher comfort and better eye health outcomes.
Key Drivers of Contact Lenses Market Growth
Technological advancements in lens materials and designs are paramount drivers of market growth. The increasing prevalence of refractive errors globally, particularly myopia and hyperopia, creates consistent demand. The rising disposable incomes in emerging economies, facilitating higher healthcare spending, and the growing adoption of online platforms for lens sales contribute significantly. Favorable regulatory landscapes in several countries also expedite market entry and expansion. Additionally, increased awareness of eye health and the desire for improved visual acuity propel market expansion.
Challenges in the Contact Lenses Market Market
The contact lenses market faces challenges, including stringent regulatory hurdles for new product approvals, leading to longer time-to-market. Supply chain disruptions, particularly concerning raw materials, influence production costs and availability. Intense competition among established players requires constant innovation and robust marketing efforts to maintain market share. Moreover, pricing pressures and the potential for counterfeiting pose considerable risks. The fluctuations in raw material prices add to the cost pressures on the market.
Emerging Opportunities in Contact Lenses Market
The contact lens market presents lucrative opportunities through advancements in personalized lens designs, utilizing big data and AI for customized vision correction. Strategic partnerships between lens manufacturers and eye care professionals can expand access to advanced technologies. Penetration into untapped markets, particularly in emerging economies, holds significant growth potential. Further development of innovative lens materials focusing on enhanced biocompatibility and longer-lasting comfort will shape the future of this sector.
Leading Players in the Contact Lenses Market Sector
- Eyemera INC
- Essilor International SA
- The Cooper Companies
- Alcon Vision LLC
- SynergEyes Inc
- Menicon Co Ltd
- Zeiss Group
- Johnson & Johnson Vision Care Inc
- Seed Co Ltd
- Bausch Health Companies Inc
- Hoya Corporation
Key Milestones in Contact Lenses Market Industry
- June 2022: Johnson & Johnson Vision received FDA clearance for ACUVUE OASYS MAX 1-Day and ACUVUE OASYS MAX 1-Day MULTIFOCAL, expanding its product portfolio in the daily disposable segment.
- April 2022: Alcon launched Precision, a daily disposable silicone hydrogel contact lens for astigmatism in Canada, addressing a significant unmet need within the astigmatism correction market.
Strategic Outlook for Contact Lenses Market Market
The future of the contact lenses market appears bright, driven by ongoing innovation and a growing demand for vision correction solutions. Strategic partnerships, focused research and development, and expansion into new geographic markets are expected to accelerate growth. Companies are focusing on personalized medicine approaches to cater to individual patient needs. The integration of digital technologies and telemedicine will enhance market accessibility and create novel business models. The overall market outlook suggests significant growth potential and attractive opportunities for existing and new players.
Contact Lenses Market Segmentation
-
1. Product Type
- 1.1. Soft Contact Lenses
- 1.2. Hybrid Contact Lenses
- 1.3. Rigid Gas Permeable Contact Lenses
- 1.4. Other Product Types
-
2. Usage
- 2.1. Corrective Contact Lenses
- 2.2. Therapeutic Contact Lenses
- 2.3. Cosmetic Contact Lenses
- 2.4. Prosthetic Contact Lenses
-
3. Modality
- 3.1. Conventional
- 3.2. Disposable
-
4. Design
- 4.1. Spherical
- 4.2. Toric
- 4.3. Multifocal
- 4.4. Other Designs
Contact Lenses Market Segmentation By Geography
-
1. North America
- 1.1. United States
- 1.2. Canada
- 1.3. Mexico
-
2. Europe
- 2.1. United Kingdom
- 2.2. Germany
- 2.3. France
- 2.4. Italy
- 2.5. Spain
- 2.6. Rest of Europe
-
3. Asia Pacific
- 3.1. China
- 3.2. Japan
- 3.3. India
- 3.4. Australia
- 3.5. South Korea
- 3.6. Rest of Asia Pacific
-
4. Middle East and Africa
- 4.1. GCC
- 4.2. South Africa
- 4.3. Rest of Middle East and Africa
-
5. South America
- 5.1. Brazil
- 5.2. Argentina
- 5.3. Rest of South America
Contact Lenses Market REPORT HIGHLIGHTS
| Aspects | Details |
|---|---|
| Study Period | 2019-2033 |
| Base Year | 2024 |
| Estimated Year | 2025 |
| Forecast Period | 2025-2033 |
| Historical Period | 2019-2024 |
| Growth Rate | CAGR of 3.66% from 2019-2033 |
| Segmentation |
|
Table of Contents
- 1. Introduction
- 1.1. Research Scope
- 1.2. Market Segmentation
- 1.3. Research Methodology
- 1.4. Definitions and Assumptions
- 2. Executive Summary
- 2.1. Introduction
- 3. Market Dynamics
- 3.1. Introduction
- 3.2. Market Drivers
- 3.2.1. Increasing Burden of Optical Disorders; Increasing Tendency to Enhance Aesthetics
- 3.3. Market Restrains
- 3.3.1. Availability of Alternative Techniques and Complications Associated with Lenses4.3.2
- 3.4. Market Trends
- 3.4.1. Corrective Contact Lenses are Expected to Register a Significant Growth Rate over the Forecast Period
- 4. Market Factor Analysis
- 4.1. Porters Five Forces
- 4.2. Supply/Value Chain
- 4.3. PESTEL analysis
- 4.4. Market Entropy
- 4.5. Patent/Trademark Analysis
- 5. Global Contact Lenses Market Analysis, Insights and Forecast, 2019-2031
- 5.1. Market Analysis, Insights and Forecast - by Product Type
- 5.1.1. Soft Contact Lenses
- 5.1.2. Hybrid Contact Lenses
- 5.1.3. Rigid Gas Permeable Contact Lenses
- 5.1.4. Other Product Types
- 5.2. Market Analysis, Insights and Forecast - by Usage
- 5.2.1. Corrective Contact Lenses
- 5.2.2. Therapeutic Contact Lenses
- 5.2.3. Cosmetic Contact Lenses
- 5.2.4. Prosthetic Contact Lenses
- 5.3. Market Analysis, Insights and Forecast - by Modality
- 5.3.1. Conventional
- 5.3.2. Disposable
- 5.4. Market Analysis, Insights and Forecast - by Design
- 5.4.1. Spherical
- 5.4.2. Toric
- 5.4.3. Multifocal
- 5.4.4. Other Designs
- 5.5. Market Analysis, Insights and Forecast - by Region
- 5.5.1. North America
- 5.5.2. Europe
- 5.5.3. Asia Pacific
- 5.5.4. Middle East and Africa
- 5.5.5. South America
- 5.1. Market Analysis, Insights and Forecast - by Product Type
- 6. North America Contact Lenses Market Analysis, Insights and Forecast, 2019-2031
- 6.1. Market Analysis, Insights and Forecast - by Product Type
- 6.1.1. Soft Contact Lenses
- 6.1.2. Hybrid Contact Lenses
- 6.1.3. Rigid Gas Permeable Contact Lenses
- 6.1.4. Other Product Types
- 6.2. Market Analysis, Insights and Forecast - by Usage
- 6.2.1. Corrective Contact Lenses
- 6.2.2. Therapeutic Contact Lenses
- 6.2.3. Cosmetic Contact Lenses
- 6.2.4. Prosthetic Contact Lenses
- 6.3. Market Analysis, Insights and Forecast - by Modality
- 6.3.1. Conventional
- 6.3.2. Disposable
- 6.4. Market Analysis, Insights and Forecast - by Design
- 6.4.1. Spherical
- 6.4.2. Toric
- 6.4.3. Multifocal
- 6.4.4. Other Designs
- 6.1. Market Analysis, Insights and Forecast - by Product Type
- 7. Europe Contact Lenses Market Analysis, Insights and Forecast, 2019-2031
- 7.1. Market Analysis, Insights and Forecast - by Product Type
- 7.1.1. Soft Contact Lenses
- 7.1.2. Hybrid Contact Lenses
- 7.1.3. Rigid Gas Permeable Contact Lenses
- 7.1.4. Other Product Types
- 7.2. Market Analysis, Insights and Forecast - by Usage
- 7.2.1. Corrective Contact Lenses
- 7.2.2. Therapeutic Contact Lenses
- 7.2.3. Cosmetic Contact Lenses
- 7.2.4. Prosthetic Contact Lenses
- 7.3. Market Analysis, Insights and Forecast - by Modality
- 7.3.1. Conventional
- 7.3.2. Disposable
- 7.4. Market Analysis, Insights and Forecast - by Design
- 7.4.1. Spherical
- 7.4.2. Toric
- 7.4.3. Multifocal
- 7.4.4. Other Designs
- 7.1. Market Analysis, Insights and Forecast - by Product Type
- 8. Asia Pacific Contact Lenses Market Analysis, Insights and Forecast, 2019-2031
- 8.1. Market Analysis, Insights and Forecast - by Product Type
- 8.1.1. Soft Contact Lenses
- 8.1.2. Hybrid Contact Lenses
- 8.1.3. Rigid Gas Permeable Contact Lenses
- 8.1.4. Other Product Types
- 8.2. Market Analysis, Insights and Forecast - by Usage
- 8.2.1. Corrective Contact Lenses
- 8.2.2. Therapeutic Contact Lenses
- 8.2.3. Cosmetic Contact Lenses
- 8.2.4. Prosthetic Contact Lenses
- 8.3. Market Analysis, Insights and Forecast - by Modality
- 8.3.1. Conventional
- 8.3.2. Disposable
- 8.4. Market Analysis, Insights and Forecast - by Design
- 8.4.1. Spherical
- 8.4.2. Toric
- 8.4.3. Multifocal
- 8.4.4. Other Designs
- 8.1. Market Analysis, Insights and Forecast - by Product Type
- 9. Middle East and Africa Contact Lenses Market Analysis, Insights and Forecast, 2019-2031
- 9.1. Market Analysis, Insights and Forecast - by Product Type
- 9.1.1. Soft Contact Lenses
- 9.1.2. Hybrid Contact Lenses
- 9.1.3. Rigid Gas Permeable Contact Lenses
- 9.1.4. Other Product Types
- 9.2. Market Analysis, Insights and Forecast - by Usage
- 9.2.1. Corrective Contact Lenses
- 9.2.2. Therapeutic Contact Lenses
- 9.2.3. Cosmetic Contact Lenses
- 9.2.4. Prosthetic Contact Lenses
- 9.3. Market Analysis, Insights and Forecast - by Modality
- 9.3.1. Conventional
- 9.3.2. Disposable
- 9.4. Market Analysis, Insights and Forecast - by Design
- 9.4.1. Spherical
- 9.4.2. Toric
- 9.4.3. Multifocal
- 9.4.4. Other Designs
- 9.1. Market Analysis, Insights and Forecast - by Product Type
- 10. South America Contact Lenses Market Analysis, Insights and Forecast, 2019-2031
- 10.1. Market Analysis, Insights and Forecast - by Product Type
- 10.1.1. Soft Contact Lenses
- 10.1.2. Hybrid Contact Lenses
- 10.1.3. Rigid Gas Permeable Contact Lenses
- 10.1.4. Other Product Types
- 10.2. Market Analysis, Insights and Forecast - by Usage
- 10.2.1. Corrective Contact Lenses
- 10.2.2. Therapeutic Contact Lenses
- 10.2.3. Cosmetic Contact Lenses
- 10.2.4. Prosthetic Contact Lenses
- 10.3. Market Analysis, Insights and Forecast - by Modality
- 10.3.1. Conventional
- 10.3.2. Disposable
- 10.4. Market Analysis, Insights and Forecast - by Design
- 10.4.1. Spherical
- 10.4.2. Toric
- 10.4.3. Multifocal
- 10.4.4. Other Designs
- 10.1. Market Analysis, Insights and Forecast - by Product Type
- 11. North America Contact Lenses Market Analysis, Insights and Forecast, 2019-2031
- 11.1. Market Analysis, Insights and Forecast - By Country/Sub-region
- 11.1.1 United States
- 11.1.2 Canada
- 11.1.3 Mexico
- 12. Europe Contact Lenses Market Analysis, Insights and Forecast, 2019-2031
- 12.1. Market Analysis, Insights and Forecast - By Country/Sub-region
- 12.1.1 United Kingdom
- 12.1.2 Germany
- 12.1.3 France
- 12.1.4 Italy
- 12.1.5 Spain
- 12.1.6 Rest of Europe
- 13. Asia Pacific Contact Lenses Market Analysis, Insights and Forecast, 2019-2031
- 13.1. Market Analysis, Insights and Forecast - By Country/Sub-region
- 13.1.1 China
- 13.1.2 Japan
- 13.1.3 India
- 13.1.4 Australia
- 13.1.5 South Korea
- 13.1.6 Rest of Asia Pacific
- 14. Middle East and Africa Contact Lenses Market Analysis, Insights and Forecast, 2019-2031
- 14.1. Market Analysis, Insights and Forecast - By Country/Sub-region
- 14.1.1 GCC
- 14.1.2 South Africa
- 14.1.3 Rest of Middle East and Africa
- 15. South America Contact Lenses Market Analysis, Insights and Forecast, 2019-2031
- 15.1. Market Analysis, Insights and Forecast - By Country/Sub-region
- 15.1.1 Brazil
- 15.1.2 Argentina
- 15.1.3 Rest of South America
- 16. Competitive Analysis
- 16.1. Global Market Share Analysis 2024
- 16.2. Company Profiles
- 16.2.1 Eyemera INC
- 16.2.1.1. Overview
- 16.2.1.2. Products
- 16.2.1.3. SWOT Analysis
- 16.2.1.4. Recent Developments
- 16.2.1.5. Financials (Based on Availability)
- 16.2.2 Essilor International SA
- 16.2.2.1. Overview
- 16.2.2.2. Products
- 16.2.2.3. SWOT Analysis
- 16.2.2.4. Recent Developments
- 16.2.2.5. Financials (Based on Availability)
- 16.2.3 The Cooper Companies
- 16.2.3.1. Overview
- 16.2.3.2. Products
- 16.2.3.3. SWOT Analysis
- 16.2.3.4. Recent Developments
- 16.2.3.5. Financials (Based on Availability)
- 16.2.4 Alcon Vision LLC
- 16.2.4.1. Overview
- 16.2.4.2. Products
- 16.2.4.3. SWOT Analysis
- 16.2.4.4. Recent Developments
- 16.2.4.5. Financials (Based on Availability)
- 16.2.5 SynergEyes Inc
- 16.2.5.1. Overview
- 16.2.5.2. Products
- 16.2.5.3. SWOT Analysis
- 16.2.5.4. Recent Developments
- 16.2.5.5. Financials (Based on Availability)
- 16.2.6 Menicon Co Ltd
- 16.2.6.1. Overview
- 16.2.6.2. Products
- 16.2.6.3. SWOT Analysis
- 16.2.6.4. Recent Developments
- 16.2.6.5. Financials (Based on Availability)
- 16.2.7 Zeiss Group
- 16.2.7.1. Overview
- 16.2.7.2. Products
- 16.2.7.3. SWOT Analysis
- 16.2.7.4. Recent Developments
- 16.2.7.5. Financials (Based on Availability)
- 16.2.8 Johnson & Johnson Vision Care Inc
- 16.2.8.1. Overview
- 16.2.8.2. Products
- 16.2.8.3. SWOT Analysis
- 16.2.8.4. Recent Developments
- 16.2.8.5. Financials (Based on Availability)
- 16.2.9 Seed Co Ltd
- 16.2.9.1. Overview
- 16.2.9.2. Products
- 16.2.9.3. SWOT Analysis
- 16.2.9.4. Recent Developments
- 16.2.9.5. Financials (Based on Availability)
- 16.2.10 Bausch Health Companies Inc
- 16.2.10.1. Overview
- 16.2.10.2. Products
- 16.2.10.3. SWOT Analysis
- 16.2.10.4. Recent Developments
- 16.2.10.5. Financials (Based on Availability)
- 16.2.11 Hoya Corporation
- 16.2.11.1. Overview
- 16.2.11.2. Products
- 16.2.11.3. SWOT Analysis
- 16.2.11.4. Recent Developments
- 16.2.11.5. Financials (Based on Availability)
- 16.2.1 Eyemera INC
List of Figures
- Figure 1: Global Contact Lenses Market Revenue Breakdown (Million, %) by Region 2024 & 2032
- Figure 2: Global Contact Lenses Market Volume Breakdown (K Unit, %) by Region 2024 & 2032
- Figure 3: North America Contact Lenses Market Revenue (Million), by Country 2024 & 2032
- Figure 4: North America Contact Lenses Market Volume (K Unit), by Country 2024 & 2032
- Figure 5: North America Contact Lenses Market Revenue Share (%), by Country 2024 & 2032
- Figure 6: North America Contact Lenses Market Volume Share (%), by Country 2024 & 2032
- Figure 7: Europe Contact Lenses Market Revenue (Million), by Country 2024 & 2032
- Figure 8: Europe Contact Lenses Market Volume (K Unit), by Country 2024 & 2032
- Figure 9: Europe Contact Lenses Market Revenue Share (%), by Country 2024 & 2032
- Figure 10: Europe Contact Lenses Market Volume Share (%), by Country 2024 & 2032
- Figure 11: Asia Pacific Contact Lenses Market Revenue (Million), by Country 2024 & 2032
- Figure 12: Asia Pacific Contact Lenses Market Volume (K Unit), by Country 2024 & 2032
- Figure 13: Asia Pacific Contact Lenses Market Revenue Share (%), by Country 2024 & 2032
- Figure 14: Asia Pacific Contact Lenses Market Volume Share (%), by Country 2024 & 2032
- Figure 15: Middle East and Africa Contact Lenses Market Revenue (Million), by Country 2024 & 2032
- Figure 16: Middle East and Africa Contact Lenses Market Volume (K Unit), by Country 2024 & 2032
- Figure 17: Middle East and Africa Contact Lenses Market Revenue Share (%), by Country 2024 & 2032
- Figure 18: Middle East and Africa Contact Lenses Market Volume Share (%), by Country 2024 & 2032
- Figure 19: South America Contact Lenses Market Revenue (Million), by Country 2024 & 2032
- Figure 20: South America Contact Lenses Market Volume (K Unit), by Country 2024 & 2032
- Figure 21: South America Contact Lenses Market Revenue Share (%), by Country 2024 & 2032
- Figure 22: South America Contact Lenses Market Volume Share (%), by Country 2024 & 2032
- Figure 23: North America Contact Lenses Market Revenue (Million), by Product Type 2024 & 2032
- Figure 24: North America Contact Lenses Market Volume (K Unit), by Product Type 2024 & 2032
- Figure 25: North America Contact Lenses Market Revenue Share (%), by Product Type 2024 & 2032
- Figure 26: North America Contact Lenses Market Volume Share (%), by Product Type 2024 & 2032
- Figure 27: North America Contact Lenses Market Revenue (Million), by Usage 2024 & 2032
- Figure 28: North America Contact Lenses Market Volume (K Unit), by Usage 2024 & 2032
- Figure 29: North America Contact Lenses Market Revenue Share (%), by Usage 2024 & 2032
- Figure 30: North America Contact Lenses Market Volume Share (%), by Usage 2024 & 2032
- Figure 31: North America Contact Lenses Market Revenue (Million), by Modality 2024 & 2032
- Figure 32: North America Contact Lenses Market Volume (K Unit), by Modality 2024 & 2032
- Figure 33: North America Contact Lenses Market Revenue Share (%), by Modality 2024 & 2032
- Figure 34: North America Contact Lenses Market Volume Share (%), by Modality 2024 & 2032
- Figure 35: North America Contact Lenses Market Revenue (Million), by Design 2024 & 2032
- Figure 36: North America Contact Lenses Market Volume (K Unit), by Design 2024 & 2032
- Figure 37: North America Contact Lenses Market Revenue Share (%), by Design 2024 & 2032
- Figure 38: North America Contact Lenses Market Volume Share (%), by Design 2024 & 2032
- Figure 39: North America Contact Lenses Market Revenue (Million), by Country 2024 & 2032
- Figure 40: North America Contact Lenses Market Volume (K Unit), by Country 2024 & 2032
- Figure 41: North America Contact Lenses Market Revenue Share (%), by Country 2024 & 2032
- Figure 42: North America Contact Lenses Market Volume Share (%), by Country 2024 & 2032
- Figure 43: Europe Contact Lenses Market Revenue (Million), by Product Type 2024 & 2032
- Figure 44: Europe Contact Lenses Market Volume (K Unit), by Product Type 2024 & 2032
- Figure 45: Europe Contact Lenses Market Revenue Share (%), by Product Type 2024 & 2032
- Figure 46: Europe Contact Lenses Market Volume Share (%), by Product Type 2024 & 2032
- Figure 47: Europe Contact Lenses Market Revenue (Million), by Usage 2024 & 2032
- Figure 48: Europe Contact Lenses Market Volume (K Unit), by Usage 2024 & 2032
- Figure 49: Europe Contact Lenses Market Revenue Share (%), by Usage 2024 & 2032
- Figure 50: Europe Contact Lenses Market Volume Share (%), by Usage 2024 & 2032
- Figure 51: Europe Contact Lenses Market Revenue (Million), by Modality 2024 & 2032
- Figure 52: Europe Contact Lenses Market Volume (K Unit), by Modality 2024 & 2032
- Figure 53: Europe Contact Lenses Market Revenue Share (%), by Modality 2024 & 2032
- Figure 54: Europe Contact Lenses Market Volume Share (%), by Modality 2024 & 2032
- Figure 55: Europe Contact Lenses Market Revenue (Million), by Design 2024 & 2032
- Figure 56: Europe Contact Lenses Market Volume (K Unit), by Design 2024 & 2032
- Figure 57: Europe Contact Lenses Market Revenue Share (%), by Design 2024 & 2032
- Figure 58: Europe Contact Lenses Market Volume Share (%), by Design 2024 & 2032
- Figure 59: Europe Contact Lenses Market Revenue (Million), by Country 2024 & 2032
- Figure 60: Europe Contact Lenses Market Volume (K Unit), by Country 2024 & 2032
- Figure 61: Europe Contact Lenses Market Revenue Share (%), by Country 2024 & 2032
- Figure 62: Europe Contact Lenses Market Volume Share (%), by Country 2024 & 2032
- Figure 63: Asia Pacific Contact Lenses Market Revenue (Million), by Product Type 2024 & 2032
- Figure 64: Asia Pacific Contact Lenses Market Volume (K Unit), by Product Type 2024 & 2032
- Figure 65: Asia Pacific Contact Lenses Market Revenue Share (%), by Product Type 2024 & 2032
- Figure 66: Asia Pacific Contact Lenses Market Volume Share (%), by Product Type 2024 & 2032
- Figure 67: Asia Pacific Contact Lenses Market Revenue (Million), by Usage 2024 & 2032
- Figure 68: Asia Pacific Contact Lenses Market Volume (K Unit), by Usage 2024 & 2032
- Figure 69: Asia Pacific Contact Lenses Market Revenue Share (%), by Usage 2024 & 2032
- Figure 70: Asia Pacific Contact Lenses Market Volume Share (%), by Usage 2024 & 2032
- Figure 71: Asia Pacific Contact Lenses Market Revenue (Million), by Modality 2024 & 2032
- Figure 72: Asia Pacific Contact Lenses Market Volume (K Unit), by Modality 2024 & 2032
- Figure 73: Asia Pacific Contact Lenses Market Revenue Share (%), by Modality 2024 & 2032
- Figure 74: Asia Pacific Contact Lenses Market Volume Share (%), by Modality 2024 & 2032
- Figure 75: Asia Pacific Contact Lenses Market Revenue (Million), by Design 2024 & 2032
- Figure 76: Asia Pacific Contact Lenses Market Volume (K Unit), by Design 2024 & 2032
- Figure 77: Asia Pacific Contact Lenses Market Revenue Share (%), by Design 2024 & 2032
- Figure 78: Asia Pacific Contact Lenses Market Volume Share (%), by Design 2024 & 2032
- Figure 79: Asia Pacific Contact Lenses Market Revenue (Million), by Country 2024 & 2032
- Figure 80: Asia Pacific Contact Lenses Market Volume (K Unit), by Country 2024 & 2032
- Figure 81: Asia Pacific Contact Lenses Market Revenue Share (%), by Country 2024 & 2032
- Figure 82: Asia Pacific Contact Lenses Market Volume Share (%), by Country 2024 & 2032
- Figure 83: Middle East and Africa Contact Lenses Market Revenue (Million), by Product Type 2024 & 2032
- Figure 84: Middle East and Africa Contact Lenses Market Volume (K Unit), by Product Type 2024 & 2032
- Figure 85: Middle East and Africa Contact Lenses Market Revenue Share (%), by Product Type 2024 & 2032
- Figure 86: Middle East and Africa Contact Lenses Market Volume Share (%), by Product Type 2024 & 2032
- Figure 87: Middle East and Africa Contact Lenses Market Revenue (Million), by Usage 2024 & 2032
- Figure 88: Middle East and Africa Contact Lenses Market Volume (K Unit), by Usage 2024 & 2032
- Figure 89: Middle East and Africa Contact Lenses Market Revenue Share (%), by Usage 2024 & 2032
- Figure 90: Middle East and Africa Contact Lenses Market Volume Share (%), by Usage 2024 & 2032
- Figure 91: Middle East and Africa Contact Lenses Market Revenue (Million), by Modality 2024 & 2032
- Figure 92: Middle East and Africa Contact Lenses Market Volume (K Unit), by Modality 2024 & 2032
- Figure 93: Middle East and Africa Contact Lenses Market Revenue Share (%), by Modality 2024 & 2032
- Figure 94: Middle East and Africa Contact Lenses Market Volume Share (%), by Modality 2024 & 2032
- Figure 95: Middle East and Africa Contact Lenses Market Revenue (Million), by Design 2024 & 2032
- Figure 96: Middle East and Africa Contact Lenses Market Volume (K Unit), by Design 2024 & 2032
- Figure 97: Middle East and Africa Contact Lenses Market Revenue Share (%), by Design 2024 & 2032
- Figure 98: Middle East and Africa Contact Lenses Market Volume Share (%), by Design 2024 & 2032
- Figure 99: Middle East and Africa Contact Lenses Market Revenue (Million), by Country 2024 & 2032
- Figure 100: Middle East and Africa Contact Lenses Market Volume (K Unit), by Country 2024 & 2032
- Figure 101: Middle East and Africa Contact Lenses Market Revenue Share (%), by Country 2024 & 2032
- Figure 102: Middle East and Africa Contact Lenses Market Volume Share (%), by Country 2024 & 2032
- Figure 103: South America Contact Lenses Market Revenue (Million), by Product Type 2024 & 2032
- Figure 104: South America Contact Lenses Market Volume (K Unit), by Product Type 2024 & 2032
- Figure 105: South America Contact Lenses Market Revenue Share (%), by Product Type 2024 & 2032
- Figure 106: South America Contact Lenses Market Volume Share (%), by Product Type 2024 & 2032
- Figure 107: South America Contact Lenses Market Revenue (Million), by Usage 2024 & 2032
- Figure 108: South America Contact Lenses Market Volume (K Unit), by Usage 2024 & 2032
- Figure 109: South America Contact Lenses Market Revenue Share (%), by Usage 2024 & 2032
- Figure 110: South America Contact Lenses Market Volume Share (%), by Usage 2024 & 2032
- Figure 111: South America Contact Lenses Market Revenue (Million), by Modality 2024 & 2032
- Figure 112: South America Contact Lenses Market Volume (K Unit), by Modality 2024 & 2032
- Figure 113: South America Contact Lenses Market Revenue Share (%), by Modality 2024 & 2032
- Figure 114: South America Contact Lenses Market Volume Share (%), by Modality 2024 & 2032
- Figure 115: South America Contact Lenses Market Revenue (Million), by Design 2024 & 2032
- Figure 116: South America Contact Lenses Market Volume (K Unit), by Design 2024 & 2032
- Figure 117: South America Contact Lenses Market Revenue Share (%), by Design 2024 & 2032
- Figure 118: South America Contact Lenses Market Volume Share (%), by Design 2024 & 2032
- Figure 119: South America Contact Lenses Market Revenue (Million), by Country 2024 & 2032
- Figure 120: South America Contact Lenses Market Volume (K Unit), by Country 2024 & 2032
- Figure 121: South America Contact Lenses Market Revenue Share (%), by Country 2024 & 2032
- Figure 122: South America Contact Lenses Market Volume Share (%), by Country 2024 & 2032
List of Tables
- Table 1: Global Contact Lenses Market Revenue Million Forecast, by Region 2019 & 2032
- Table 2: Global Contact Lenses Market Volume K Unit Forecast, by Region 2019 & 2032
- Table 3: Global Contact Lenses Market Revenue Million Forecast, by Product Type 2019 & 2032
- Table 4: Global Contact Lenses Market Volume K Unit Forecast, by Product Type 2019 & 2032
- Table 5: Global Contact Lenses Market Revenue Million Forecast, by Usage 2019 & 2032
- Table 6: Global Contact Lenses Market Volume K Unit Forecast, by Usage 2019 & 2032
- Table 7: Global Contact Lenses Market Revenue Million Forecast, by Modality 2019 & 2032
- Table 8: Global Contact Lenses Market Volume K Unit Forecast, by Modality 2019 & 2032
- Table 9: Global Contact Lenses Market Revenue Million Forecast, by Design 2019 & 2032
- Table 10: Global Contact Lenses Market Volume K Unit Forecast, by Design 2019 & 2032
- Table 11: Global Contact Lenses Market Revenue Million Forecast, by Region 2019 & 2032
- Table 12: Global Contact Lenses Market Volume K Unit Forecast, by Region 2019 & 2032
- Table 13: Global Contact Lenses Market Revenue Million Forecast, by Country 2019 & 2032
- Table 14: Global Contact Lenses Market Volume K Unit Forecast, by Country 2019 & 2032
- Table 15: United States Contact Lenses Market Revenue (Million) Forecast, by Application 2019 & 2032
- Table 16: United States Contact Lenses Market Volume (K Unit) Forecast, by Application 2019 & 2032
- Table 17: Canada Contact Lenses Market Revenue (Million) Forecast, by Application 2019 & 2032
- Table 18: Canada Contact Lenses Market Volume (K Unit) Forecast, by Application 2019 & 2032
- Table 19: Mexico Contact Lenses Market Revenue (Million) Forecast, by Application 2019 & 2032
- Table 20: Mexico Contact Lenses Market Volume (K Unit) Forecast, by Application 2019 & 2032
- Table 21: Global Contact Lenses Market Revenue Million Forecast, by Country 2019 & 2032
- Table 22: Global Contact Lenses Market Volume K Unit Forecast, by Country 2019 & 2032
- Table 23: United Kingdom Contact Lenses Market Revenue (Million) Forecast, by Application 2019 & 2032
- Table 24: United Kingdom Contact Lenses Market Volume (K Unit) Forecast, by Application 2019 & 2032
- Table 25: Germany Contact Lenses Market Revenue (Million) Forecast, by Application 2019 & 2032
- Table 26: Germany Contact Lenses Market Volume (K Unit) Forecast, by Application 2019 & 2032
- Table 27: France Contact Lenses Market Revenue (Million) Forecast, by Application 2019 & 2032
- Table 28: France Contact Lenses Market Volume (K Unit) Forecast, by Application 2019 & 2032
- Table 29: Italy Contact Lenses Market Revenue (Million) Forecast, by Application 2019 & 2032
- Table 30: Italy Contact Lenses Market Volume (K Unit) Forecast, by Application 2019 & 2032
- Table 31: Spain Contact Lenses Market Revenue (Million) Forecast, by Application 2019 & 2032
- Table 32: Spain Contact Lenses Market Volume (K Unit) Forecast, by Application 2019 & 2032
- Table 33: Rest of Europe Contact Lenses Market Revenue (Million) Forecast, by Application 2019 & 2032
- Table 34: Rest of Europe Contact Lenses Market Volume (K Unit) Forecast, by Application 2019 & 2032
- Table 35: Global Contact Lenses Market Revenue Million Forecast, by Country 2019 & 2032
- Table 36: Global Contact Lenses Market Volume K Unit Forecast, by Country 2019 & 2032
- Table 37: China Contact Lenses Market Revenue (Million) Forecast, by Application 2019 & 2032
- Table 38: China Contact Lenses Market Volume (K Unit) Forecast, by Application 2019 & 2032
- Table 39: Japan Contact Lenses Market Revenue (Million) Forecast, by Application 2019 & 2032
- Table 40: Japan Contact Lenses Market Volume (K Unit) Forecast, by Application 2019 & 2032
- Table 41: India Contact Lenses Market Revenue (Million) Forecast, by Application 2019 & 2032
- Table 42: India Contact Lenses Market Volume (K Unit) Forecast, by Application 2019 & 2032
- Table 43: Australia Contact Lenses Market Revenue (Million) Forecast, by Application 2019 & 2032
- Table 44: Australia Contact Lenses Market Volume (K Unit) Forecast, by Application 2019 & 2032
- Table 45: South Korea Contact Lenses Market Revenue (Million) Forecast, by Application 2019 & 2032
- Table 46: South Korea Contact Lenses Market Volume (K Unit) Forecast, by Application 2019 & 2032
- Table 47: Rest of Asia Pacific Contact Lenses Market Revenue (Million) Forecast, by Application 2019 & 2032
- Table 48: Rest of Asia Pacific Contact Lenses Market Volume (K Unit) Forecast, by Application 2019 & 2032
- Table 49: Global Contact Lenses Market Revenue Million Forecast, by Country 2019 & 2032
- Table 50: Global Contact Lenses Market Volume K Unit Forecast, by Country 2019 & 2032
- Table 51: GCC Contact Lenses Market Revenue (Million) Forecast, by Application 2019 & 2032
- Table 52: GCC Contact Lenses Market Volume (K Unit) Forecast, by Application 2019 & 2032
- Table 53: South Africa Contact Lenses Market Revenue (Million) Forecast, by Application 2019 & 2032
- Table 54: South Africa Contact Lenses Market Volume (K Unit) Forecast, by Application 2019 & 2032
- Table 55: Rest of Middle East and Africa Contact Lenses Market Revenue (Million) Forecast, by Application 2019 & 2032
- Table 56: Rest of Middle East and Africa Contact Lenses Market Volume (K Unit) Forecast, by Application 2019 & 2032
- Table 57: Global Contact Lenses Market Revenue Million Forecast, by Country 2019 & 2032
- Table 58: Global Contact Lenses Market Volume K Unit Forecast, by Country 2019 & 2032
- Table 59: Brazil Contact Lenses Market Revenue (Million) Forecast, by Application 2019 & 2032
- Table 60: Brazil Contact Lenses Market Volume (K Unit) Forecast, by Application 2019 & 2032
- Table 61: Argentina Contact Lenses Market Revenue (Million) Forecast, by Application 2019 & 2032
- Table 62: Argentina Contact Lenses Market Volume (K Unit) Forecast, by Application 2019 & 2032
- Table 63: Rest of South America Contact Lenses Market Revenue (Million) Forecast, by Application 2019 & 2032
- Table 64: Rest of South America Contact Lenses Market Volume (K Unit) Forecast, by Application 2019 & 2032
- Table 65: Global Contact Lenses Market Revenue Million Forecast, by Product Type 2019 & 2032
- Table 66: Global Contact Lenses Market Volume K Unit Forecast, by Product Type 2019 & 2032
- Table 67: Global Contact Lenses Market Revenue Million Forecast, by Usage 2019 & 2032
- Table 68: Global Contact Lenses Market Volume K Unit Forecast, by Usage 2019 & 2032
- Table 69: Global Contact Lenses Market Revenue Million Forecast, by Modality 2019 & 2032
- Table 70: Global Contact Lenses Market Volume K Unit Forecast, by Modality 2019 & 2032
- Table 71: Global Contact Lenses Market Revenue Million Forecast, by Design 2019 & 2032
- Table 72: Global Contact Lenses Market Volume K Unit Forecast, by Design 2019 & 2032
- Table 73: Global Contact Lenses Market Revenue Million Forecast, by Country 2019 & 2032
- Table 74: Global Contact Lenses Market Volume K Unit Forecast, by Country 2019 & 2032
- Table 75: United States Contact Lenses Market Revenue (Million) Forecast, by Application 2019 & 2032
- Table 76: United States Contact Lenses Market Volume (K Unit) Forecast, by Application 2019 & 2032
- Table 77: Canada Contact Lenses Market Revenue (Million) Forecast, by Application 2019 & 2032
- Table 78: Canada Contact Lenses Market Volume (K Unit) Forecast, by Application 2019 & 2032
- Table 79: Mexico Contact Lenses Market Revenue (Million) Forecast, by Application 2019 & 2032
- Table 80: Mexico Contact Lenses Market Volume (K Unit) Forecast, by Application 2019 & 2032
- Table 81: Global Contact Lenses Market Revenue Million Forecast, by Product Type 2019 & 2032
- Table 82: Global Contact Lenses Market Volume K Unit Forecast, by Product Type 2019 & 2032
- Table 83: Global Contact Lenses Market Revenue Million Forecast, by Usage 2019 & 2032
- Table 84: Global Contact Lenses Market Volume K Unit Forecast, by Usage 2019 & 2032
- Table 85: Global Contact Lenses Market Revenue Million Forecast, by Modality 2019 & 2032
- Table 86: Global Contact Lenses Market Volume K Unit Forecast, by Modality 2019 & 2032
- Table 87: Global Contact Lenses Market Revenue Million Forecast, by Design 2019 & 2032
- Table 88: Global Contact Lenses Market Volume K Unit Forecast, by Design 2019 & 2032
- Table 89: Global Contact Lenses Market Revenue Million Forecast, by Country 2019 & 2032
- Table 90: Global Contact Lenses Market Volume K Unit Forecast, by Country 2019 & 2032
- Table 91: United Kingdom Contact Lenses Market Revenue (Million) Forecast, by Application 2019 & 2032
- Table 92: United Kingdom Contact Lenses Market Volume (K Unit) Forecast, by Application 2019 & 2032
- Table 93: Germany Contact Lenses Market Revenue (Million) Forecast, by Application 2019 & 2032
- Table 94: Germany Contact Lenses Market Volume (K Unit) Forecast, by Application 2019 & 2032
- Table 95: France Contact Lenses Market Revenue (Million) Forecast, by Application 2019 & 2032
- Table 96: France Contact Lenses Market Volume (K Unit) Forecast, by Application 2019 & 2032
- Table 97: Italy Contact Lenses Market Revenue (Million) Forecast, by Application 2019 & 2032
- Table 98: Italy Contact Lenses Market Volume (K Unit) Forecast, by Application 2019 & 2032
- Table 99: Spain Contact Lenses Market Revenue (Million) Forecast, by Application 2019 & 2032
- Table 100: Spain Contact Lenses Market Volume (K Unit) Forecast, by Application 2019 & 2032
- Table 101: Rest of Europe Contact Lenses Market Revenue (Million) Forecast, by Application 2019 & 2032
- Table 102: Rest of Europe Contact Lenses Market Volume (K Unit) Forecast, by Application 2019 & 2032
- Table 103: Global Contact Lenses Market Revenue Million Forecast, by Product Type 2019 & 2032
- Table 104: Global Contact Lenses Market Volume K Unit Forecast, by Product Type 2019 & 2032
- Table 105: Global Contact Lenses Market Revenue Million Forecast, by Usage 2019 & 2032
- Table 106: Global Contact Lenses Market Volume K Unit Forecast, by Usage 2019 & 2032
- Table 107: Global Contact Lenses Market Revenue Million Forecast, by Modality 2019 & 2032
- Table 108: Global Contact Lenses Market Volume K Unit Forecast, by Modality 2019 & 2032
- Table 109: Global Contact Lenses Market Revenue Million Forecast, by Design 2019 & 2032
- Table 110: Global Contact Lenses Market Volume K Unit Forecast, by Design 2019 & 2032
- Table 111: Global Contact Lenses Market Revenue Million Forecast, by Country 2019 & 2032
- Table 112: Global Contact Lenses Market Volume K Unit Forecast, by Country 2019 & 2032
- Table 113: China Contact Lenses Market Revenue (Million) Forecast, by Application 2019 & 2032
- Table 114: China Contact Lenses Market Volume (K Unit) Forecast, by Application 2019 & 2032
- Table 115: Japan Contact Lenses Market Revenue (Million) Forecast, by Application 2019 & 2032
- Table 116: Japan Contact Lenses Market Volume (K Unit) Forecast, by Application 2019 & 2032
- Table 117: India Contact Lenses Market Revenue (Million) Forecast, by Application 2019 & 2032
- Table 118: India Contact Lenses Market Volume (K Unit) Forecast, by Application 2019 & 2032
- Table 119: Australia Contact Lenses Market Revenue (Million) Forecast, by Application 2019 & 2032
- Table 120: Australia Contact Lenses Market Volume (K Unit) Forecast, by Application 2019 & 2032
- Table 121: South Korea Contact Lenses Market Revenue (Million) Forecast, by Application 2019 & 2032
- Table 122: South Korea Contact Lenses Market Volume (K Unit) Forecast, by Application 2019 & 2032
- Table 123: Rest of Asia Pacific Contact Lenses Market Revenue (Million) Forecast, by Application 2019 & 2032
- Table 124: Rest of Asia Pacific Contact Lenses Market Volume (K Unit) Forecast, by Application 2019 & 2032
- Table 125: Global Contact Lenses Market Revenue Million Forecast, by Product Type 2019 & 2032
- Table 126: Global Contact Lenses Market Volume K Unit Forecast, by Product Type 2019 & 2032
- Table 127: Global Contact Lenses Market Revenue Million Forecast, by Usage 2019 & 2032
- Table 128: Global Contact Lenses Market Volume K Unit Forecast, by Usage 2019 & 2032
- Table 129: Global Contact Lenses Market Revenue Million Forecast, by Modality 2019 & 2032
- Table 130: Global Contact Lenses Market Volume K Unit Forecast, by Modality 2019 & 2032
- Table 131: Global Contact Lenses Market Revenue Million Forecast, by Design 2019 & 2032
- Table 132: Global Contact Lenses Market Volume K Unit Forecast, by Design 2019 & 2032
- Table 133: Global Contact Lenses Market Revenue Million Forecast, by Country 2019 & 2032
- Table 134: Global Contact Lenses Market Volume K Unit Forecast, by Country 2019 & 2032
- Table 135: GCC Contact Lenses Market Revenue (Million) Forecast, by Application 2019 & 2032
- Table 136: GCC Contact Lenses Market Volume (K Unit) Forecast, by Application 2019 & 2032
- Table 137: South Africa Contact Lenses Market Revenue (Million) Forecast, by Application 2019 & 2032
- Table 138: South Africa Contact Lenses Market Volume (K Unit) Forecast, by Application 2019 & 2032
- Table 139: Rest of Middle East and Africa Contact Lenses Market Revenue (Million) Forecast, by Application 2019 & 2032
- Table 140: Rest of Middle East and Africa Contact Lenses Market Volume (K Unit) Forecast, by Application 2019 & 2032
- Table 141: Global Contact Lenses Market Revenue Million Forecast, by Product Type 2019 & 2032
- Table 142: Global Contact Lenses Market Volume K Unit Forecast, by Product Type 2019 & 2032
- Table 143: Global Contact Lenses Market Revenue Million Forecast, by Usage 2019 & 2032
- Table 144: Global Contact Lenses Market Volume K Unit Forecast, by Usage 2019 & 2032
- Table 145: Global Contact Lenses Market Revenue Million Forecast, by Modality 2019 & 2032
- Table 146: Global Contact Lenses Market Volume K Unit Forecast, by Modality 2019 & 2032
- Table 147: Global Contact Lenses Market Revenue Million Forecast, by Design 2019 & 2032
- Table 148: Global Contact Lenses Market Volume K Unit Forecast, by Design 2019 & 2032
- Table 149: Global Contact Lenses Market Revenue Million Forecast, by Country 2019 & 2032
- Table 150: Global Contact Lenses Market Volume K Unit Forecast, by Country 2019 & 2032
- Table 151: Brazil Contact Lenses Market Revenue (Million) Forecast, by Application 2019 & 2032
- Table 152: Brazil Contact Lenses Market Volume (K Unit) Forecast, by Application 2019 & 2032
- Table 153: Argentina Contact Lenses Market Revenue (Million) Forecast, by Application 2019 & 2032
- Table 154: Argentina Contact Lenses Market Volume (K Unit) Forecast, by Application 2019 & 2032
- Table 155: Rest of South America Contact Lenses Market Revenue (Million) Forecast, by Application 2019 & 2032
- Table 156: Rest of South America Contact Lenses Market Volume (K Unit) Forecast, by Application 2019 & 2032
Frequently Asked Questions
1. What is the projected Compound Annual Growth Rate (CAGR) of the Contact Lenses Market?
The projected CAGR is approximately 3.66%.
2. Which companies are prominent players in the Contact Lenses Market?
Key companies in the market include Eyemera INC, Essilor International SA, The Cooper Companies, Alcon Vision LLC, SynergEyes Inc, Menicon Co Ltd, Zeiss Group, Johnson & Johnson Vision Care Inc, Seed Co Ltd, Bausch Health Companies Inc, Hoya Corporation.
3. What are the main segments of the Contact Lenses Market?
The market segments include Product Type, Usage, Modality, Design.
4. Can you provide details about the market size?
The market size is estimated to be USD 10.23 Million as of 2022.
5. What are some drivers contributing to market growth?
Increasing Burden of Optical Disorders; Increasing Tendency to Enhance Aesthetics.
6. What are the notable trends driving market growth?
Corrective Contact Lenses are Expected to Register a Significant Growth Rate over the Forecast Period.
7. Are there any restraints impacting market growth?
Availability of Alternative Techniques and Complications Associated with Lenses4.3.2.
8. Can you provide examples of recent developments in the market?
June 2022: Johnson & Johnson Vision, a part of Johnson & Johnson MedTech, received FDA clearance for its latest contact lens innovation, ACUVUE OASYS MAX 1-Day and ACUVUE OASYS MAX 1-Day MULTIFOCAL.
9. What pricing options are available for accessing the report?
Pricing options include single-user, multi-user, and enterprise licenses priced at USD 4750, USD 5250, and USD 8750 respectively.
10. Is the market size provided in terms of value or volume?
The market size is provided in terms of value, measured in Million and volume, measured in K Unit.
11. Are there any specific market keywords associated with the report?
Yes, the market keyword associated with the report is "Contact Lenses Market," which aids in identifying and referencing the specific market segment covered.
12. How do I determine which pricing option suits my needs best?
The pricing options vary based on user requirements and access needs. Individual users may opt for single-user licenses, while businesses requiring broader access may choose multi-user or enterprise licenses for cost-effective access to the report.
13. Are there any additional resources or data provided in the Contact Lenses Market report?
While the report offers comprehensive insights, it's advisable to review the specific contents or supplementary materials provided to ascertain if additional resources or data are available.
14. How can I stay updated on further developments or reports in the Contact Lenses Market?
To stay informed about further developments, trends, and reports in the Contact Lenses Market, consider subscribing to industry newsletters, following relevant companies and organizations, or regularly checking reputable industry news sources and publications.
Methodology
Step 1 - Identification of Relevant Samples Size from Population Database


Step 2 - Approaches for Defining Global Market Size (Value, Volume* & Price*)

Note*: In applicable scenarios
Step 3 - Data Sources
Primary Research
- Web Analytics
- Survey Reports
- Research Institute
- Latest Research Reports
- Opinion Leaders
Secondary Research
- Annual Reports
- White Paper
- Latest Press Release
- Industry Association
- Paid Database
- Investor Presentations

Step 4 - Data Triangulation
Involves using different sources of information in order to increase the validity of a study
These sources are likely to be stakeholders in a program - participants, other researchers, program staff, other community members, and so on.
Then we put all data in single framework & apply various statistical tools to find out the dynamic on the market.
During the analysis stage, feedback from the stakeholder groups would be compared to determine areas of agreement as well as areas of divergence
