

Key Insights
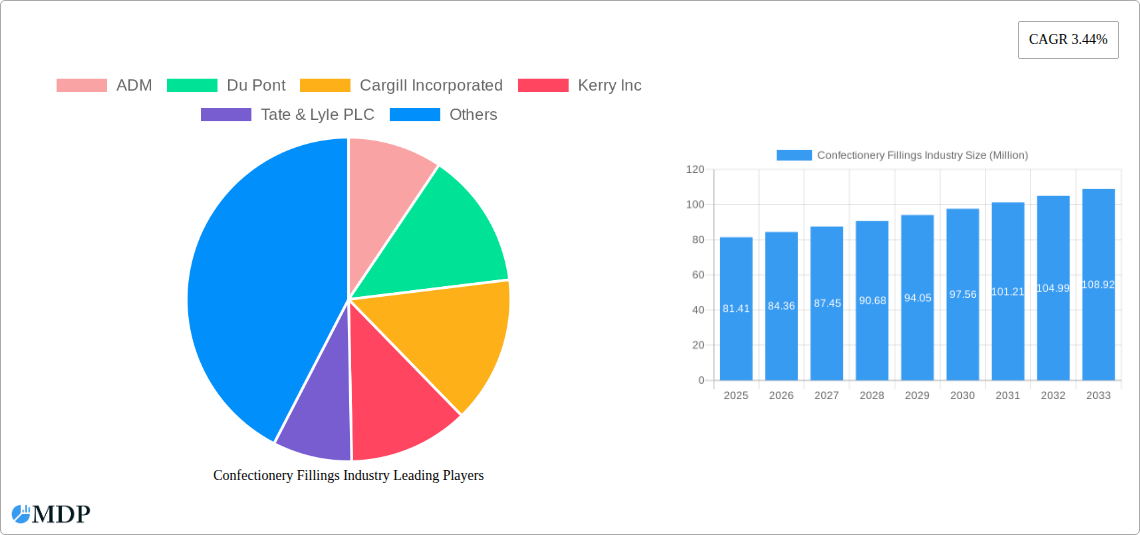
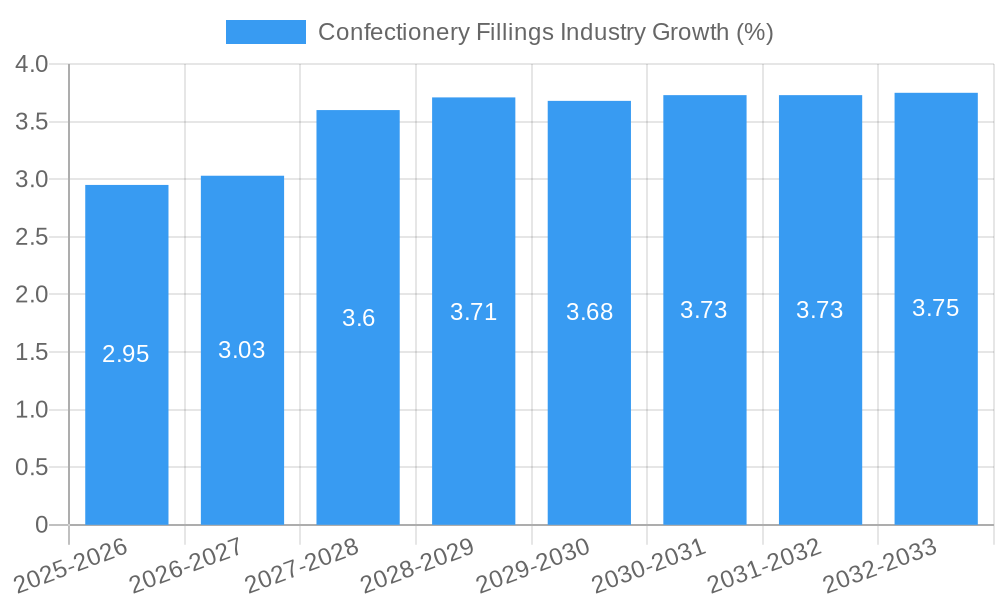
The global confectionery fillings market, valued at $81.41 million in 2025, is projected to experience steady growth, driven by increasing demand for diverse and premium confectionery products. A Compound Annual Growth Rate (CAGR) of 3.44% from 2025 to 2033 indicates a consistent expansion, fueled by several key factors. Consumer preference for innovative and indulgent fillings, coupled with the rising popularity of gourmet and artisanal confectionery, are major drivers. The market is segmented by key ingredients including dairy ingredients, sweeteners, flavors, oils & shortenings, emulsifiers, and others, each contributing to the overall market size and growth trajectory. Growth in emerging economies, particularly in Asia-Pacific, is expected to contribute significantly to overall market expansion. However, fluctuating raw material prices and stringent regulatory requirements regarding food additives could present challenges to market growth. Leading players such as ADM, DuPont, Cargill, Kerry, Tate & Lyle, Ingredion, and Olam International are constantly innovating to meet changing consumer preferences and maintain their market share. This involves developing new and improved fillings with enhanced textures, flavors, and nutritional profiles. The competitive landscape is characterized by both large multinational corporations and smaller specialized manufacturers, resulting in a dynamic and diverse market offering.
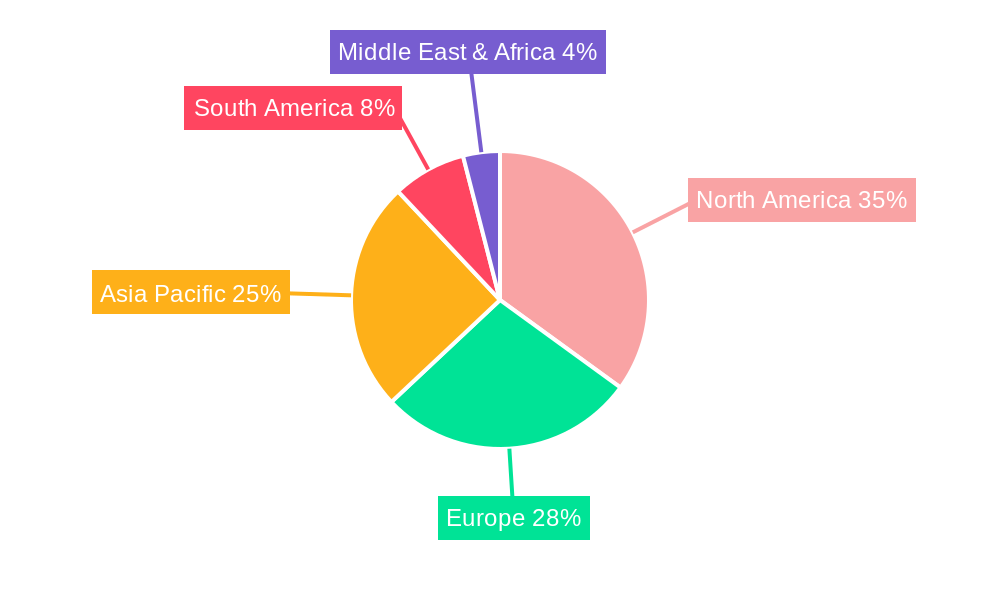
The North American market, comprising the United States, Canada, and Mexico, is anticipated to hold a significant share of the global market due to established confectionery industries and high consumer spending. Europe and Asia-Pacific are also expected to show considerable growth, driven by rising disposable incomes and changing consumer lifestyles in these regions. South America and the Middle East & Africa regions will experience moderate growth, reflecting developing confectionery markets and evolving consumer preferences. The market's future growth will depend largely on innovation within the industry, including the development of healthier and more sustainable fillings, which is attracting considerable consumer attention. This focus on healthier options, such as reduced sugar fillings and organic ingredients, will likely shape market trends in the coming years.
Confectionery Fillings Industry: A Comprehensive Market Report (2019-2033)
This in-depth report provides a comprehensive analysis of the global confectionery fillings industry, offering invaluable insights for stakeholders, investors, and industry professionals. With a study period spanning 2019-2033, a base year of 2025, and an estimated and forecast period of 2025-2033, this report leverages rigorous data analysis to predict future market trends and opportunities. The market size is estimated at xx Million in 2025 and is projected to reach xx Million by 2033, showcasing substantial growth potential. Key players like ADM, DuPont, Cargill Incorporated, Kerry Inc, Tate & Lyle PLC, Ingredion Incorporated, Olam International and many more are analyzed, providing a clear understanding of the competitive landscape.
Confectionery Fillings Industry Market Dynamics & Concentration
The confectionery fillings market is characterized by a moderately concentrated structure, with several large multinational companies holding significant market share. ADM, Cargill, and Tate & Lyle PLC are key players, collectively accounting for an estimated xx% of the market in 2025. Innovation in flavor profiles, textures, and natural ingredient options is a significant driver, pushing companies to invest heavily in R&D. Stringent food safety regulations globally impact ingredient sourcing and manufacturing processes. Substitute products, such as fruit purees or simpler sugar-based fillings, exert pressure on the market, particularly in price-sensitive segments. Consumer preferences toward healthier and more natural options, including reduced sugar and increased use of plant-based ingredients, are reshaping the industry. Mergers and acquisitions (M&A) activity has been moderate in recent years, with xx major deals recorded between 2019 and 2024, mainly focused on expanding product portfolios and geographical reach.
- Market Concentration: Moderately concentrated, with top 5 players holding xx% market share (2025).
- Innovation Drivers: Natural ingredients, novel textures, and unique flavors.
- Regulatory Framework: Stringent food safety and labeling regulations vary by region.
- Product Substitutes: Fruit purees, simpler sugar-based fillings.
- End-User Trends: Growing preference for healthier and natural fillings.
- M&A Activity: xx major deals between 2019-2024, focused on portfolio expansion and geographical reach.
Confectionery Fillings Industry Industry Trends & Analysis
The confectionery fillings market exhibits robust growth, driven primarily by rising global demand for confectionery products and the increasing preference for premium and differentiated fillings. The market is experiencing a Compound Annual Growth Rate (CAGR) of xx% during the forecast period (2025-2033). Technological advancements in ingredient processing and formulation are facilitating the creation of innovative fillings with improved texture, shelf life, and health benefits. Consumers are increasingly seeking healthier options, leading to a rise in demand for fillings with reduced sugar, fat, and artificial ingredients. This trend is fueling innovation in natural sweeteners and alternative fat sources. Intense competition among major players necessitates continuous product innovation and strategic partnerships to maintain market share and expand into new geographic regions. Market penetration of premium fillings is increasing, particularly in developed economies.
Leading Markets & Segments in Confectionery Fillings Industry
The North American region dominates the confectionery fillings market, driven by high confectionery consumption and a robust food processing industry. Within the segment breakdown, dairy ingredients represent the largest segment, holding approximately xx% market share in 2025.
- Key Drivers in North America: Strong confectionery market, established food processing infrastructure, high disposable incomes.
- Dairy Ingredients Dominance: High demand for creamy textures and functionalities.
Other Segments: Sweeteners, flavors, oils & shortenings, emulsifiers, and others contribute significantly to the overall market. Growth in specific segments depends on factors such as consumer preferences (health consciousness, demand for specific flavors) and technological advancements in specific ingredient categories. Detailed analysis of each segment will be provided in the full report.
Confectionery Fillings Industry Product Developments
Recent years have witnessed significant innovation in confectionery fillings, focusing on clean-label ingredients, unique flavor combinations, and improved texture. Technological advancements in processing and encapsulation techniques allow for greater control over flavor release and texture, leading to more appealing and functional fillings. The emphasis on natural and organic ingredients continues to be a key driver, with companies investing in developing sustainable and ethically sourced ingredients. This trend enhances product appeal and aligns with growing consumer demand for transparency and authenticity. The focus is on developing fillings that enhance the overall sensory experience, appeal to evolving consumer preferences, and meet the diverse needs of various confectionery products.
Key Drivers of Confectionery Fillings Industry Growth
Several factors fuel the growth of the confectionery fillings industry. Firstly, the rising global demand for confectionery products is a major driver. Secondly, increasing consumer preference for premium fillings with unique flavors and textures is fueling innovation and growth. Technological advancements in ingredient processing and formulation are enabling the creation of fillings with improved functionality and shelf life. Finally, supportive economic conditions and growing disposable incomes in many regions contribute to the overall market expansion.
Challenges in the Confectionery Fillings Industry Market
The confectionery fillings industry faces challenges including stringent regulations regarding ingredient labeling and health claims, impacting product formulations and marketing strategies. Supply chain disruptions can affect the availability and cost of raw materials, influencing profitability. Intense competition among established players necessitates constant product innovation and strategic partnerships to maintain market competitiveness. The impact of these challenges is estimated to constrain the market growth rate by xx% during the forecast period.
Emerging Opportunities in Confectionery Fillings Industry
The confectionery fillings market presents several promising opportunities. Technological breakthroughs in ingredient processing, particularly in creating natural and healthier options, unlock new possibilities for product development. Strategic partnerships between ingredient suppliers and confectionery manufacturers enhance innovation and efficiency. Expanding into emerging markets with growing consumer demand for confectionery products offers considerable potential for future growth.
Leading Players in the Confectionery Fillings Industry Sector
- ADM
- Du Pont
- Cargill Incorporated
- Kerry Inc
- Tate & Lyle PLC
- Ingredion Incorporated
- Olam International
Key Milestones in Confectionery Fillings Industry Industry
- 2020: Introduction of several plant-based fillings by major players.
- 2021: Increased focus on sugar reduction technologies in filling formulations.
- 2022: Several mergers and acquisitions aimed at expanding product portfolios.
- 2023: Launch of innovative clean-label fillings with natural colors and flavors.
- 2024: Regulatory changes impacting labeling requirements for certain ingredients.
Strategic Outlook for Confectionery Fillings Industry Market
The confectionery fillings market is poised for continued growth, driven by consumer demand for premium and healthy options. Strategic investments in research and development, focusing on sustainable and ethically sourced ingredients, are crucial. Strategic partnerships and collaborations within the industry can accelerate innovation and market penetration. Expanding into new geographic markets and catering to diverse consumer preferences will further solidify market position and long-term success.
Confectionery Fillings Industry Segmentation
-
1. Type
- 1.1. Dairy Ingredients
- 1.2. Sweeteners
- 1.3. Flavors
- 1.4. Oils & Shortenings
- 1.5. Emulsifiers
- 1.6. Others
Confectionery Fillings Industry Segmentation By Geography
-
1. North America
- 1.1. United States
- 1.2. Canada
- 1.3. Mexico
- 1.4. Rest of North America
-
2. Europe
- 2.1. United Kingdom
- 2.2. Germany
- 2.3. France
- 2.4. Russia
- 2.5. Italy
- 2.6. Spain
- 2.7. Rest of Europe
-
3. Asia Pacific
- 3.1. India
- 3.2. China
- 3.3. Japan
- 3.4. Australia
- 3.5. Rest of Asia Pacific
-
4. South America
- 4.1. Brazil
- 4.2. Argentina
- 4.3. Rest of South America
- 5. Middle East
-
6. South Africa
- 6.1. Saudi Arabia
- 6.2. Rest of Middle East
Confectionery Fillings Industry REPORT HIGHLIGHTS
| Aspects | Details |
|---|---|
| Study Period | 2019-2033 |
| Base Year | 2024 |
| Estimated Year | 2025 |
| Forecast Period | 2025-2033 |
| Historical Period | 2019-2024 |
| Growth Rate | CAGR of 3.44% from 2019-2033 |
| Segmentation |
|
Table of Contents
- 1. Introduction
- 1.1. Research Scope
- 1.2. Market Segmentation
- 1.3. Research Methodology
- 1.4. Definitions and Assumptions
- 2. Executive Summary
- 2.1. Introduction
- 3. Market Dynamics
- 3.1. Introduction
- 3.2. Market Drivers
- 3.2.1. Increasing Demand for Low-Fat and Low-Calorie Food; Increasing Product Innovation
- 3.3. Market Restrains
- 3.3.1. ; Threat of New Entrants; Bargaining Power of Buyers/Consumers; Bargaining Power of Suppliers; Threat of Substitute Products; Degree Of Competition
- 3.4. Market Trends
- 3.4.1. Rising Demand For Flavored Confectioneries
- 4. Market Factor Analysis
- 4.1. Porters Five Forces
- 4.2. Supply/Value Chain
- 4.3. PESTEL analysis
- 4.4. Market Entropy
- 4.5. Patent/Trademark Analysis
- 5. Global Confectionery Fillings Industry Analysis, Insights and Forecast, 2019-2031
- 5.1. Market Analysis, Insights and Forecast - by Type
- 5.1.1. Dairy Ingredients
- 5.1.2. Sweeteners
- 5.1.3. Flavors
- 5.1.4. Oils & Shortenings
- 5.1.5. Emulsifiers
- 5.1.6. Others
- 5.2. Market Analysis, Insights and Forecast - by Region
- 5.2.1. North America
- 5.2.2. Europe
- 5.2.3. Asia Pacific
- 5.2.4. South America
- 5.2.5. Middle East
- 5.2.6. South Africa
- 5.1. Market Analysis, Insights and Forecast - by Type
- 6. North America Confectionery Fillings Industry Analysis, Insights and Forecast, 2019-2031
- 6.1. Market Analysis, Insights and Forecast - by Type
- 6.1.1. Dairy Ingredients
- 6.1.2. Sweeteners
- 6.1.3. Flavors
- 6.1.4. Oils & Shortenings
- 6.1.5. Emulsifiers
- 6.1.6. Others
- 6.1. Market Analysis, Insights and Forecast - by Type
- 7. Europe Confectionery Fillings Industry Analysis, Insights and Forecast, 2019-2031
- 7.1. Market Analysis, Insights and Forecast - by Type
- 7.1.1. Dairy Ingredients
- 7.1.2. Sweeteners
- 7.1.3. Flavors
- 7.1.4. Oils & Shortenings
- 7.1.5. Emulsifiers
- 7.1.6. Others
- 7.1. Market Analysis, Insights and Forecast - by Type
- 8. Asia Pacific Confectionery Fillings Industry Analysis, Insights and Forecast, 2019-2031
- 8.1. Market Analysis, Insights and Forecast - by Type
- 8.1.1. Dairy Ingredients
- 8.1.2. Sweeteners
- 8.1.3. Flavors
- 8.1.4. Oils & Shortenings
- 8.1.5. Emulsifiers
- 8.1.6. Others
- 8.1. Market Analysis, Insights and Forecast - by Type
- 9. South America Confectionery Fillings Industry Analysis, Insights and Forecast, 2019-2031
- 9.1. Market Analysis, Insights and Forecast - by Type
- 9.1.1. Dairy Ingredients
- 9.1.2. Sweeteners
- 9.1.3. Flavors
- 9.1.4. Oils & Shortenings
- 9.1.5. Emulsifiers
- 9.1.6. Others
- 9.1. Market Analysis, Insights and Forecast - by Type
- 10. Middle East Confectionery Fillings Industry Analysis, Insights and Forecast, 2019-2031
- 10.1. Market Analysis, Insights and Forecast - by Type
- 10.1.1. Dairy Ingredients
- 10.1.2. Sweeteners
- 10.1.3. Flavors
- 10.1.4. Oils & Shortenings
- 10.1.5. Emulsifiers
- 10.1.6. Others
- 10.1. Market Analysis, Insights and Forecast - by Type
- 11. South Africa Confectionery Fillings Industry Analysis, Insights and Forecast, 2019-2031
- 11.1. Market Analysis, Insights and Forecast - by Type
- 11.1.1. Dairy Ingredients
- 11.1.2. Sweeteners
- 11.1.3. Flavors
- 11.1.4. Oils & Shortenings
- 11.1.5. Emulsifiers
- 11.1.6. Others
- 11.1. Market Analysis, Insights and Forecast - by Type
- 12. North America Confectionery Fillings Industry Analysis, Insights and Forecast, 2019-2031
- 12.1. Market Analysis, Insights and Forecast - By Country/Sub-region
- 12.1.1 United States
- 12.1.2 Canada
- 12.1.3 Mexico
- 12.1.4 Rest of North America
- 13. Europe Confectionery Fillings Industry Analysis, Insights and Forecast, 2019-2031
- 13.1. Market Analysis, Insights and Forecast - By Country/Sub-region
- 13.1.1 United Kingdom
- 13.1.2 Germany
- 13.1.3 France
- 13.1.4 Russia
- 13.1.5 Italy
- 13.1.6 Spain
- 13.1.7 Rest of Europe
- 14. Asia Pacific Confectionery Fillings Industry Analysis, Insights and Forecast, 2019-2031
- 14.1. Market Analysis, Insights and Forecast - By Country/Sub-region
- 14.1.1 India
- 14.1.2 China
- 14.1.3 Japan
- 14.1.4 Australia
- 14.1.5 Rest of Asia Pacific
- 15. South America Confectionery Fillings Industry Analysis, Insights and Forecast, 2019-2031
- 15.1. Market Analysis, Insights and Forecast - By Country/Sub-region
- 15.1.1 Brazil
- 15.1.2 Argentina
- 15.1.3 Rest of South America
- 16. South Africa Confectionery Fillings Industry Analysis, Insights and Forecast, 2019-2031
- 16.1. Market Analysis, Insights and Forecast - By Country/Sub-region
- 16.1.1 Saudi Arabia
- 16.1.2 Rest of Middle East
- 17. Competitive Analysis
- 17.1. Global Market Share Analysis 2024
- 17.2. Company Profiles
- 17.2.1 ADM
- 17.2.1.1. Overview
- 17.2.1.2. Products
- 17.2.1.3. SWOT Analysis
- 17.2.1.4. Recent Developments
- 17.2.1.5. Financials (Based on Availability)
- 17.2.2 Du Pont
- 17.2.2.1. Overview
- 17.2.2.2. Products
- 17.2.2.3. SWOT Analysis
- 17.2.2.4. Recent Developments
- 17.2.2.5. Financials (Based on Availability)
- 17.2.3 Cargill Incorporated
- 17.2.3.1. Overview
- 17.2.3.2. Products
- 17.2.3.3. SWOT Analysis
- 17.2.3.4. Recent Developments
- 17.2.3.5. Financials (Based on Availability)
- 17.2.4 Kerry Inc
- 17.2.4.1. Overview
- 17.2.4.2. Products
- 17.2.4.3. SWOT Analysis
- 17.2.4.4. Recent Developments
- 17.2.4.5. Financials (Based on Availability)
- 17.2.5 Tate & Lyle PLC
- 17.2.5.1. Overview
- 17.2.5.2. Products
- 17.2.5.3. SWOT Analysis
- 17.2.5.4. Recent Developments
- 17.2.5.5. Financials (Based on Availability)
- 17.2.6 Ingredion Incorporated*List Not Exhaustive
- 17.2.6.1. Overview
- 17.2.6.2. Products
- 17.2.6.3. SWOT Analysis
- 17.2.6.4. Recent Developments
- 17.2.6.5. Financials (Based on Availability)
- 17.2.7 Olam International
- 17.2.7.1. Overview
- 17.2.7.2. Products
- 17.2.7.3. SWOT Analysis
- 17.2.7.4. Recent Developments
- 17.2.7.5. Financials (Based on Availability)
- 17.2.1 ADM
List of Figures
- Figure 1: Global Confectionery Fillings Industry Revenue Breakdown (Million, %) by Region 2024 & 2032
- Figure 2: North America Confectionery Fillings Industry Revenue (Million), by Country 2024 & 2032
- Figure 3: North America Confectionery Fillings Industry Revenue Share (%), by Country 2024 & 2032
- Figure 4: Europe Confectionery Fillings Industry Revenue (Million), by Country 2024 & 2032
- Figure 5: Europe Confectionery Fillings Industry Revenue Share (%), by Country 2024 & 2032
- Figure 6: Asia Pacific Confectionery Fillings Industry Revenue (Million), by Country 2024 & 2032
- Figure 7: Asia Pacific Confectionery Fillings Industry Revenue Share (%), by Country 2024 & 2032
- Figure 8: South America Confectionery Fillings Industry Revenue (Million), by Country 2024 & 2032
- Figure 9: South America Confectionery Fillings Industry Revenue Share (%), by Country 2024 & 2032
- Figure 10: South Africa Confectionery Fillings Industry Revenue (Million), by Country 2024 & 2032
- Figure 11: South Africa Confectionery Fillings Industry Revenue Share (%), by Country 2024 & 2032
- Figure 12: North America Confectionery Fillings Industry Revenue (Million), by Type 2024 & 2032
- Figure 13: North America Confectionery Fillings Industry Revenue Share (%), by Type 2024 & 2032
- Figure 14: North America Confectionery Fillings Industry Revenue (Million), by Country 2024 & 2032
- Figure 15: North America Confectionery Fillings Industry Revenue Share (%), by Country 2024 & 2032
- Figure 16: Europe Confectionery Fillings Industry Revenue (Million), by Type 2024 & 2032
- Figure 17: Europe Confectionery Fillings Industry Revenue Share (%), by Type 2024 & 2032
- Figure 18: Europe Confectionery Fillings Industry Revenue (Million), by Country 2024 & 2032
- Figure 19: Europe Confectionery Fillings Industry Revenue Share (%), by Country 2024 & 2032
- Figure 20: Asia Pacific Confectionery Fillings Industry Revenue (Million), by Type 2024 & 2032
- Figure 21: Asia Pacific Confectionery Fillings Industry Revenue Share (%), by Type 2024 & 2032
- Figure 22: Asia Pacific Confectionery Fillings Industry Revenue (Million), by Country 2024 & 2032
- Figure 23: Asia Pacific Confectionery Fillings Industry Revenue Share (%), by Country 2024 & 2032
- Figure 24: South America Confectionery Fillings Industry Revenue (Million), by Type 2024 & 2032
- Figure 25: South America Confectionery Fillings Industry Revenue Share (%), by Type 2024 & 2032
- Figure 26: South America Confectionery Fillings Industry Revenue (Million), by Country 2024 & 2032
- Figure 27: South America Confectionery Fillings Industry Revenue Share (%), by Country 2024 & 2032
- Figure 28: Middle East Confectionery Fillings Industry Revenue (Million), by Type 2024 & 2032
- Figure 29: Middle East Confectionery Fillings Industry Revenue Share (%), by Type 2024 & 2032
- Figure 30: Middle East Confectionery Fillings Industry Revenue (Million), by Country 2024 & 2032
- Figure 31: Middle East Confectionery Fillings Industry Revenue Share (%), by Country 2024 & 2032
- Figure 32: South Africa Confectionery Fillings Industry Revenue (Million), by Type 2024 & 2032
- Figure 33: South Africa Confectionery Fillings Industry Revenue Share (%), by Type 2024 & 2032
- Figure 34: South Africa Confectionery Fillings Industry Revenue (Million), by Country 2024 & 2032
- Figure 35: South Africa Confectionery Fillings Industry Revenue Share (%), by Country 2024 & 2032
List of Tables
- Table 1: Global Confectionery Fillings Industry Revenue Million Forecast, by Region 2019 & 2032
- Table 2: Global Confectionery Fillings Industry Revenue Million Forecast, by Type 2019 & 2032
- Table 3: Global Confectionery Fillings Industry Revenue Million Forecast, by Region 2019 & 2032
- Table 4: Global Confectionery Fillings Industry Revenue Million Forecast, by Country 2019 & 2032
- Table 5: United States Confectionery Fillings Industry Revenue (Million) Forecast, by Application 2019 & 2032
- Table 6: Canada Confectionery Fillings Industry Revenue (Million) Forecast, by Application 2019 & 2032
- Table 7: Mexico Confectionery Fillings Industry Revenue (Million) Forecast, by Application 2019 & 2032
- Table 8: Rest of North America Confectionery Fillings Industry Revenue (Million) Forecast, by Application 2019 & 2032
- Table 9: Global Confectionery Fillings Industry Revenue Million Forecast, by Country 2019 & 2032
- Table 10: United Kingdom Confectionery Fillings Industry Revenue (Million) Forecast, by Application 2019 & 2032
- Table 11: Germany Confectionery Fillings Industry Revenue (Million) Forecast, by Application 2019 & 2032
- Table 12: France Confectionery Fillings Industry Revenue (Million) Forecast, by Application 2019 & 2032
- Table 13: Russia Confectionery Fillings Industry Revenue (Million) Forecast, by Application 2019 & 2032
- Table 14: Italy Confectionery Fillings Industry Revenue (Million) Forecast, by Application 2019 & 2032
- Table 15: Spain Confectionery Fillings Industry Revenue (Million) Forecast, by Application 2019 & 2032
- Table 16: Rest of Europe Confectionery Fillings Industry Revenue (Million) Forecast, by Application 2019 & 2032
- Table 17: Global Confectionery Fillings Industry Revenue Million Forecast, by Country 2019 & 2032
- Table 18: India Confectionery Fillings Industry Revenue (Million) Forecast, by Application 2019 & 2032
- Table 19: China Confectionery Fillings Industry Revenue (Million) Forecast, by Application 2019 & 2032
- Table 20: Japan Confectionery Fillings Industry Revenue (Million) Forecast, by Application 2019 & 2032
- Table 21: Australia Confectionery Fillings Industry Revenue (Million) Forecast, by Application 2019 & 2032
- Table 22: Rest of Asia Pacific Confectionery Fillings Industry Revenue (Million) Forecast, by Application 2019 & 2032
- Table 23: Global Confectionery Fillings Industry Revenue Million Forecast, by Country 2019 & 2032
- Table 24: Brazil Confectionery Fillings Industry Revenue (Million) Forecast, by Application 2019 & 2032
- Table 25: Argentina Confectionery Fillings Industry Revenue (Million) Forecast, by Application 2019 & 2032
- Table 26: Rest of South America Confectionery Fillings Industry Revenue (Million) Forecast, by Application 2019 & 2032
- Table 27: Global Confectionery Fillings Industry Revenue Million Forecast, by Country 2019 & 2032
- Table 28: Saudi Arabia Confectionery Fillings Industry Revenue (Million) Forecast, by Application 2019 & 2032
- Table 29: Rest of Middle East Confectionery Fillings Industry Revenue (Million) Forecast, by Application 2019 & 2032
- Table 30: Global Confectionery Fillings Industry Revenue Million Forecast, by Type 2019 & 2032
- Table 31: Global Confectionery Fillings Industry Revenue Million Forecast, by Country 2019 & 2032
- Table 32: United States Confectionery Fillings Industry Revenue (Million) Forecast, by Application 2019 & 2032
- Table 33: Canada Confectionery Fillings Industry Revenue (Million) Forecast, by Application 2019 & 2032
- Table 34: Mexico Confectionery Fillings Industry Revenue (Million) Forecast, by Application 2019 & 2032
- Table 35: Rest of North America Confectionery Fillings Industry Revenue (Million) Forecast, by Application 2019 & 2032
- Table 36: Global Confectionery Fillings Industry Revenue Million Forecast, by Type 2019 & 2032
- Table 37: Global Confectionery Fillings Industry Revenue Million Forecast, by Country 2019 & 2032
- Table 38: United Kingdom Confectionery Fillings Industry Revenue (Million) Forecast, by Application 2019 & 2032
- Table 39: Germany Confectionery Fillings Industry Revenue (Million) Forecast, by Application 2019 & 2032
- Table 40: France Confectionery Fillings Industry Revenue (Million) Forecast, by Application 2019 & 2032
- Table 41: Russia Confectionery Fillings Industry Revenue (Million) Forecast, by Application 2019 & 2032
- Table 42: Italy Confectionery Fillings Industry Revenue (Million) Forecast, by Application 2019 & 2032
- Table 43: Spain Confectionery Fillings Industry Revenue (Million) Forecast, by Application 2019 & 2032
- Table 44: Rest of Europe Confectionery Fillings Industry Revenue (Million) Forecast, by Application 2019 & 2032
- Table 45: Global Confectionery Fillings Industry Revenue Million Forecast, by Type 2019 & 2032
- Table 46: Global Confectionery Fillings Industry Revenue Million Forecast, by Country 2019 & 2032
- Table 47: India Confectionery Fillings Industry Revenue (Million) Forecast, by Application 2019 & 2032
- Table 48: China Confectionery Fillings Industry Revenue (Million) Forecast, by Application 2019 & 2032
- Table 49: Japan Confectionery Fillings Industry Revenue (Million) Forecast, by Application 2019 & 2032
- Table 50: Australia Confectionery Fillings Industry Revenue (Million) Forecast, by Application 2019 & 2032
- Table 51: Rest of Asia Pacific Confectionery Fillings Industry Revenue (Million) Forecast, by Application 2019 & 2032
- Table 52: Global Confectionery Fillings Industry Revenue Million Forecast, by Type 2019 & 2032
- Table 53: Global Confectionery Fillings Industry Revenue Million Forecast, by Country 2019 & 2032
- Table 54: Brazil Confectionery Fillings Industry Revenue (Million) Forecast, by Application 2019 & 2032
- Table 55: Argentina Confectionery Fillings Industry Revenue (Million) Forecast, by Application 2019 & 2032
- Table 56: Rest of South America Confectionery Fillings Industry Revenue (Million) Forecast, by Application 2019 & 2032
- Table 57: Global Confectionery Fillings Industry Revenue Million Forecast, by Type 2019 & 2032
- Table 58: Global Confectionery Fillings Industry Revenue Million Forecast, by Country 2019 & 2032
- Table 59: Global Confectionery Fillings Industry Revenue Million Forecast, by Type 2019 & 2032
- Table 60: Global Confectionery Fillings Industry Revenue Million Forecast, by Country 2019 & 2032
- Table 61: Saudi Arabia Confectionery Fillings Industry Revenue (Million) Forecast, by Application 2019 & 2032
- Table 62: Rest of Middle East Confectionery Fillings Industry Revenue (Million) Forecast, by Application 2019 & 2032
Frequently Asked Questions
1. What is the projected Compound Annual Growth Rate (CAGR) of the Confectionery Fillings Industry?
The projected CAGR is approximately 3.44%.
2. Which companies are prominent players in the Confectionery Fillings Industry?
Key companies in the market include ADM, Du Pont, Cargill Incorporated, Kerry Inc, Tate & Lyle PLC, Ingredion Incorporated*List Not Exhaustive, Olam International.
3. What are the main segments of the Confectionery Fillings Industry?
The market segments include Type.
4. Can you provide details about the market size?
The market size is estimated to be USD 81.41 Million as of 2022.
5. What are some drivers contributing to market growth?
Increasing Demand for Low-Fat and Low-Calorie Food; Increasing Product Innovation.
6. What are the notable trends driving market growth?
Rising Demand For Flavored Confectioneries.
7. Are there any restraints impacting market growth?
; Threat of New Entrants; Bargaining Power of Buyers/Consumers; Bargaining Power of Suppliers; Threat of Substitute Products; Degree Of Competition.
8. Can you provide examples of recent developments in the market?
N/A
9. What pricing options are available for accessing the report?
Pricing options include single-user, multi-user, and enterprise licenses priced at USD 4750, USD 5250, and USD 8750 respectively.
10. Is the market size provided in terms of value or volume?
The market size is provided in terms of value, measured in Million.
11. Are there any specific market keywords associated with the report?
Yes, the market keyword associated with the report is "Confectionery Fillings Industry," which aids in identifying and referencing the specific market segment covered.
12. How do I determine which pricing option suits my needs best?
The pricing options vary based on user requirements and access needs. Individual users may opt for single-user licenses, while businesses requiring broader access may choose multi-user or enterprise licenses for cost-effective access to the report.
13. Are there any additional resources or data provided in the Confectionery Fillings Industry report?
While the report offers comprehensive insights, it's advisable to review the specific contents or supplementary materials provided to ascertain if additional resources or data are available.
14. How can I stay updated on further developments or reports in the Confectionery Fillings Industry?
To stay informed about further developments, trends, and reports in the Confectionery Fillings Industry, consider subscribing to industry newsletters, following relevant companies and organizations, or regularly checking reputable industry news sources and publications.
Methodology
Step 1 - Identification of Relevant Samples Size from Population Database


Step 2 - Approaches for Defining Global Market Size (Value, Volume* & Price*)

Note*: In applicable scenarios
Step 3 - Data Sources
Primary Research
- Web Analytics
- Survey Reports
- Research Institute
- Latest Research Reports
- Opinion Leaders
Secondary Research
- Annual Reports
- White Paper
- Latest Press Release
- Industry Association
- Paid Database
- Investor Presentations

Step 4 - Data Triangulation
Involves using different sources of information in order to increase the validity of a study
These sources are likely to be stakeholders in a program - participants, other researchers, program staff, other community members, and so on.
Then we put all data in single framework & apply various statistical tools to find out the dynamic on the market.
During the analysis stage, feedback from the stakeholder groups would be compared to determine areas of agreement as well as areas of divergence
